Search results
Jump to navigation
Jump to search
Page title matches
File:Figure D-3E.jpg (1,599 × 2,000 (797 KB)) - 18:33, 4 April 2016
File:Figure D-3A.jpg (2,000 × 1,178 (1.04 MB)) - 18:21, 4 April 2016
File:Figure D-11.jpg (1,118 × 3,257 (428 KB)) - 20:05, 1 April 2016
File:Figure D-3B.jpg (2,000 × 1,610 (690 KB)) - 18:22, 4 April 2016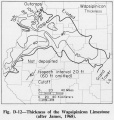
File:Figure D-12.jpg (1,060 × 1,114 (249 KB)) - 20:07, 1 April 2016
File:Figure D-3C.jpg (2,000 × 1,488 (601 KB)) - 18:29, 4 April 2016
File:Figure D-1.jpg (1,873 × 3,304 (777 KB)) - 19:51, 1 April 2016
File:Figure D-13.jpg (1,068 × 1,278 (291 KB)) - 20:08, 1 April 2016
File:Figure D-3D.jpg (1,344 × 2,000 (732 KB)) - 18:31, 4 April 2016
File:Figure D-2.jpg (2,239 × 2,490 (546 KB)) - 19:52, 1 April 2016
File:Figure D-14.jpg (1,048 × 1,428 (232 KB)) - 20:09, 1 April 2016
File:Figure D-4.jpg (2,253 × 1,605 (408 KB)) - 19:56, 1 April 2016
File:Figure D-15.jpg (1,076 × 1,466 (211 KB)) - 20:11, 1 April 2016
File:Figure D-5.jpg (3,349 × 2,143 (779 KB)) - 19:57, 1 April 2016
File:Figure D-16.jpg (1,064 × 1,615 (273 KB)) - 20:12, 1 April 2016
File:Figure D-6.jpg (2,105 × 3,295 (1.56 MB)) - 19:58, 1 April 2016
File:Figure D-17.jpg (1,084 × 1,643 (252 KB)) - 20:13, 1 April 2016
File:Figure D-7.jpg (1,092 × 2,057 (525 KB)) - 19:59, 1 April 2016
File:Figure D-18.jpg (1,046 × 1,600 (283 KB)) - 20:15, 1 April 2016
File:Figure D-8.jpg (1,060 × 1,089 (245 KB)) - 20:00, 1 April 2016
File:Figure D-19.jpg (1,080 × 1,084 (194 KB)) - 20:17, 1 April 2016
File:Figure D-9.jpg (1,100 × 1,227 (211 KB)) - 20:03, 1 April 2016
File:Figure D-20.jpg (1,076 × 795 (152 KB)) - 20:17, 1 April 2016
File:Figure D-10.jpg (1,100 × 2,018 (318 KB)) - 20:04, 1 April 2016


Page text matches
- Figure D-3A.jpg|{{file:Figure D-3A.jpg}} Figure D-3B.jpg|{{file:Figure D-3B.jpg}}4 KB (626 words) - 20:53, 5 January 2017
- Figure D-3A.jpg|{{file:Figure D-3A.jpg}} Figure D-3B.jpg|{{file:Figure D-3B.jpg}}5 KB (698 words) - 21:35, 6 January 2017
File:C605-Figure-26.jpg |File name=C605-Figure-26.jpg |image_no=Figure 26(1,573 × 1,782 (285 KB)) - 13:51, 23 August 2023
File:C605-Figure-27.jpg |File name=C605-Figure-27.jpg |image_no=Figure 27(1,418 × 1,307 (196 KB)) - 15:59, 17 August 2023- Figure D-3A.jpg|{{file:Figure D-3A.jpg}} Figure D-3B.jpg|{{file:Figure D-3B.jpg}}9 KB (1,405 words) - 20:41, 5 January 2017
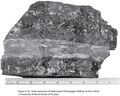
File:Penn carbondale 4-76.jpg |Caption=Figure 4-76. Hand specimen of “blue band.” Photograph 2008 by Scott D. Elrick(2,401 × 1,923 (2.04 MB)) - 21:28, 4 January 2021
File:C605-Figure-37.jpg |File name=C605-Figure-37.jpg |image_no=Figure 37(1,535 × 1,872 (579 KB)) - 19:29, 23 August 2023- Figure D-3A.jpg|{{file:Figure D-3A.jpg}} Figure D-3B.jpg|{{file:Figure D-3B.jpg}}10 KB (1,478 words) - 17:18, 11 January 2017
- Figure P-9.jpg|{{file:Figure P-9.jpg}} Figure P-3A.jpg|{{file:Figure P-3A.jpg}}7 KB (1,108 words) - 21:46, 27 January 2017
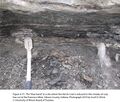
File:Penn carbondale 4-77.jpg |Caption=Figure 4-77. The “blue band” at a site where the Herrin Coal is reduced to th(2,401 × 2,041 (4.22 MB)) - 21:29, 4 January 2021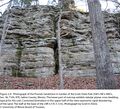
File:Penn caseyville 2-8.jpg Figure 2-8. Photograph of the Pounds Sandstone in Garden of the Gods State Park (S(2,201 × 2,002 (4.3 MB)) - 21:37, 24 November 2020- Figure D-6.jpg|{{file:Figure D-6.jpg}}2 KB (341 words) - 21:50, 6 January 2017
- Figure D-3C.jpg|{{file:Figure D-3C.jpg}} Figure D-3D.jpg|{{file:Figure D-3D.jpg}}6 KB (824 words) - 21:39, 6 January 2017
- Figure D-3C.jpg|{{file:Figure D-3C.jpg}}4 KB (561 words) - 22:03, 6 January 2017
- Figure P-13.jpg|{{file:Figure P-13.jpg}}3 KB (397 words) - 15:56, 25 January 2017
- Figure 14.jpg|{{file:Figure 14.jpg}} Figure P-3D.jpg|{{file:Figure P-3D.jpg}}3 KB (482 words) - 22:16, 19 January 2017
- Figure D-3C.jpg|{{file:Figure D-3C.jpg}} Figure D-3D.jpg|{{file:Figure D-3D.jpg}}6 KB (895 words) - 17:24, 11 January 2017
- Figure D-3B.jpg|{{file:Figure D-3B.jpg}}4 KB (597 words) - 21:23, 9 January 2017
- Figure D-3A.jpg|{{file:Figure D-3A.jpg}}5 KB (722 words) - 17:33, 9 January 2017
- Figure D-3C.jpg|{{file:Figure D-3C.jpg}}5 KB (632 words) - 17:46, 11 January 2017
- Figure D-6.jpg|{{file:Figure D-6.jpg}}3 KB (425 words) - 17:33, 11 January 2017
- Figure M-1B.jpg|{{file:Figure M-1B.jpg}} Figure M-1D.jpg|{{file:Figure M-1D.jpg}}3 KB (473 words) - 15:25, 18 January 2017
- ...shown in figure 6, and the spatial relations are shown diagrammatically in figure 8.2 KB (299 words) - 20:56, 12 January 2017
- Figure P-3A.jpg|{{file:Figure P-3A.jpg}} Figure P-3B.jpg|{{file:Figure P-3B.jpg}}24 KB (3,468 words) - 22:19, 19 January 2017
- Figure P-3A.jpg|{{file:Figure P-3A.jpg}} Figure P-3B.jpg|{{file:Figure P-3B.jpg}}24 KB (3,468 words) - 16:01, 20 January 2017
- ...lt or overlying beds. Its spatial relations are shown diagrammatically in figure 8. The geographic distribution of the member is shown in figure 6.2 KB (318 words) - 22:21, 3 January 2017
- the idealized sequence shown in figure P-7 is rarely complete, the units that are present have the same relative p Figure P-3A.jpg|{{file:Figure P-3A.jpg}}24 KB (3,539 words) - 16:05, 20 January 2017
- Figure K-1A.jpg|{{file:Figure K-1A.jpg}} Figure K-1B.jpg|{{file:Figure K-1B.jpg}}9 KB (1,278 words) - 18:06, 21 November 2016
- Figure P-2.jpg|{{file:Figure P-2.jpg}}3 KB (399 words) - 18:34, 27 January 2017
- Figure 14.jpg|{{file:Figure 14.jpg}} Figure P-3D.jpg|{{file:Figure P-3D.jpg}}4 KB (561 words) - 22:48, 19 January 2017
- Figure D-3A.jpg|{{file:Figure D-3A.jpg}}6 KB (817 words) - 19:34, 22 October 2019
- Figure P-13.jpg|{{file:Figure P-13.jpg}}4 KB (474 words) - 16:56, 25 January 2017
- Figure P-2.jpg|{{file:Figure P-2.jpg}}3 KB (460 words) - 21:16, 27 January 2017
- ...the Winnebago to adjacent stratigraphic units is shown diagrammatically in figure 8. ...ic distribution of the formation at the surface is indicated on the map in figure 6.5 KB (697 words) - 20:55, 12 January 2017
- Figure K-1A.jpg|{{file:Figure K-1A.jpg}} Figure K-1B.jpg|{{file:Figure K-1B.jpg}}9 KB (1,353 words) - 16:29, 11 January 2017
- Figure M-1B.jpg|{{file:Figure M-1B.jpg}} Figure M-1D.jpg|{{file:Figure M-1D.jpg}}4 KB (560 words) - 15:25, 22 October 2019
- ...in figure 6, and its spatial relationship is indicated diagrammatically in figure 7.5 KB (773 words) - 22:14, 3 January 2017
- ...shown in figure 6, and the spatial relations are shown diagrammatically in figure 8.3 KB (349 words) - 21:10, 12 January 2017
- Figure D-3B.jpg|{{file:Figure D-3B.jpg}}6 KB (837 words) - 21:25, 22 October 2019
- ...lt or overlying beds. Its spatial relations are shown diagrammatically in figure 8. The geographic distribution of the member is shown in figure 6.3 KB (385 words) - 20:43, 12 January 2017
- Figure C-1C.jpg|{{file:Figure C-1C.jpg}}4 KB (541 words) - 21:00, 28 November 2016
- Figure S-2A.jpg|{{file:Figure S-2A.jpg}} Figure S-2B.jpg|{{file:Figure S-2B.jpg}}7 KB (1,052 words) - 20:03, 4 January 2017
- Figure O-2A.jpg|{{file:Figure O-2A.jpg}}5 KB (746 words) - 16:01, 21 December 2016
- The geographic extent of the Winslow Till Member is shown in figure 6. It is generally less than 20 feet thick.2 KB (347 words) - 22:28, 3 January 2017
- Spatial relations of the Plano Silt Member are shown diagrammatically in figure 8.2 KB (348 words) - 20:52, 12 January 2017
- Figure P-2.jpg|{{file:Figure P-2.jpg}}3 KB (475 words) - 20:09, 27 January 2017
- ...in figure 6, and its spatial relationship is indicated diagrammatically in figure 7.6 KB (833 words) - 22:28, 12 January 2017
- ...is thinner. The geographic extent of the Sterling Till Member is shown in figure 6.3 KB (389 words) - 22:26, 3 January 2017
- Figure P-2.jpg|{{file:Figure P-2.jpg}}4 KB (535 words) - 22:16, 27 January 2017
- ...not more than 20 to 30 feet thick. Its geographic distribution is shown in figure 6.2 KB (362 words) - 22:19, 3 January 2017
- ...s less than 20 feet thick. The geographic extent of the member is shown in figure 6.3 KB (413 words) - 22:27, 3 January 2017
- Figure S-2A.jpg|{{file:Figure S-2A.jpg}} Figure S-2B.jpg|{{file:Figure S-2B.jpg}}13 KB (2,005 words) - 19:56, 4 January 2017
- Figure S-2A.jpg|{{file:Figure S-2A.jpg}} Figure S-2B.jpg|{{file:Figure S-2B.jpg}}8 KB (1,128 words) - 18:20, 11 January 2017
- Figure O-2A.jpg|{{file:Figure O-2A.jpg}}6 KB (814 words) - 18:37, 12 January 2017
- ...e is thinned by sub-Degonia channels in many more places than are shown in figure M-48. In several areas, sub-Pennsylvanian channels also cut into the Clore.3 KB (417 words) - 20:34, 10 January 2017
- Its spatial relations are shown in figure 8.5 KB (755 words) - 15:47, 18 November 2016
- Figure C-1A.jpg|{{File:Figure C-1A.jpg}} Figure C-1B.jpg|{{File:Figure C-1B.jpg}}12 KB (1,723 words) - 15:46, 23 November 2016
- Figure C-1C.jpg|{{file:Figure C-1C.jpg}}4 KB (620 words) - 22:57, 11 January 2017
- Figure S-2A.jpg|{{file:Figure S-2A.jpg}} Figure S-2B.jpg|{{file:Figure S-2B.jpg}}14 KB (2,077 words) - 18:14, 11 January 2017
- Spatial relations of the Plano Silt Member are shown diagrammatically in figure 8.3 KB (391 words) - 20:51, 12 January 2017
- Figure C-1A.jpg|{{File:Figure C-1A.jpg}} Figure C-1B.jpg|{{File:Figure C-1B.jpg}}12 KB (1,792 words) - 20:42, 11 January 2017
- ...in the Glasford Formation. This relationship is shown diagrammatically in figure 7.<br>4 KB (520 words) - 22:41, 3 January 2017
- ...ically in figure 7, and the geographic extent of the formation is shown in figure 6. It is the formation underlying the loess in most of the area mapped as I11 KB (1,564 words) - 22:23, 3 January 2017
- The geographic extent of the Winslow Till Member is shown in figure 6. It is generally less than 20 feet thick.3 KB (414 words) - 22:03, 12 January 2017
- Its spatial relations are shown in figure 8.6 KB (818 words) - 21:04, 12 January 2017
- ...ven in tables 4 and 5, its spatial relations are shown diagrammatically in figure 8, and radiocarbon dates are listed in table 1. Its character is described4 KB (579 words) - 22:20, 3 January 2017
- ...is thinner. The geographic extent of the Sterling Till Member is shown in figure 6.3 KB (456 words) - 22:01, 12 January 2017
- the map in figure 6.4 KB (599 words) - 07:08, 28 December 2016
- ...ties, Illinois. Across the border in Gibson County, Indiana, Eggert (1994, figure 6) mapped a “fluvial sandstone-filled channel associated with the Survant8 KB (1,158 words) - 16:36, 9 February 2022
- ...me of their unit boundaries are different from those of Lineback et al. In figure 8, we follow Foster and Colman (1991) for lithostratigraphic unit boundarie15 KB (2,217 words) - 20:19, 22 December 2016
- ...and characteristic (fig. M-4). Several conodont assemblage zones, shown in figure M-25, are useful in differentiating Chesterian rocks (Collinson et al., 1977 KB (965 words) - 16:17, 10 January 2017
- ...s less than 20 feet thick. The geographic extent of the member is shown in figure 6.3 KB (488 words) - 22:08, 12 January 2017
- ...ically in figure 7, and the geographic extent of the formation is shown in figure 6. It is the formation underlying the loess in most of the area mapped as I11 KB (1,623 words) - 21:14, 12 January 2017
- ...n Nelson of the ISGS logged the core in 2008. As shown on the graphic log (Figure 4-69), the Bucktown is 3.7 ft (1.13 m) thick and occurs in the depth range Direct comparison of the Bucktown reference core (Figure 4-69) with the Briar Hill reference sections (Figures 4-61 and 4-67) demons7 KB (1,034 words) - 16:39, 9 February 2022
- ...me of their unit boundaries are different from those of Lineback et al. In figure 8, we follow Foster and Colman (1991) for lithostratigraphic unit boundarie15 KB (2,276 words) - 20:48, 22 December 2016
- ...e is thinned by sub-Degonia channels in many more places than are shown in figure M-48. In several areas, sub-Pennsylvanian channels also cut into the Clore.4 KB (490 words) - 16:24, 13 January 2017
- ...c extent of the Banner Formation where it is the surface drift is shown in figure 6, but in the subsurface it is present locally throughout much of western,10 KB (1,522 words) - 22:46, 3 January 2017
- ...in the Glasford Formation. This relationship is shown diagrammatically in figure 7.<br>4 KB (582 words) - 22:31, 12 January 2017
- ...and characteristic (fig. M-4). Several conodont assemblage zones, shown in figure M-25, are useful in differentiating Chesterian rocks (Collinson et al., 1977 KB (1,034 words) - 15:54, 13 January 2017
- ...ven in tables 4 and 5, its spatial relations are shown diagrammatically in figure 8, and radiocarbon dates are listed in table 1. Its character is described5 KB (644 words) - 20:41, 12 January 2017
- ...c extent of the Banner Formation where it is the surface drift is shown in figure 6, but in the subsurface it is present locally throughout much of western,11 KB (1,578 words) - 22:33, 12 January 2017
- ...acobson (1987) published a section from the Chinook Mine in the type area (Figure 4-6), but these pits have been backfilled and exposures no longer exist. ...ignated as the principal reference section for the Seelyville Coal Member (Figure 4-7). This hole (IGS ID #115871) was drilled in sec. 2, T 2 S, R 721 KB (3,132 words) - 16:14, 9 February 2022
- ...y borehole SDH-306, drilled in sec. 2, T 2 S, R 7 W, Pike County, Indiana (Figure 4-7). ...em (Wanless 1957, geologic section 39, p. 204–205) would have served well (Figure 4-43). Unfortunately, Peppers (1970, p. 50) reported that the section Wanle13 KB (1,879 words) - 16:37, 9 February 2022
- ...41.5 to 41.7 m) in this core and directly overlies the Mecca Quarry Shale (Figure 4-7).5 KB (719 words) - 16:36, 9 February 2022
- ...cause this section was never published, it is reproduced here graphically (Figure 4-30) and verbally (below):<br> ...of the Survant type section in sec. 2, T 2 S, R 7 W, Pike County, Indiana (Figure 4-7). This core exemplifies the Survant Member where its constituent Wheele23 KB (3,526 words) - 16:36, 9 February 2022
- The spatial relations of the Loveland are shown diagrammatically in figure 7. The silts intercalated with the tills of Illinoian age are separately na6 KB (856 words) - 22:23, 3 January 2017
- ...ill cores in Iowa have been designated as Swede Hollow reference sections (Figure 4-33). All three cores contain the Wheeler and Bevier coals. Gentile and Th8 KB (1,214 words) - 16:36, 9 February 2022
- ...ld Coal is in the depth range 245.6 to 251.5 ft; the base was not reached (Figure 4-56). The hole was drilled into Peabody Coal Company’s Mine No. 59, wher ...apped two large regions of thick Springfield Coal. The map presented here (Figure 4-57) has been modified from Hatch and Affolter (2002). The larger area cov16 KB (2,297 words) - 16:14, 9 February 2022
- The spatial relations of the Loveland are shown diagrammatically in figure 7. The silts intercalated with the tills of Illinoian age are separately na6 KB (911 words) - 21:17, 12 January 2017
- ...ondale into Kentucky; Cumings (1922) did the same for Indiana. As shown by Figure 4-1, numerous authors adjusted the unit boundaries. Some authors ranked the ...o the Davis Coal, currently considered the basal member of the Carbondale (Figure 4-2). Nonetheless, this is a good reference for the Carbondale in western I21 KB (3,121 words) - 16:14, 9 February 2022
- ...Adair 7.5' quadrangle. A graphic version of the section is presented here (Figure 4-21). Wanless described the unit as being 39 ft 6 in. (12.0 m) thick and c ...k and occurs in the depth interval from 264.7 to 303.0 ft (80.7 to 92.4 m; Figure 4-22). The core contains abundant plant fossils.16 KB (2,366 words) - 16:29, 9 February 2022
- ...from the type Hanover Limestone. However, another version of the section (Figure 4-46) by Van Pelt and Hendricks shows “maybe 20 to 24 feet” (6 to 7 m) ...r is 0.7 ft (21 cm) thick and lies at 352.0 to 352.7 ft (107.3 to 107.5 m; Figure 4-44). The same core is the reference section for the Houchin Creek Coal an12 KB (1,717 words) - 16:17, 9 February 2022
- ...sburg to be about 15 ft (4.5 m) thick. A graphic section from field notes (Figure 4-58) shows that the base of the Dykersburg was under water at the time the ...ick and lies at the depth interval of 491.9 to 537.9 ft (149.9 to 164.0 m; Figure 4-59).17 KB (2,584 words) - 19:41, 23 August 2023
- The section illustrated here (Figure 4-25) is from Smith et al. (1970, p. 15). This section illustrates the mult ...in the depth interval of 136.2 to 136.8 ft (41.5 to 41.7 m) in this core (Figure 4-7).15 KB (2,214 words) - 16:29, 9 February 2022
- ...in the depth interval of 452 ft 2 in. to 458 ft 10 in. (137.8 to 139.9 m; Figure 4-74). ...Within this larger area, the thickest coal borders the Walshville channel (Figure 4-75). Here, the Herrin is thicker than 8 ft (2.4 m) in large areas and loc18 KB (2,748 words) - 16:35, 9 February 2022
- ...comparison of the type and reference sections of the Caseyville Formation (Figure 2-2) raises doubts about the continuity of the unit. The interval between t ...unit labeled “Battery Rock Sandstone” in the type and reference sections (Figure 2-2) actually is the same sandstone, the tectonic subsidence rate must have11 KB (1,561 words) - 16:34, 9 February 2022
- ...ea illustrate the relationship of the Colchester Coal to enclosing strata (Figure 4-18). ...0 cm) thick at a depth of 140.6 to 141.6 ft (42.9 to 43.2 m) in this core (Figure 4-19).17 KB (2,555 words) - 16:30, 9 February 2022
- Wier (1961). The section (Figure 4-66) leaves much to be desired because it does not position the Antioch re7 KB (940 words) - 16:38, 9 February 2022
- ...the entire core; a graphic log of the relevant portion is presented here (Figure 4-13). ...guish this seam from the Dekoven, which lacks overlying radioactive shale (Figure 4-14).12 KB (1,795 words) - 16:31, 9 February 2022
- ....7 ft (52 cm) thick and occurs in the depth interval from 51.0 to 52.7 ft (Figure 4-60). This core doubles as the type section of the [[Turner Mine Shale Mem9 KB (1,249 words) - 16:16, 9 February 2022
- ...is 3.8 ft (1.16 m) thick at a depth of 136.8 to 140.6 ft (41.7 to 42.9 m; Figure 4-7).11 KB (1,588 words) - 16:29, 9 February 2022
- ...s Landing below Battery Rock” in Hardin County, Illinois (Lee 1916, p. 15; Figure 2-1). Lee (1916, p. 15–16) created the original description (Figure 2-2). Kosanke et al. (1960) and Nelson (1989) reproduced the section. Geolo54 KB (7,756 words) - 16:31, 9 February 2022


