Search results
Jump to navigation
Jump to search
Page title matches
File:Figure C-11.jpg (1,052 × 1,966 (263 KB)) - 20:24, 6 April 2016
File:Figure C-1D.jpg (1,387 × 2,000 (776 KB)) - 20:19, 6 April 2016
File:Figure C-7.jpg (1,081 × 1,991 (261 KB)) - 20:22, 6 April 2016
File:Figure C-8.jpg (1,056 × 1,967 (260 KB)) - 20:26, 6 April 2016
File:Figure C-9.jpg (1,098 × 2,008 (231 KB)) - 20:26, 6 April 2016
File:Figure C-10.jpg (1,076 × 1,313 (204 KB)) - 20:24, 6 April 2016
File:Figure C-12.jpg (1,051 × 1,952 (298 KB)) - 20:23, 6 April 2016
File:Figure C-2.jpg (1,093 × 1,998 (321 KB)) - 20:18, 6 April 2016
File:Figure C-13.jpg (1,050 × 1,987 (293 KB)) - 20:21, 6 April 2016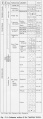
File:Figure C-3.jpg (1,086 × 3,012 (377 KB)) - 17:19, 25 May 2016
File:Figure C-1A.jpg (1,917 × 1,187 (1,023 KB)) - 20:18, 6 April 2016
File:Figure C-4.jpg (2,113 × 1,914 (585 KB)) - 20:18, 6 April 2016
File:Figure C-1B.jpg (1,509 × 2,000 (1.18 MB)) - 20:18, 6 April 2016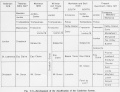
File:Figure C-5.jpg (2,209 × 1,696 (388 KB)) - 20:17, 6 April 2016
File:Figure C-1C.jpg (1,482 × 2,000 (788 KB)) - 20:19, 6 April 2016
File:Figure C-6.jpg (1,058 × 1,973 (233 KB)) - 20:26, 6 April 2016
File:Figure C-3 imagemap.jpg (350 × 971 (100 KB)) - 15:08, 30 November 2016


Page text matches
- Figure D-3A.jpg|{{file:Figure D-3A.jpg}} Figure D-3B.jpg|{{file:Figure D-3B.jpg}}4 KB (626 words) - 20:53, 5 January 2017
- Figure D-3A.jpg|{{file:Figure D-3A.jpg}} Figure D-3B.jpg|{{file:Figure D-3B.jpg}}5 KB (698 words) - 21:35, 6 January 2017
- Figure D-3C.jpg|{{file:Figure D-3C.jpg}}4 KB (561 words) - 22:03, 6 January 2017
- Figure P-2.jpg|{{file:Figure P-2.jpg}} Figure P-5.jpg|{{file:Figure P-5.jpg}}5 KB (747 words) - 22:02, 24 January 2017
- Figure D-3C.jpg|{{file:Figure D-3C.jpg}}5 KB (632 words) - 17:46, 11 January 2017
File:C605-Figure-37.jpg |File name=C605-Figure-37.jpg |image_no=Figure 37(1,535 × 1,872 (579 KB)) - 19:29, 23 August 2023
File:C605-Figure-05a.jpg |File name=C605-Figure-05a.jpg |image_no=Figure 5a(1,905 × 1,774 (937 KB)) - 15:43, 17 August 2023
File:C605-Figure-05b.jpg |File name=C605-Figure-05b.jpg |image_no=Figure 5b(2,000 × 2,085 (1.13 MB)) - 15:43, 17 August 2023
File:104-Figure 9.jpg Figure 9 -- History of the litho-stratigraphic classification of the Mason Group d(1,527 × 2,000 (345 KB)) - 16:24, 19 April 2016
File:Penn carbondale 4-44.jpg |Caption=Figure 4-44. Graphic log of core (partial) from Freeman United Coal Mining Compan(1,266 × 3,627 (625 KB)) - 19:19, 23 December 2020- Figure S-2A.jpg|{{file:Figure S-2A.jpg}} Figure S-2B.jpg|{{file:Figure S-2B.jpg}}13 KB (2,005 words) - 19:56, 4 January 2017
- Figure K-1A.jpg|{{file:Figure K-1A.jpg}} Figure K-1B.jpg|{{file:Figure K-1B.jpg}}3 KB (381 words) - 05:20, 28 December 2016
- Figure S-2A.jpg|{{file:Figure S-2A.jpg}} Figure S-2B.jpg|{{file:Figure S-2B.jpg}}14 KB (2,077 words) - 18:14, 11 January 2017
- Figure K-1A.jpg|{{file:Figure K-1A.jpg}} Figure K-1B.jpg|{{file:Figure K-1B.jpg}}3 KB (459 words) - 20:27, 12 January 2017
- Figure 14.jpg|{{file:Figure 14.jpg}} Figure P-3D.jpg|{{file:Figure P-3D.jpg}}3 KB (482 words) - 22:16, 19 January 2017
- ...lt or overlying beds. Its spatial relations are shown diagrammatically in figure 8. The geographic distribution of the member is shown in figure 6.2 KB (318 words) - 22:21, 3 January 2017
- Figure P-3B.jpg|{{file:Figure P-3B.jpg}}2 KB (268 words) - 16:14, 25 January 2017
- Figure P-2.jpg|{{file:Figure P-2.jpg}}2 KB (252 words) - 22:20, 19 January 2017
- Figure C-1A.jpg|{{file:Figure C-1A.jpg}} Figure C-1B.jpg|{{file:Figure C-1B.jpg}}4 KB (585 words) - 16:52, 28 November 2016
- ...shown in figure 6, and the spatial relations are shown diagrammatically in figure 8.2 KB (299 words) - 20:56, 12 January 2017


