Search results
Jump to navigation
Jump to search
Page title matches
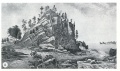
File:Figure D-3A.jpg (2,000 × 1,178 (1.04 MB)) - 18:21, 4 April 2016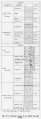
File:Figure D-11.jpg (1,118 × 3,257 (428 KB)) - 20:05, 1 April 2016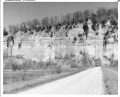
File:Figure D-3B.jpg (2,000 × 1,610 (690 KB)) - 18:22, 4 April 2016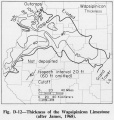
File:Figure D-12.jpg (1,060 × 1,114 (249 KB)) - 20:07, 1 April 2016


Page text matches
- Figure D-6.jpg|{{file:Figure D-6.jpg}}3 KB (425 words) - 17:33, 11 January 2017
- Figure M-1B.jpg|{{file:Figure M-1B.jpg}} Figure M-1D.jpg|{{file:Figure M-1D.jpg}}3 KB (473 words) - 15:25, 18 January 2017
- ...shown in figure 6, and the spatial relations are shown diagrammatically in figure 8.2 KB (299 words) - 20:56, 12 January 2017
- Figure P-3A.jpg|{{file:Figure P-3A.jpg}} Figure P-3B.jpg|{{file:Figure P-3B.jpg}}24 KB (3,468 words) - 22:19, 19 January 2017
- Figure P-3A.jpg|{{file:Figure P-3A.jpg}} Figure P-3B.jpg|{{file:Figure P-3B.jpg}}24 KB (3,468 words) - 16:01, 20 January 2017
- ...lt or overlying beds. Its spatial relations are shown diagrammatically in figure 8. The geographic distribution of the member is shown in figure 6.2 KB (318 words) - 22:21, 3 January 2017
- the idealized sequence shown in figure P-7 is rarely complete, the units that are present have the same relative p Figure P-3A.jpg|{{file:Figure P-3A.jpg}}24 KB (3,539 words) - 16:05, 20 January 2017
- Figure K-1A.jpg|{{file:Figure K-1A.jpg}} Figure K-1B.jpg|{{file:Figure K-1B.jpg}}9 KB (1,278 words) - 18:06, 21 November 2016
- Figure P-2.jpg|{{file:Figure P-2.jpg}}3 KB (399 words) - 18:34, 27 January 2017
- Figure 14.jpg|{{file:Figure 14.jpg}} Figure P-3D.jpg|{{file:Figure P-3D.jpg}}4 KB (561 words) - 22:48, 19 January 2017
- Figure D-3A.jpg|{{file:Figure D-3A.jpg}}6 KB (817 words) - 19:34, 22 October 2019
- Figure P-13.jpg|{{file:Figure P-13.jpg}}4 KB (474 words) - 16:56, 25 January 2017
- Figure P-2.jpg|{{file:Figure P-2.jpg}}3 KB (460 words) - 21:16, 27 January 2017
- ...the Winnebago to adjacent stratigraphic units is shown diagrammatically in figure 8. ...ic distribution of the formation at the surface is indicated on the map in figure 6.5 KB (697 words) - 20:55, 12 January 2017
- Figure K-1A.jpg|{{file:Figure K-1A.jpg}} Figure K-1B.jpg|{{file:Figure K-1B.jpg}}9 KB (1,353 words) - 16:29, 11 January 2017
- Figure M-1B.jpg|{{file:Figure M-1B.jpg}} Figure M-1D.jpg|{{file:Figure M-1D.jpg}}4 KB (560 words) - 15:25, 22 October 2019
- ...in figure 6, and its spatial relationship is indicated diagrammatically in figure 7.5 KB (773 words) - 22:14, 3 January 2017
- ...shown in figure 6, and the spatial relations are shown diagrammatically in figure 8.3 KB (349 words) - 21:10, 12 January 2017
- Figure D-3B.jpg|{{file:Figure D-3B.jpg}}6 KB (837 words) - 21:25, 22 October 2019
- ...lt or overlying beds. Its spatial relations are shown diagrammatically in figure 8. The geographic distribution of the member is shown in figure 6.3 KB (385 words) - 20:43, 12 January 2017