File:C605-Figure-02.jpg
Jump to navigation
Jump to search

Size of this preview: 500 × 600 pixels. Other resolution: 1,819 × 2,181 pixels.
Original file (1,819 × 2,181 pixels, file size: 429 KB, MIME type: image/jpeg)
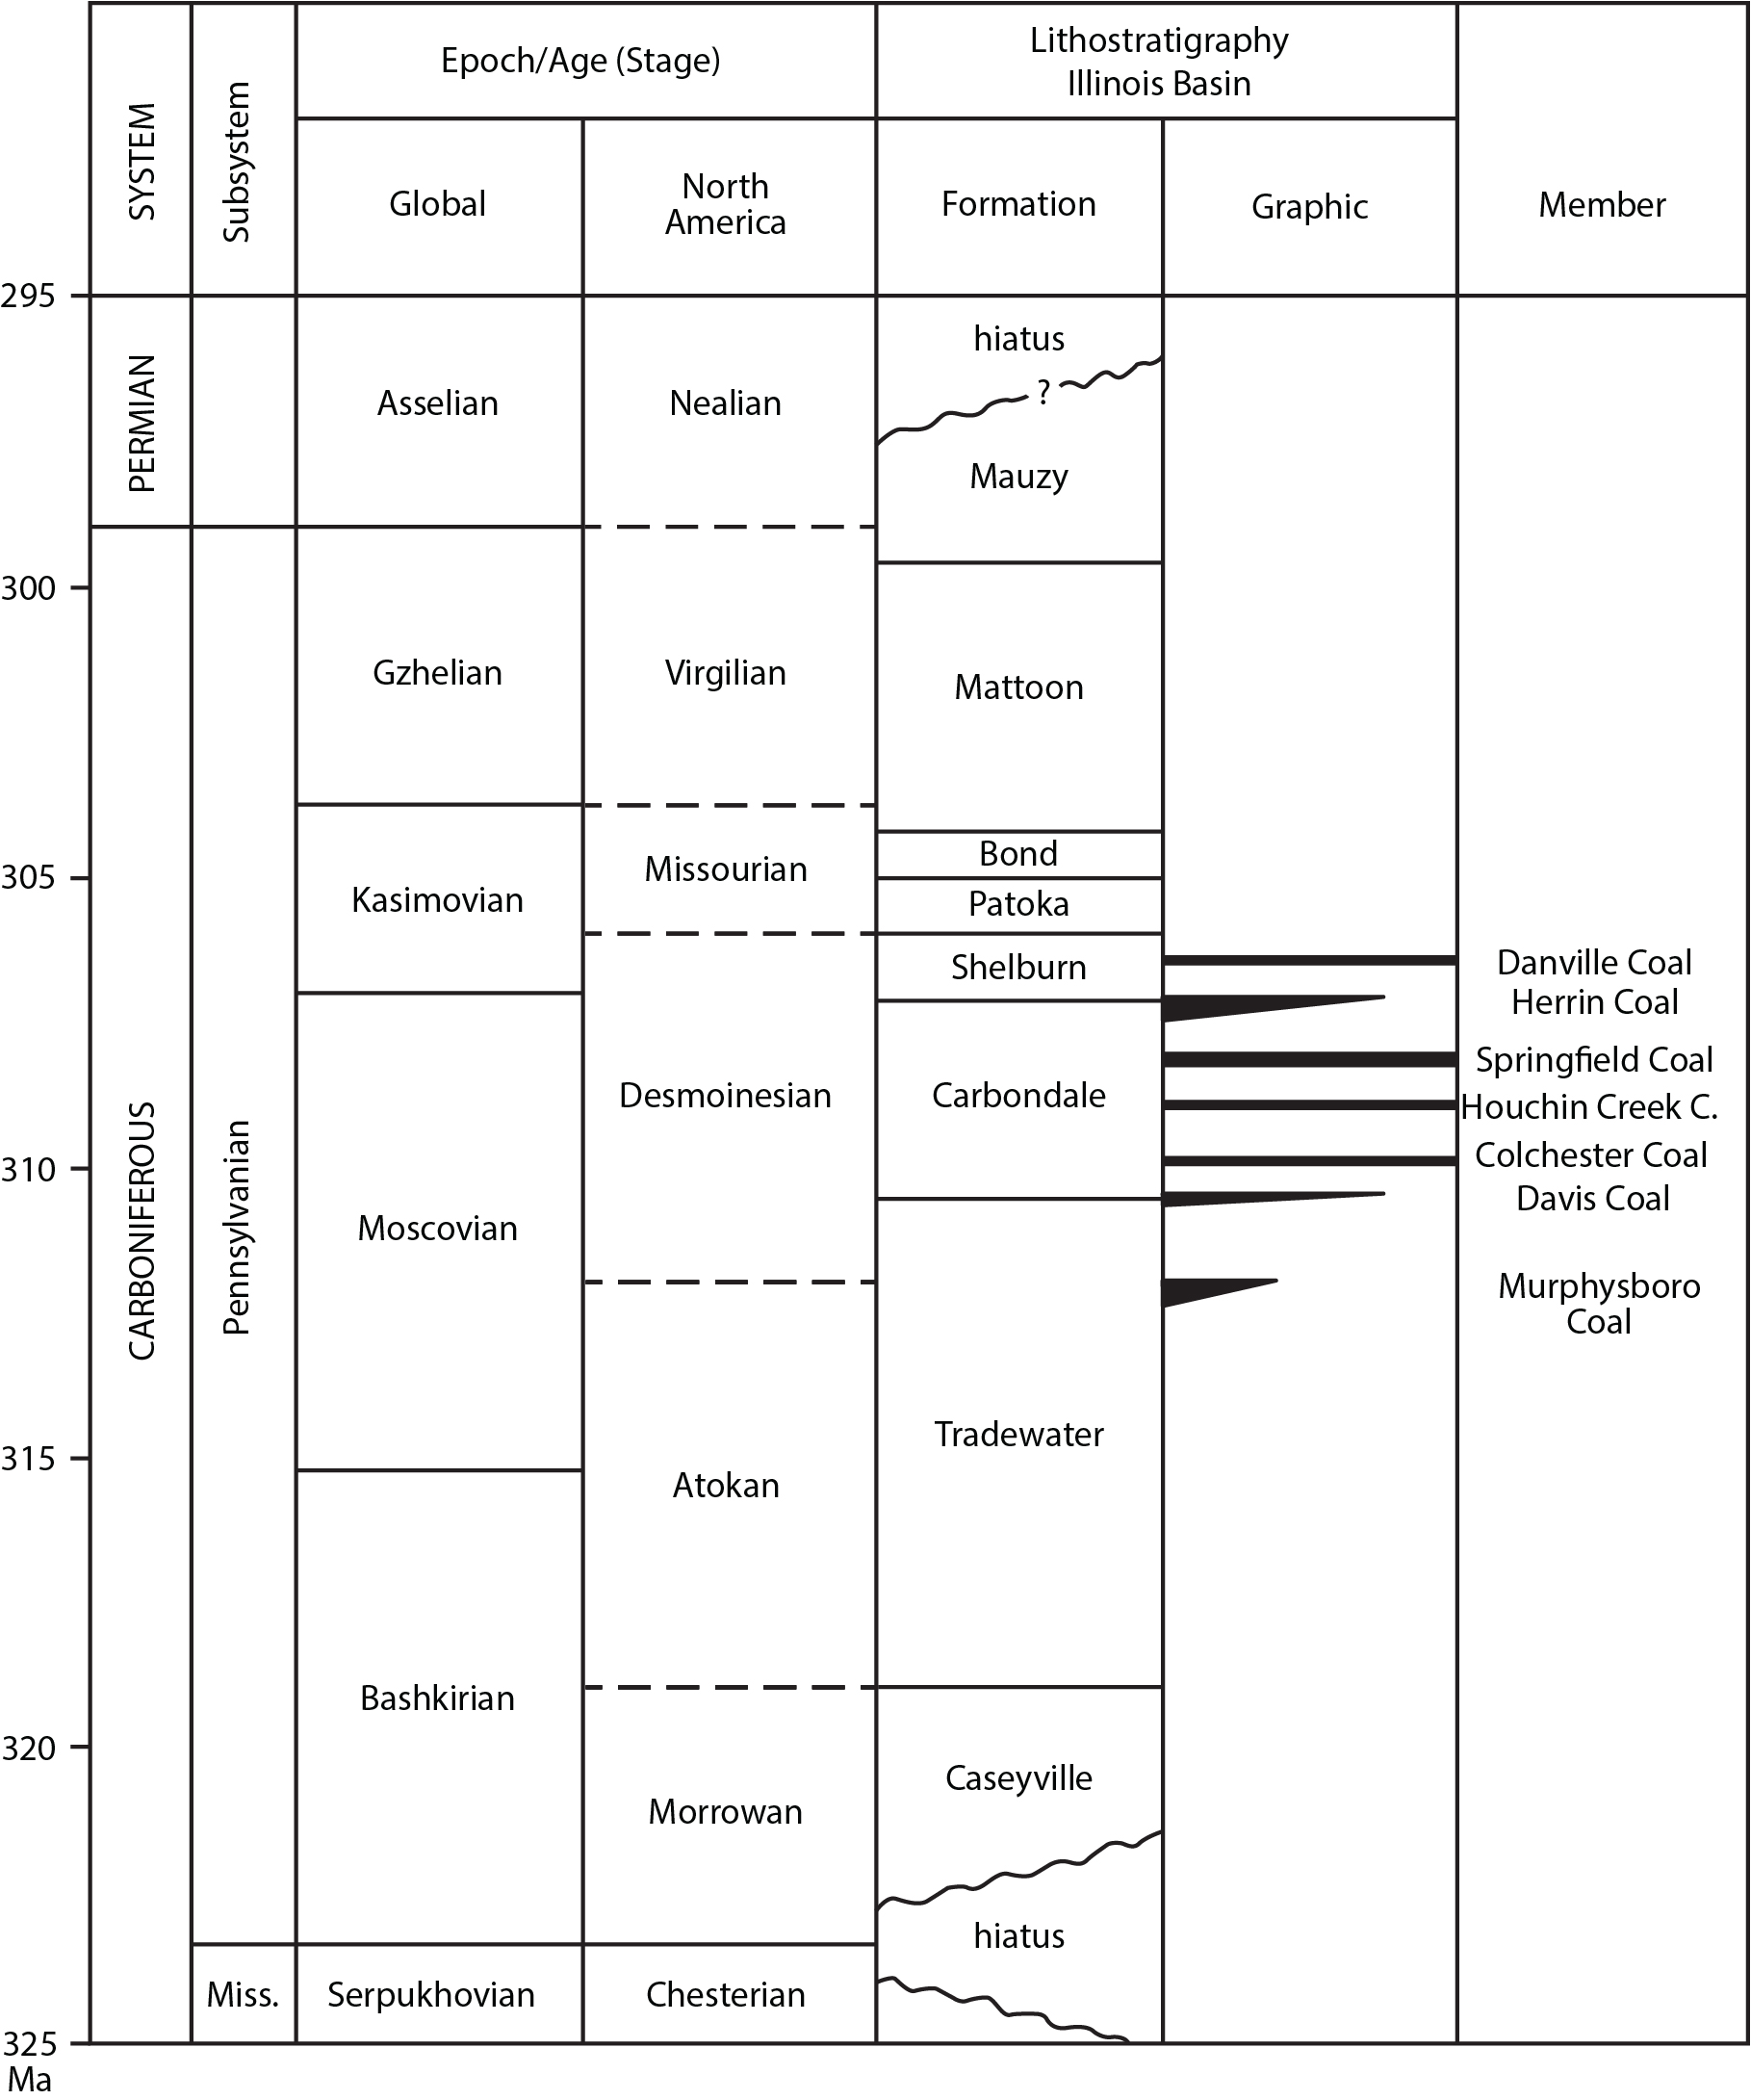
Figure 2 Correlation chart showing the positions of key units within the Pennsylvanian Subsystem. Global and provincial stage boundaries and ages in millions of years (Ma) are after Gradstein et al. (2012)[1].
- ↑ Gradstein, F.M., J.G. Ogg, M.D. Schmitz, and G.M. Ogg, 2012, The geologic time scale 2012, 1st ed.: Amsterdam, Elsevier, 1,144 p.
File history
Click on a date/time to view the file as it appeared at that time.
| Date/Time | Thumbnail | Dimensions | User | Comment | |
|---|---|---|---|---|---|
| current | ★ Approved revision 21:20, 17 July 2020 | | 1,819 × 2,181 (429 KB) | Alan.Myers (talk | contribs) | |
| 18:13, 29 June 2020 | 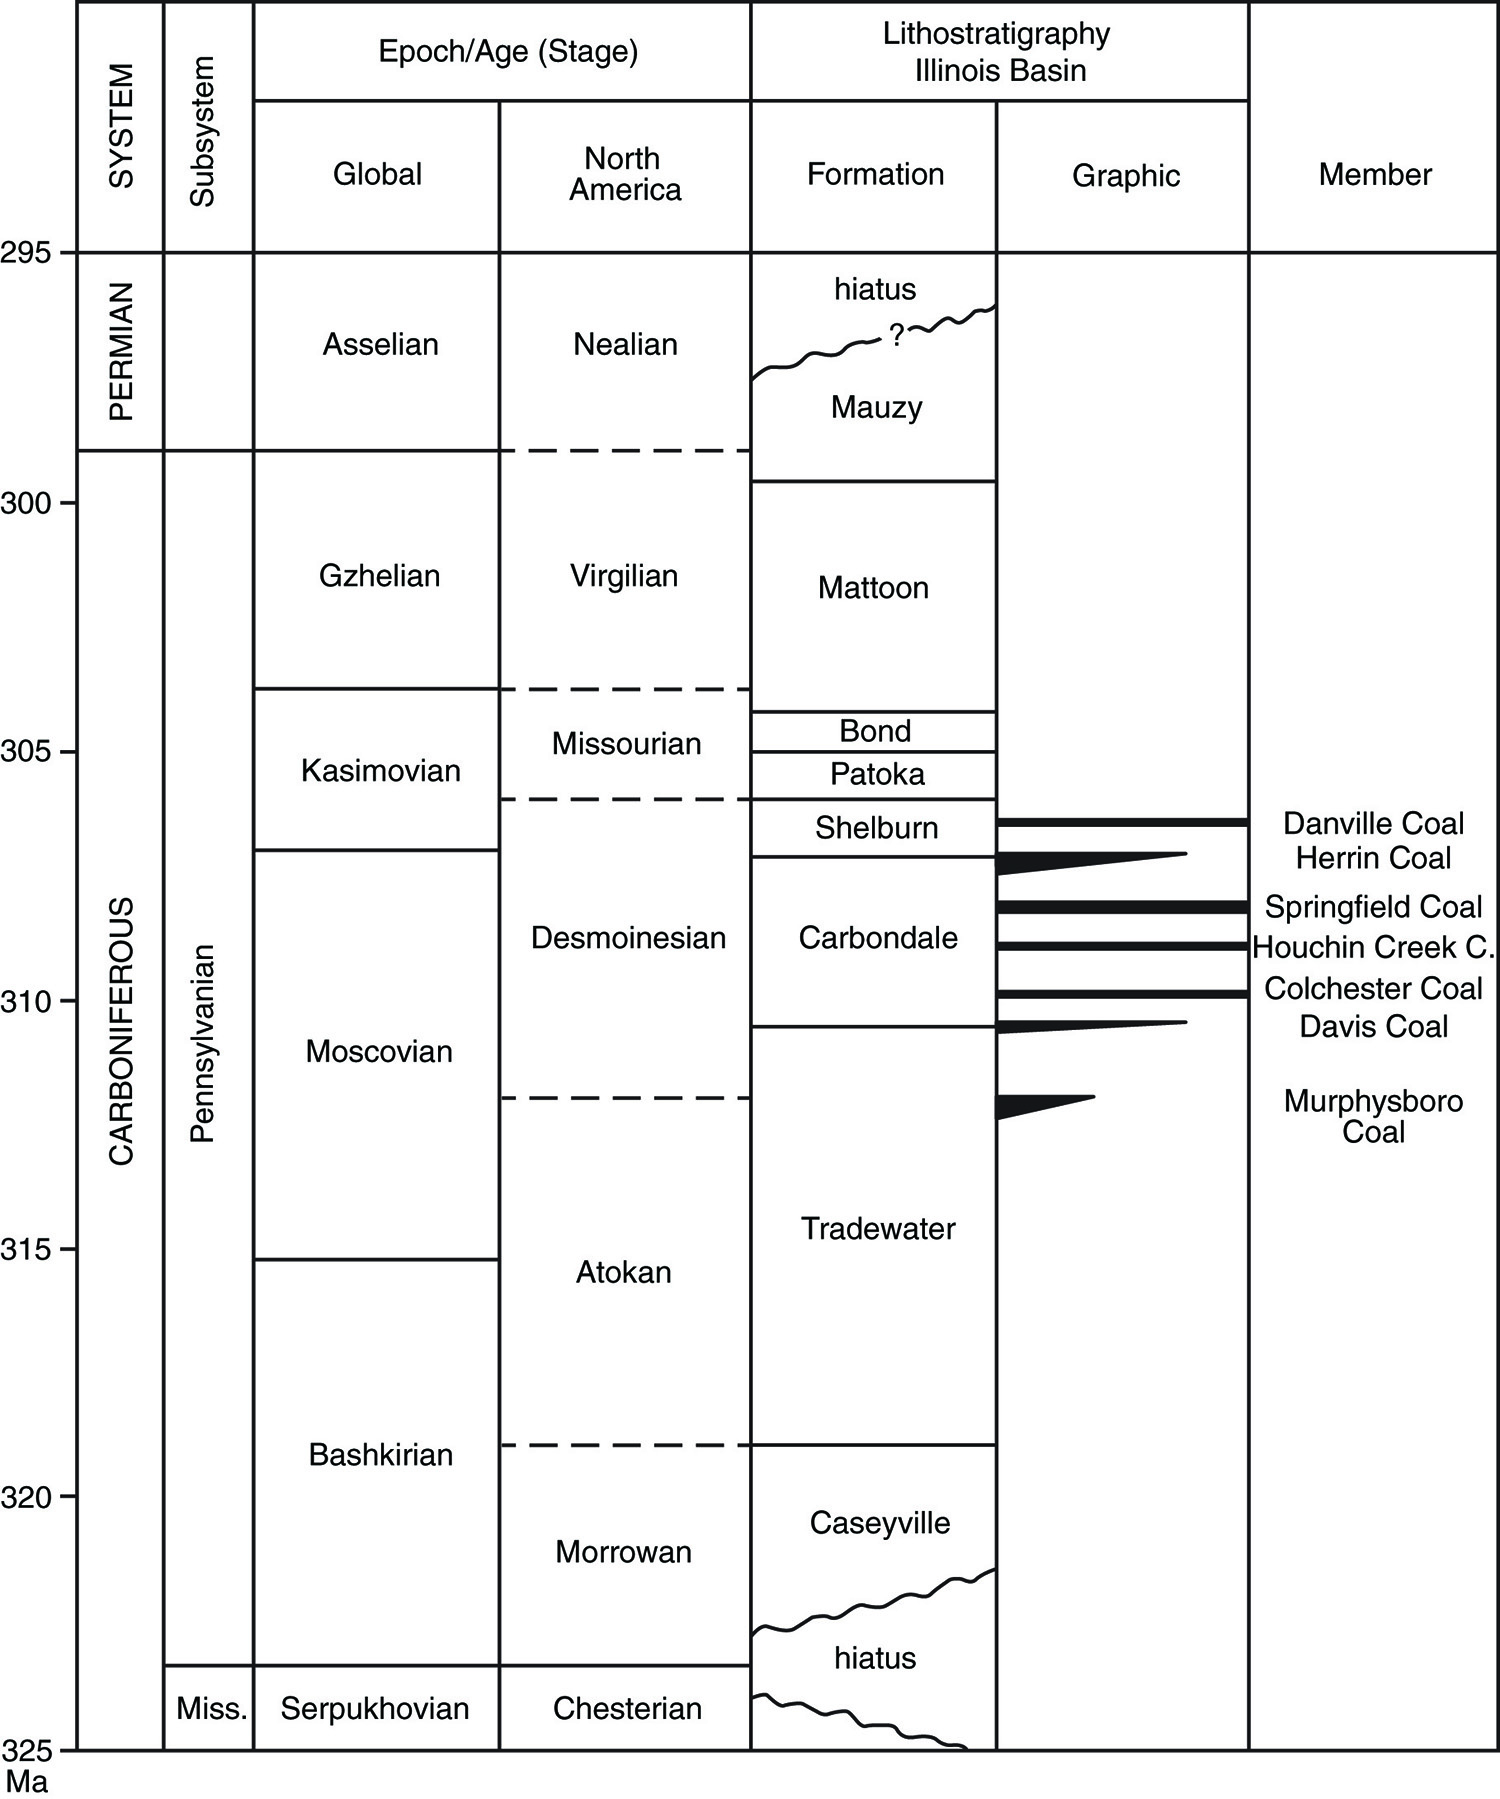 | 1,500 × 1,799 (1.08 MB) | Alan.Myers (talk | contribs) |
You cannot overwrite this file.
File usage
The following 3 pages use this file: