File:C605-Figure-02.jpg
Revision as of 18:14, 29 June 2020 by Alan.Myers (talk | contribs)

Size of this preview: 500 × 600 pixels. Other resolution: 1,819 × 2,181 pixels.
Original file (1,819 × 2,181 pixels, file size: 429 KB, MIME type: image/jpeg)
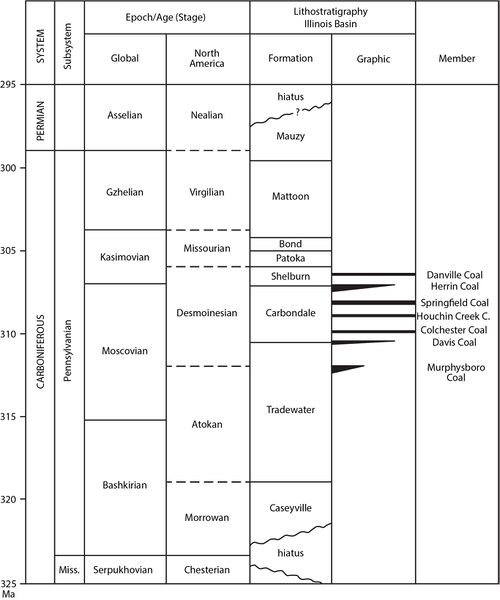
Figure 2 Correlation chart showing position of key units within the Pennsylvanian Subsystem. Global and provincial stage boundaries and ages in millions of years (Ma) are from Gradstein et al. (2012)
File history
Click on a date/time to view the file as it appeared at that time.
| Date/Time | Thumbnail | Dimensions | User | Comment | |
|---|---|---|---|---|---|
| current | ★ Approved revision 21:20, 17 July 2020 |  | 1,819 × 2,181 (429 KB) | Alan.Myers (talk | contribs) | |
| 18:13, 29 June 2020 |  | 1,500 × 1,799 (1.08 MB) | Alan.Myers (talk | contribs) |
You cannot overwrite this file.
File usage
The following 3 pages use this file: