File:C605-Figure-02.jpg: Difference between revisions
Jump to navigation
Jump to search
Alan.Myers (talk | contribs) (ILSTRAT uploaded a new version of File:C605-Figure-02.jpg) |
Alan.Myers (talk | contribs) No edit summary |
||
| Line 2: | Line 2: | ||
|File name=C605-Figure-02.jpg | |File name=C605-Figure-02.jpg | ||
|image_no=Figure 2 | |image_no=Figure 2 | ||
|caption=Correlation chart showing | |caption=Correlation chart showing the positions of key units within the Pennsylvanian Subsystem. Global and provincial stage boundaries and ages in millions of years (Ma) are after Gradstein et al. (2012). | ||
|references=Gradstein, F.M., J.G. Ogg, M.D. Schmitz, and G.M. Ogg, 2012, The geologic time scale 2012, 1st ed.: Amsterdam, Elsevier, 1,144 p. | |references=Gradstein, F.M., J.G. Ogg, M.D. Schmitz, and G.M. Ogg, 2012, The geologic time scale 2012, 1st ed.: Amsterdam, Elsevier, 1,144 p. | ||
|page1=Introduction | |page1=Introduction | ||
Revision as of 15:41, 17 August 2023
Figure 2 Correlation chart showing the positions of key units within the Pennsylvanian Subsystem. Global and provincial stage boundaries and ages in millions of years (Ma) are after Gradstein et al. (2012).
File history
Click on a date/time to view the file as it appeared at that time.
| Date/Time | Thumbnail | Dimensions | User | Comment | |
|---|---|---|---|---|---|
| current | ★ Approved revision 21:20, 17 July 2020 | 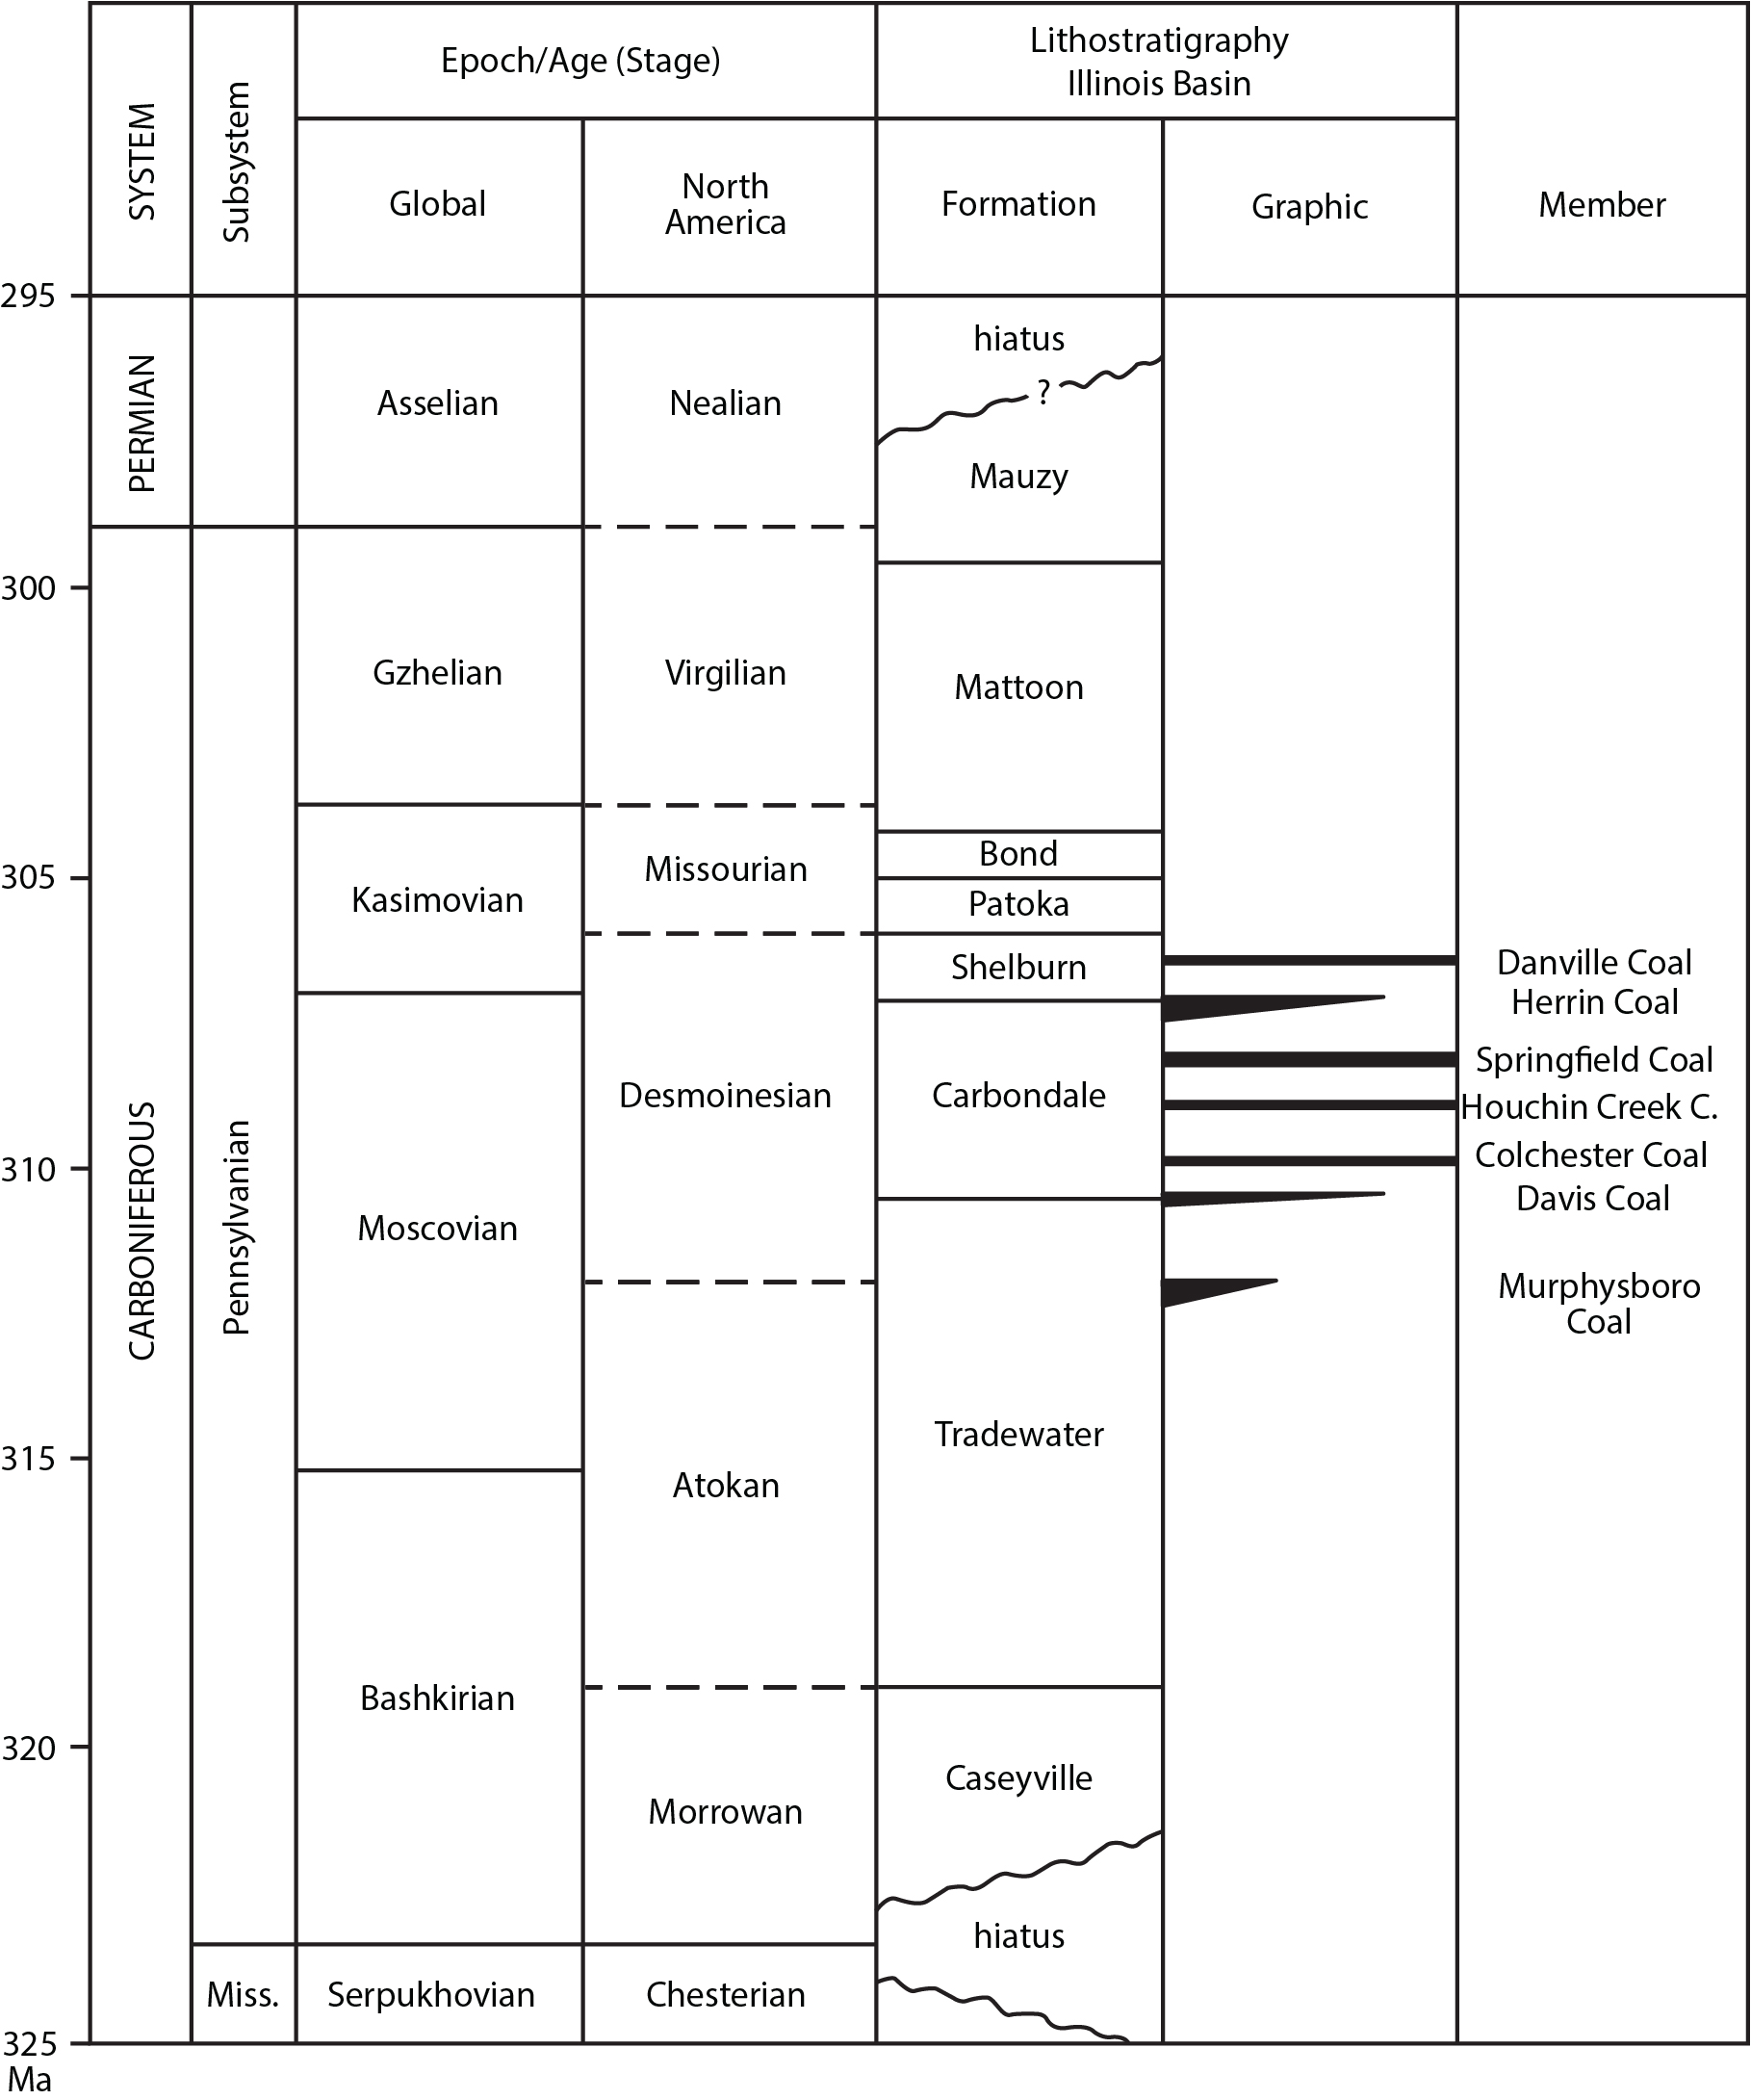 | 1,819 × 2,181 (429 KB) | Alan.Myers (talk | contribs) | |
| 18:13, 29 June 2020 | 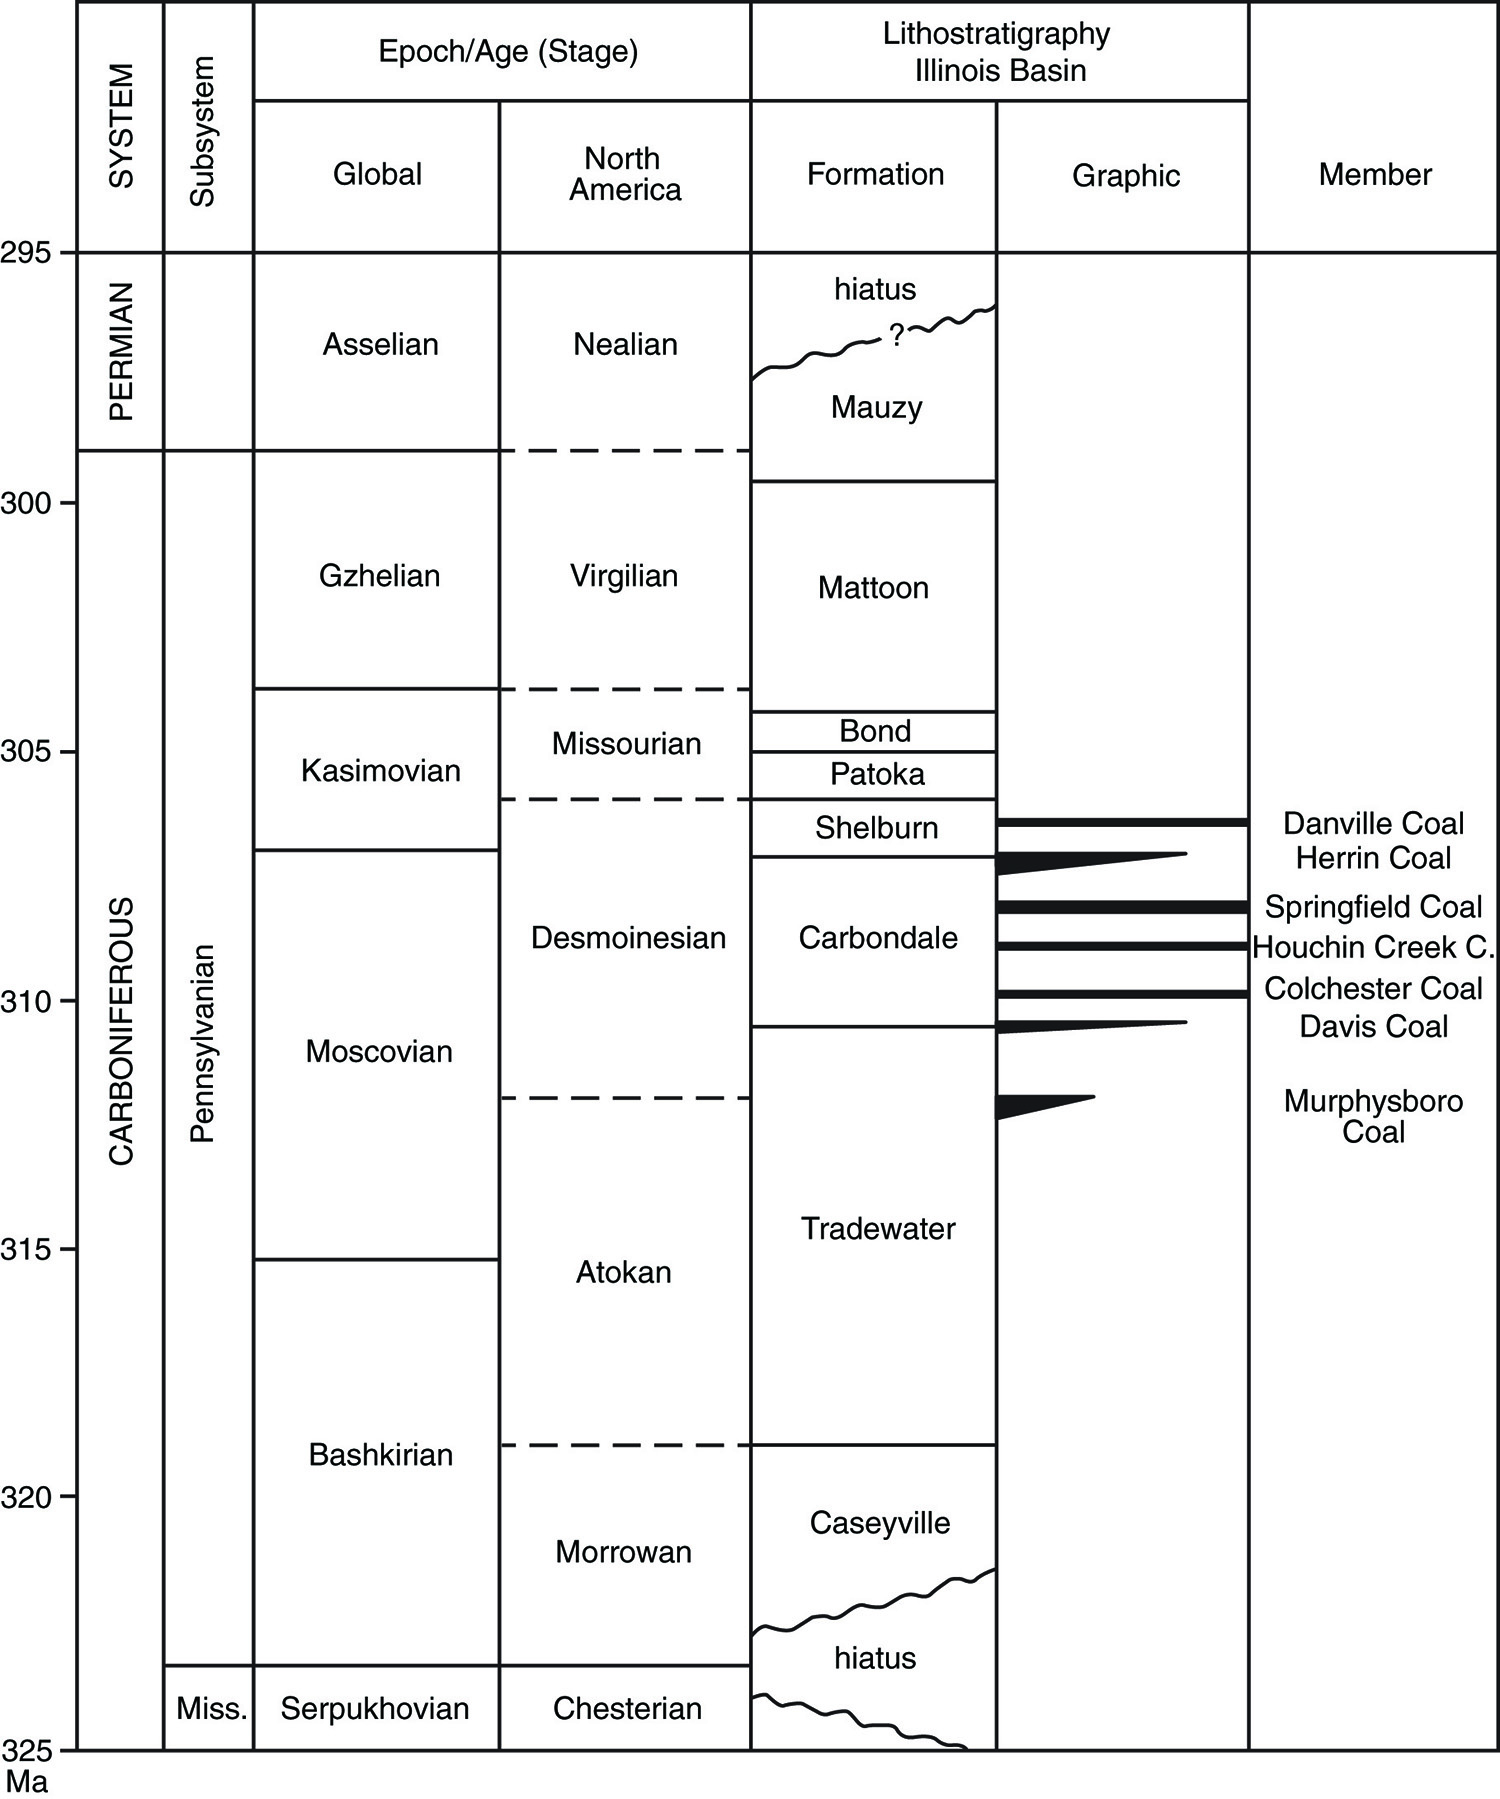 | 1,500 × 1,799 (1.08 MB) | Alan.Myers (talk | contribs) |
You cannot overwrite this file.
File usage
The following 3 pages use this file: