Search results
Jump to navigation
Jump to search
Page title matches
File:Figure D-6.jpg (2,105 × 3,295 (1.56 MB)) - 19:58, 1 April 2016
File:Figure D-17.jpg (1,084 × 1,643 (252 KB)) - 20:13, 1 April 2016
File:Figure D-7.jpg (1,092 × 2,057 (525 KB)) - 19:59, 1 April 2016
File:Figure D-18.jpg (1,046 × 1,600 (283 KB)) - 20:15, 1 April 2016


Page text matches
- ...e areas where the Springfield Coal is absent in Knox County. Eggert (1982, figure 2)<ref>Eggert, D.L., 1982, A fluvial channel contemporaneous with depositio ...mi (15 km) north of Oaktown in Sullivan County ([[:File:C605-Figure-29.jpg|Figure 29]]). As in the Oaktown Mine, shale laminae contain abundant fossil plants6 KB (931 words) - 19:16, 23 August 2023
- Figure D-3A.jpg|{{file:Figure D-3A.jpg}}5 KB (722 words) - 17:33, 9 January 2017
- Figure D-3C.jpg|{{file:Figure D-3C.jpg}}5 KB (632 words) - 17:46, 11 January 2017
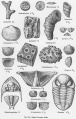
- Figure D-6.jpg|{{file:Figure D-6.jpg}}3 KB (425 words) - 17:33, 11 January 2017
- Figure M-1B.jpg|{{file:Figure M-1B.jpg}} Figure M-1D.jpg|{{file:Figure M-1D.jpg}}3 KB (473 words) - 15:25, 18 January 2017
- ...shown in figure 6, and the spatial relations are shown diagrammatically in figure 8.2 KB (299 words) - 20:56, 12 January 2017
- Figure P-3A.jpg|{{file:Figure P-3A.jpg}} Figure P-3B.jpg|{{file:Figure P-3B.jpg}}24 KB (3,468 words) - 22:19, 19 January 2017
- Figure P-3A.jpg|{{file:Figure P-3A.jpg}} Figure P-3B.jpg|{{file:Figure P-3B.jpg}}24 KB (3,468 words) - 16:01, 20 January 2017
- ...lt or overlying beds. Its spatial relations are shown diagrammatically in figure 8. The geographic distribution of the member is shown in figure 6.2 KB (318 words) - 22:21, 3 January 2017
- the idealized sequence shown in figure P-7 is rarely complete, the units that are present have the same relative p Figure P-3A.jpg|{{file:Figure P-3A.jpg}}24 KB (3,539 words) - 16:05, 20 January 2017
- ...along a paleochannel that was partly contemporaneous with peat formation (Figure 44). Friedman (1960)<ref>Friedman, S.A., 1960, Channel-fill sandstones in t ...style="display: inline-block;">[[File:C605-Figure-44.jpg|500px|{{File:C605-Figure-44.jpg}}|thumb]]</li>5 KB (707 words) - 20:13, 23 August 2023
- Figure K-1A.jpg|{{file:Figure K-1A.jpg}} Figure K-1B.jpg|{{file:Figure K-1B.jpg}}9 KB (1,278 words) - 18:06, 21 November 2016
- Figure P-2.jpg|{{file:Figure P-2.jpg}}3 KB (399 words) - 18:34, 27 January 2017
- Figure 14.jpg|{{file:Figure 14.jpg}} Figure P-3D.jpg|{{file:Figure P-3D.jpg}}4 KB (561 words) - 22:48, 19 January 2017
- Figure D-3A.jpg|{{file:Figure D-3A.jpg}}6 KB (817 words) - 19:34, 22 October 2019
- Figure P-13.jpg|{{file:Figure P-13.jpg}}4 KB (474 words) - 16:56, 25 January 2017
- Figure P-2.jpg|{{file:Figure P-2.jpg}}3 KB (460 words) - 21:16, 27 January 2017
- ...the Winnebago to adjacent stratigraphic units is shown diagrammatically in figure 8. ...ic distribution of the formation at the surface is indicated on the map in figure 6.5 KB (697 words) - 20:55, 12 January 2017
- Figure K-1A.jpg|{{file:Figure K-1A.jpg}} Figure K-1B.jpg|{{file:Figure K-1B.jpg}}9 KB (1,353 words) - 16:29, 11 January 2017
- Figure M-1B.jpg|{{file:Figure M-1B.jpg}} Figure M-1D.jpg|{{file:Figure M-1D.jpg}}4 KB (560 words) - 15:25, 22 October 2019