Uploads by Alan.Myers
Jump to navigation
Jump to search
This special page shows all uploaded files.
| Date | Name | Thumbnail | Size | Description | Versions |
|---|---|---|---|---|---|
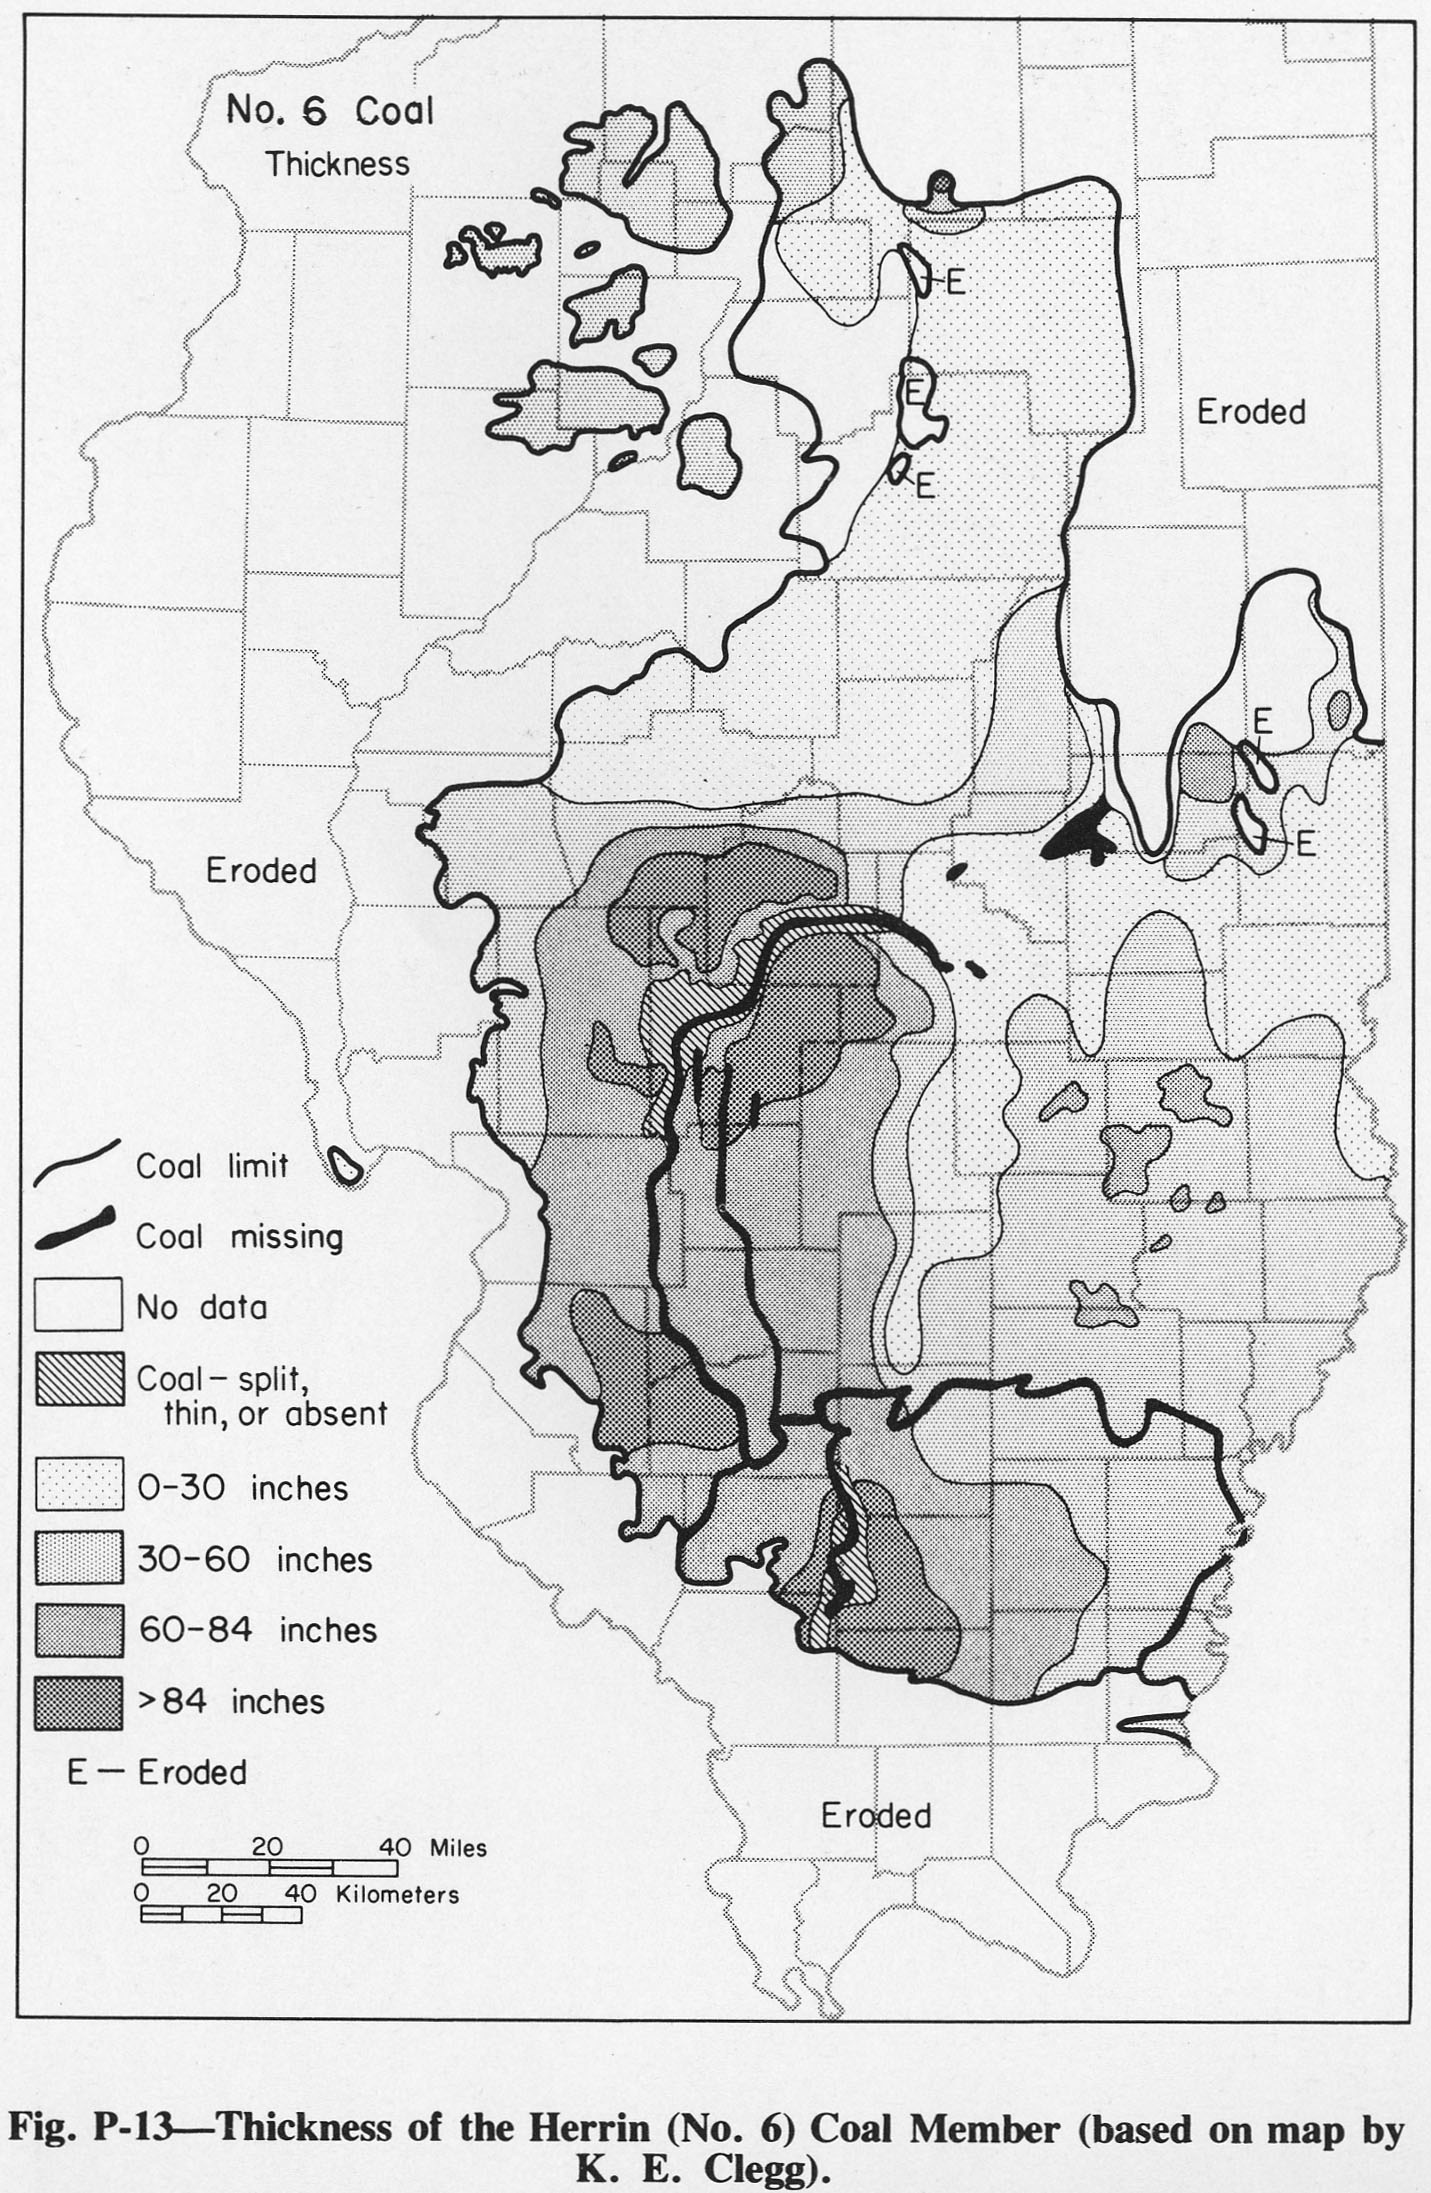
| 13:34, 5 August 2015 | Figure P-13.jpg (file) |  |
614 KB | Fig. P-13 -- Thickness of the Herrin (No. 6) Coal Member (based on map by K.R. Clegg) | 1 |
| 14:41, 5 August 2015 | Figure P-12.jpg (file) |  |
640 KB | Fig. P-12 -- Thickness of the Harrisburg (No.5) and Springfield (No. 5) Coal Members (based on may by K.E. Glegg). | 1 |
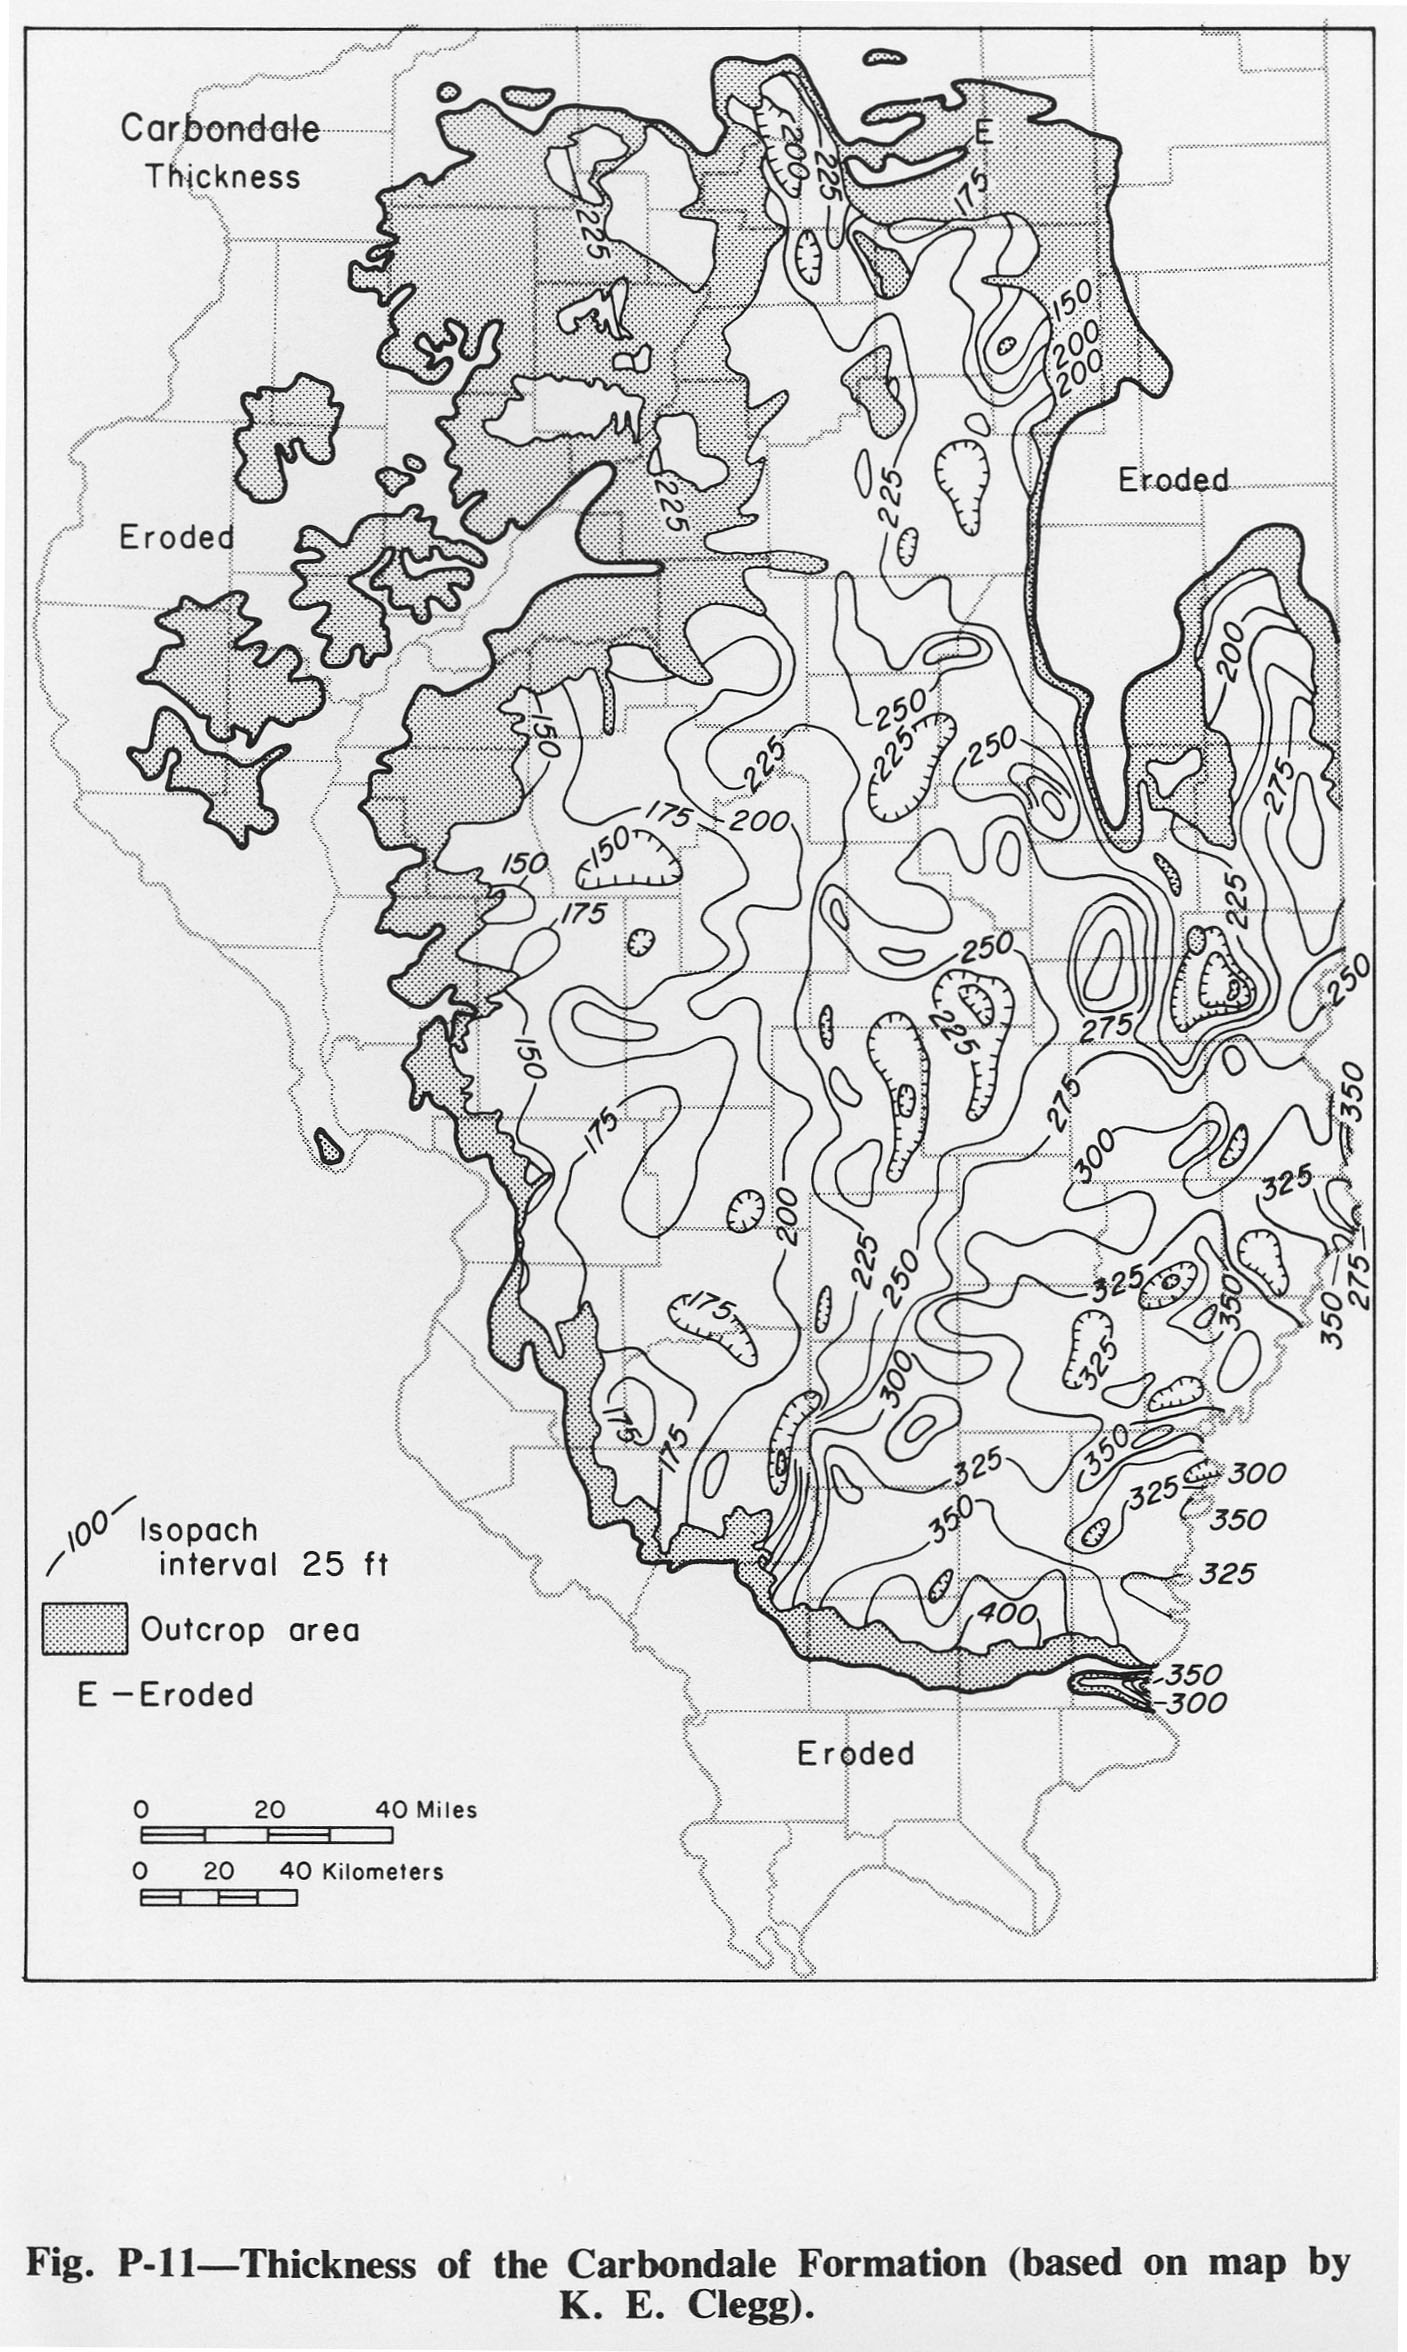
| 14:42, 5 August 2015 | Figure P-11.jpg (file) |  |
554 KB | Fig. P-11 -- Thickness of the Carbondale Formation (based on map by K.E. Clegg). | 1 |
| 14:43, 5 August 2015 | Figure P-5.jpg (file) |  |
684 KB | Fig. P-5 -- Development of Classification of the Pennsylvanian System) | 1 |
| 20:09, 5 August 2015 | ISGS logo.jpg (file) | 178 KB | 1 | ||
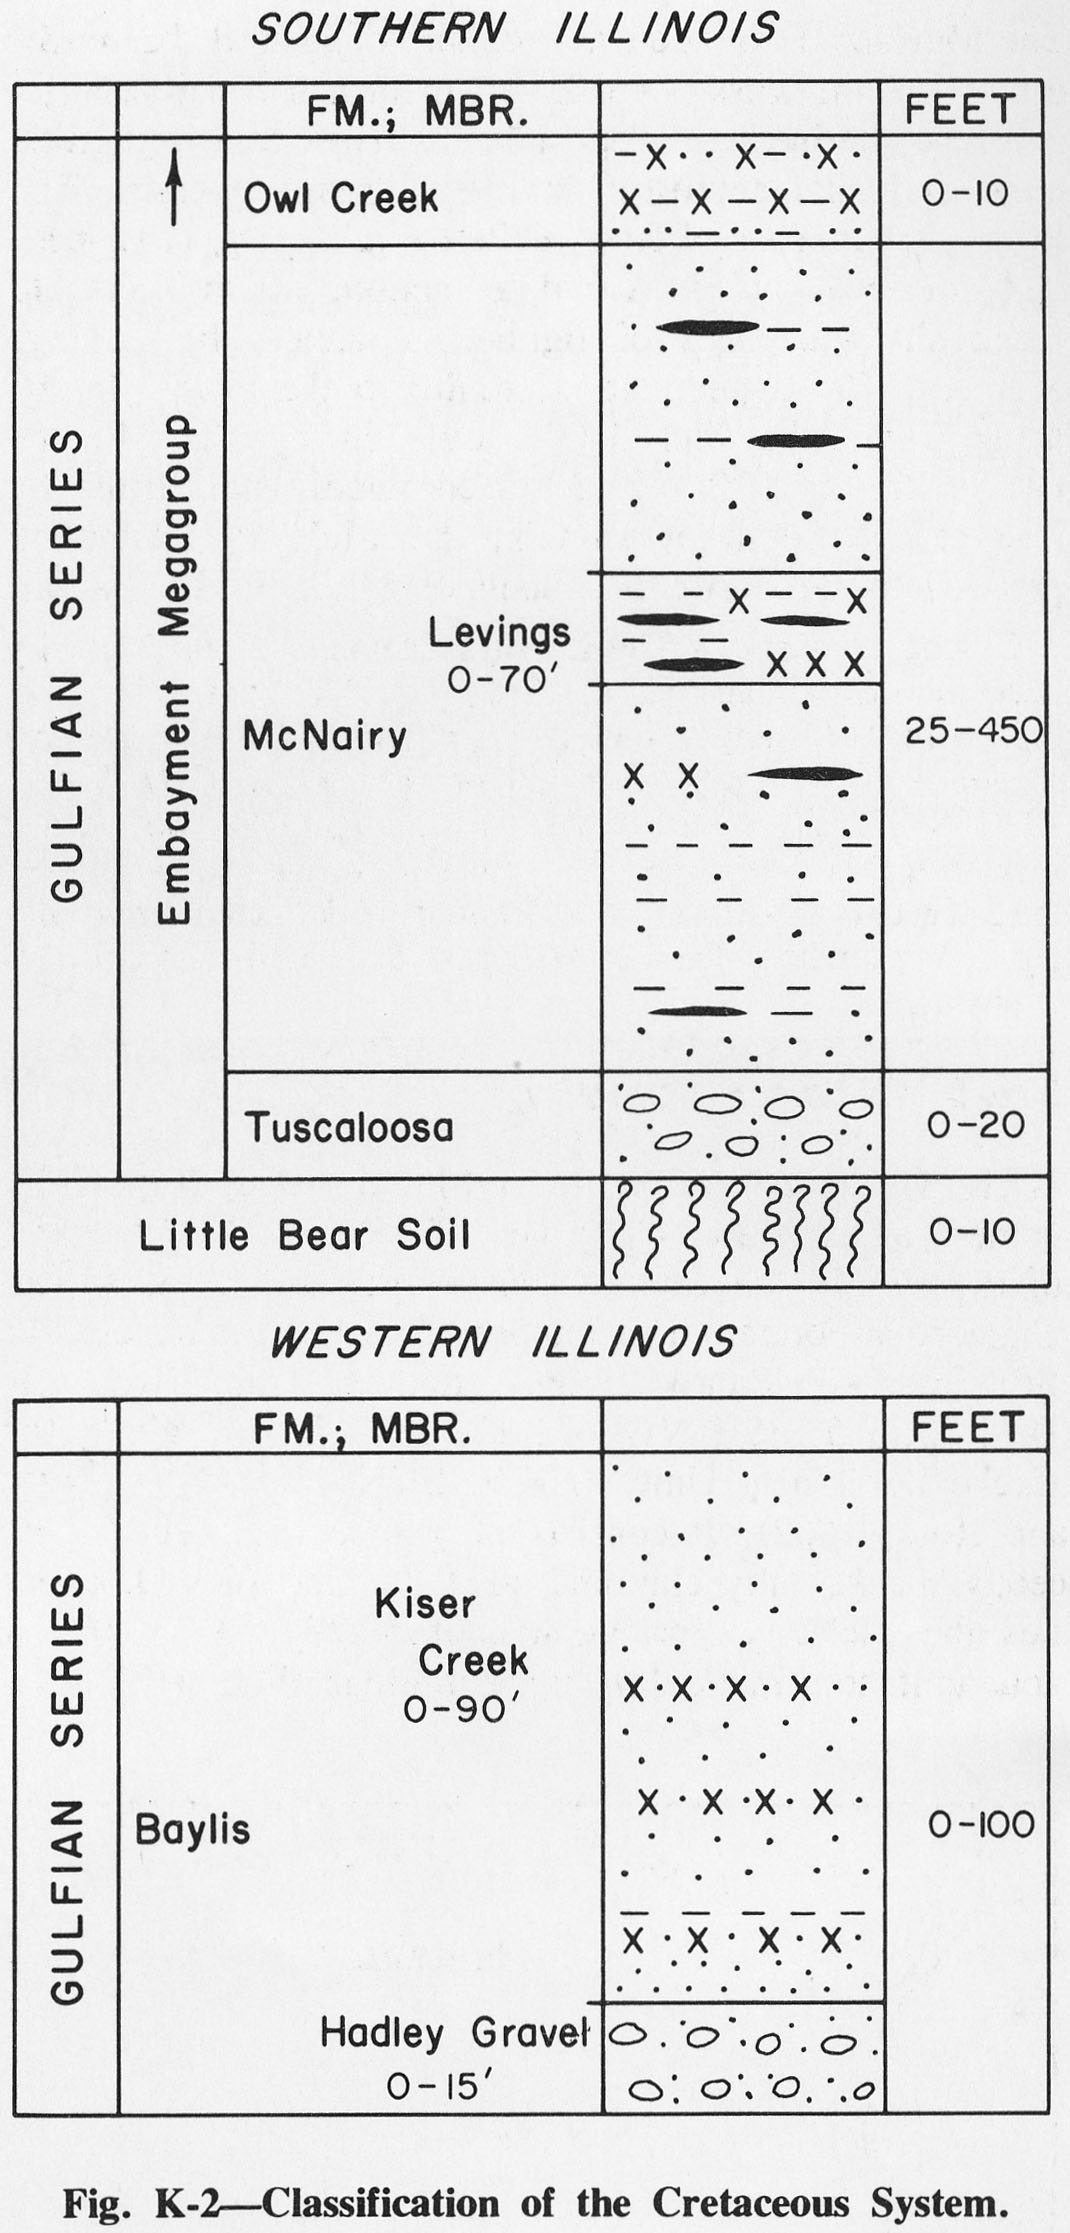
| 15:02, 6 August 2015 | Figure K-2.jpg (file) |  |
275 KB | Fig. K-2 -- Classification of the Cretaceous System | 1 |
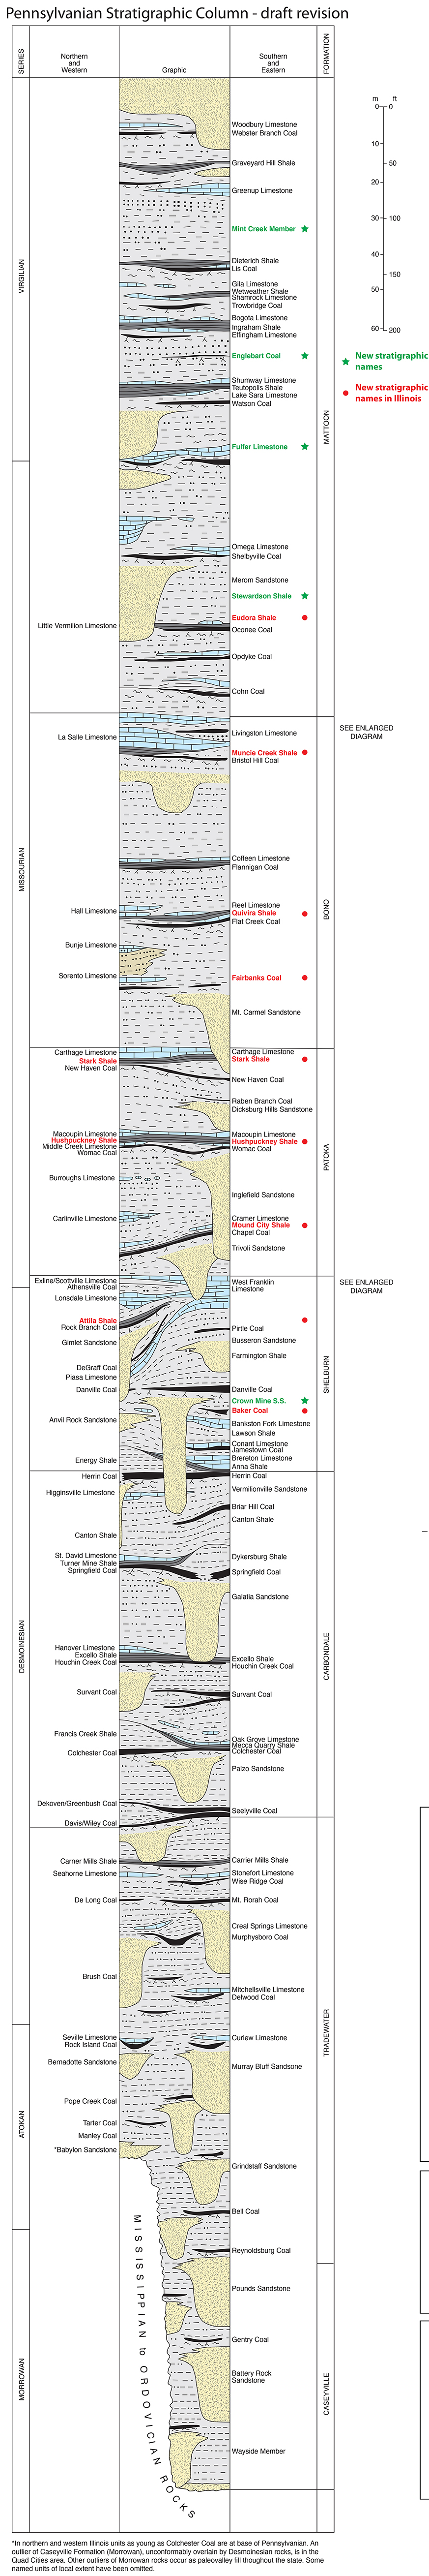
| 16:12, 10 August 2015 | Pennsylvanian column.jpg (file) |  |
1.13 MB | Pennsylvanian Column test | 1 |
| 16:57, 10 August 2015 | Pennsylvanian column update.jpg (file) |  |
1.91 MB | 1 | |
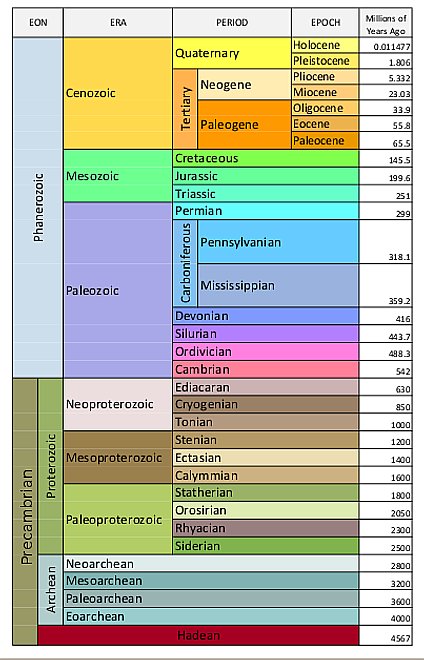
| 17:54, 10 August 2015 | Geologic-time-scale1.jpg (file) |  |
67 KB | 1 | |
| 19:38, 13 August 2015 | B95.jpg (file) |  |
20 KB | 1 | |
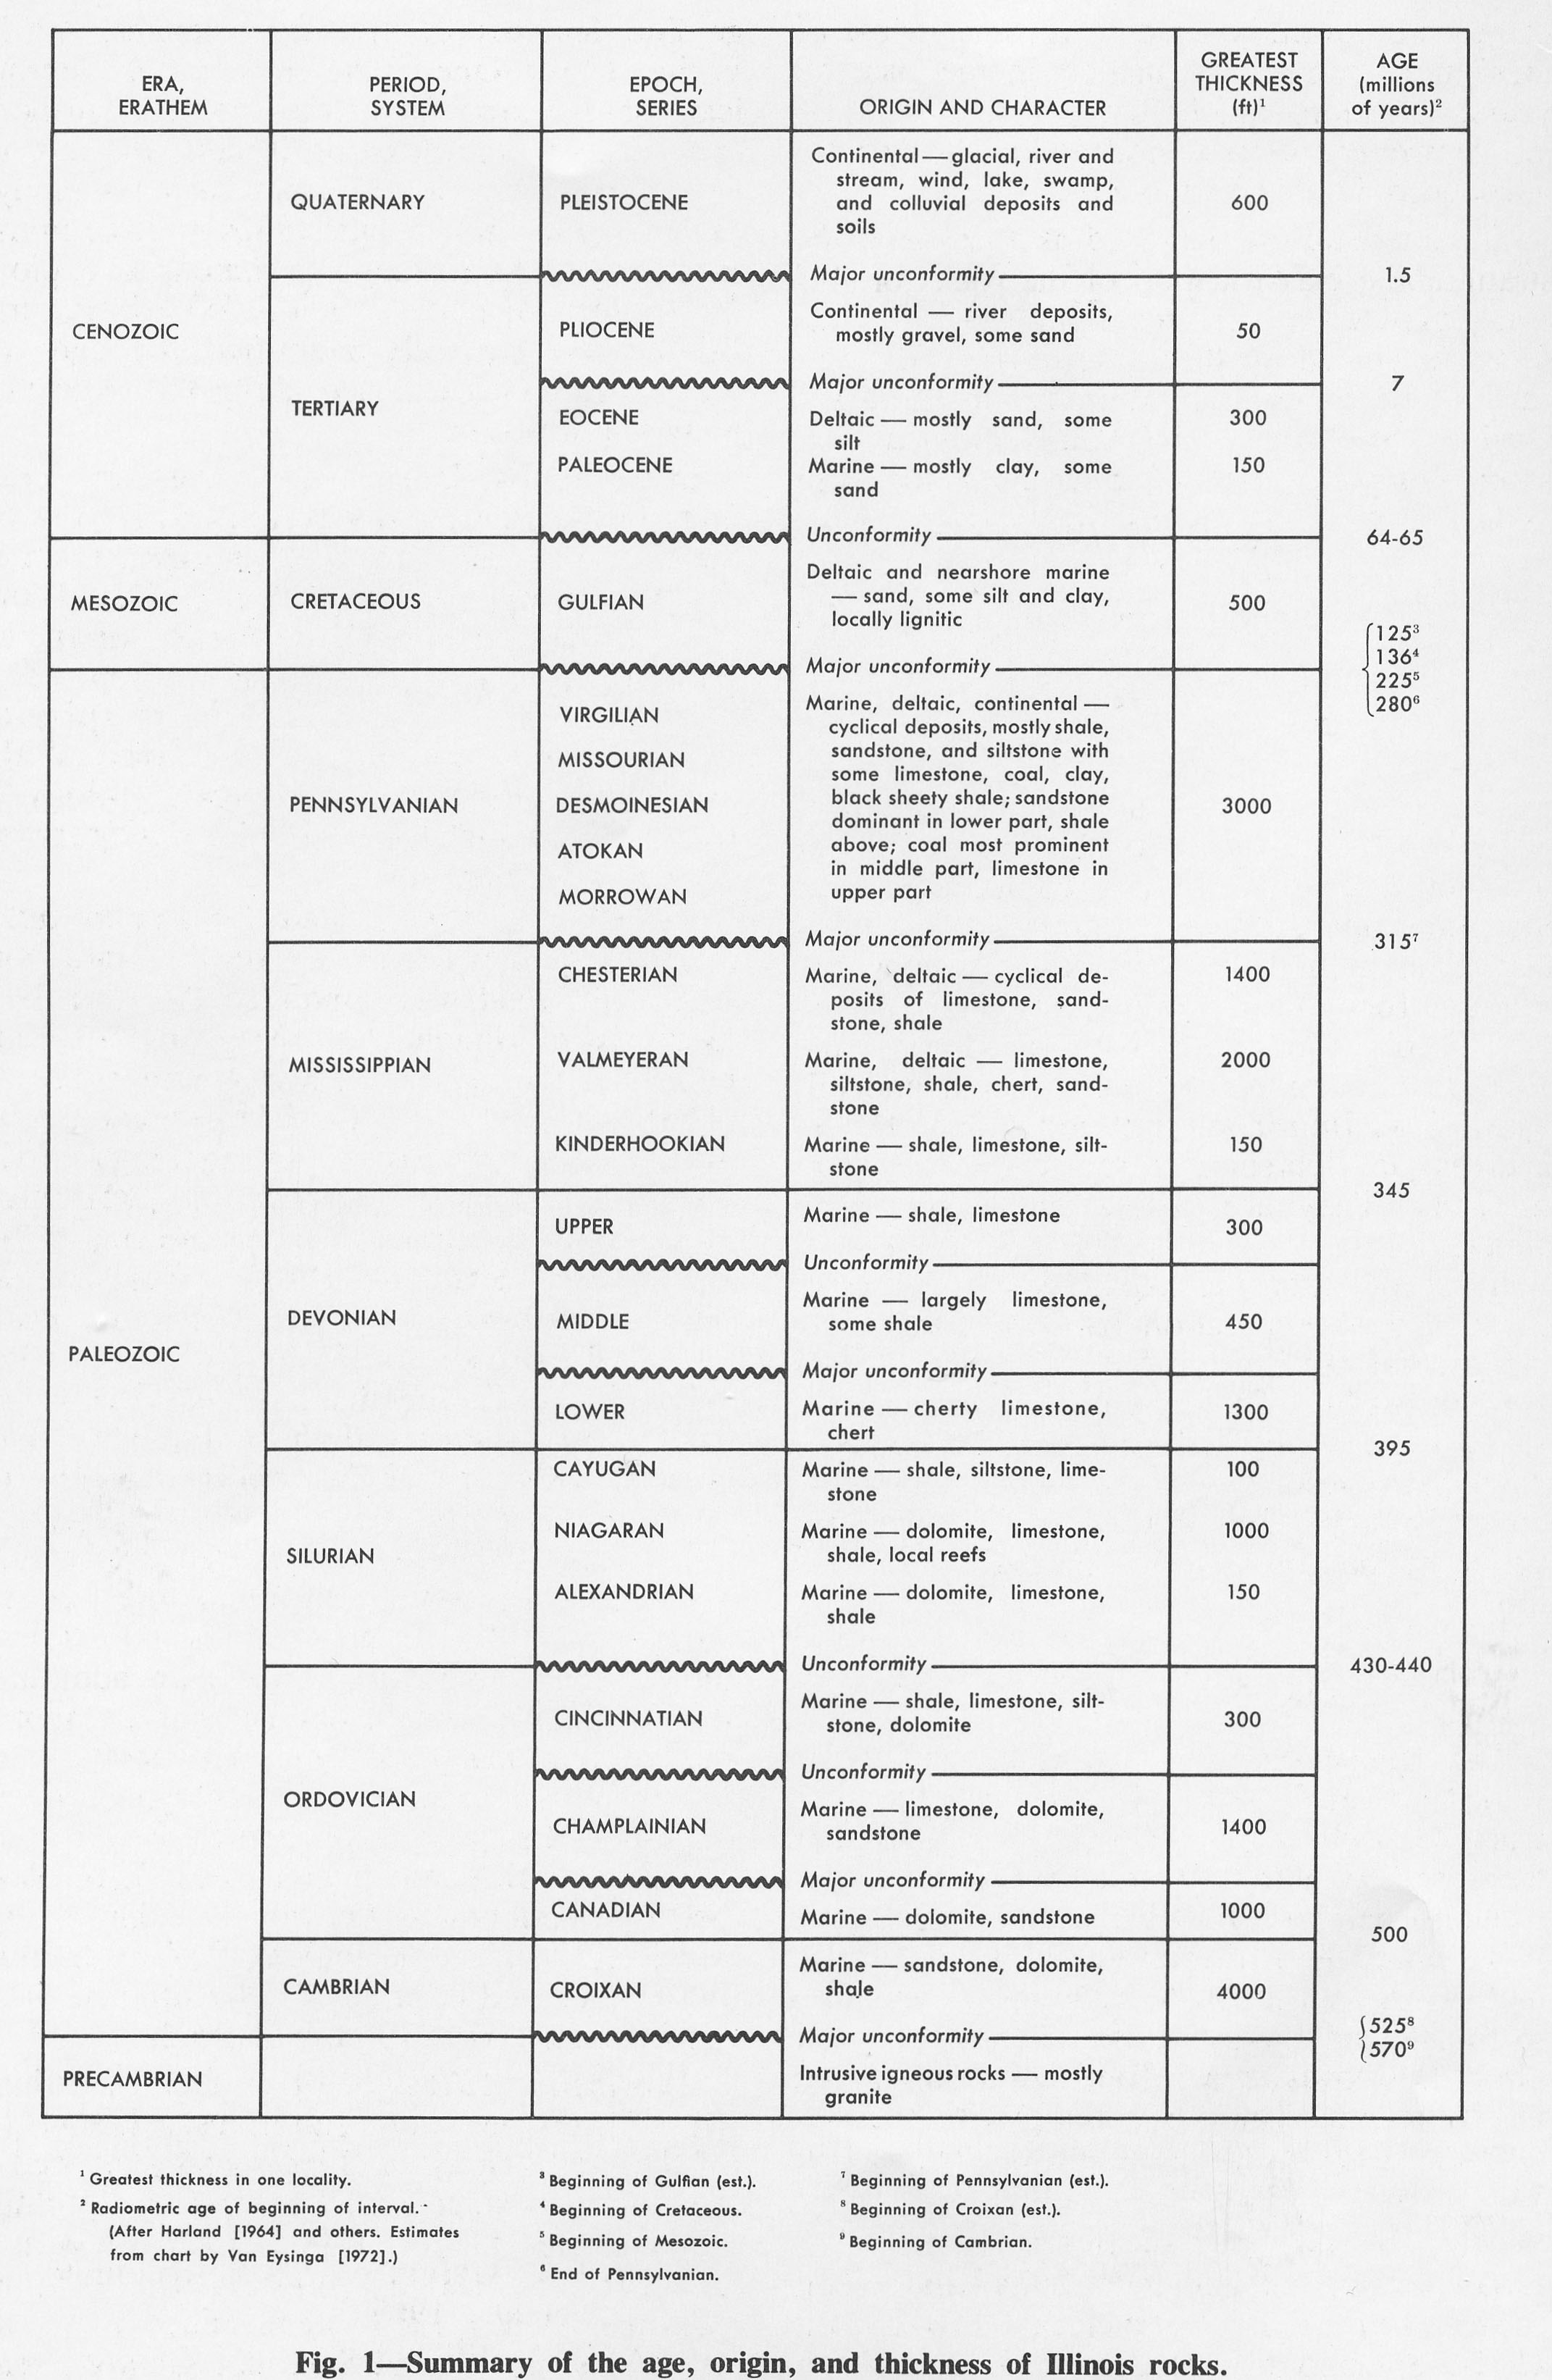
| 16:24, 31 March 2016 | Figure 1.jpg (file) |  |
661 KB | Fig. 1 -- Summary of the age, origin, and thickness of Illinois rocks. | 1 |
| 16:31, 31 March 2016 | Figure O-2A.jpg (file) |  |
444 KB | Fig. O-2 A -- St. Peter Sandstone in Starved Rock along the Illinois River in Starved Rock State Park, 4 miles south-east of La Salle, La Salle County. | 1 |
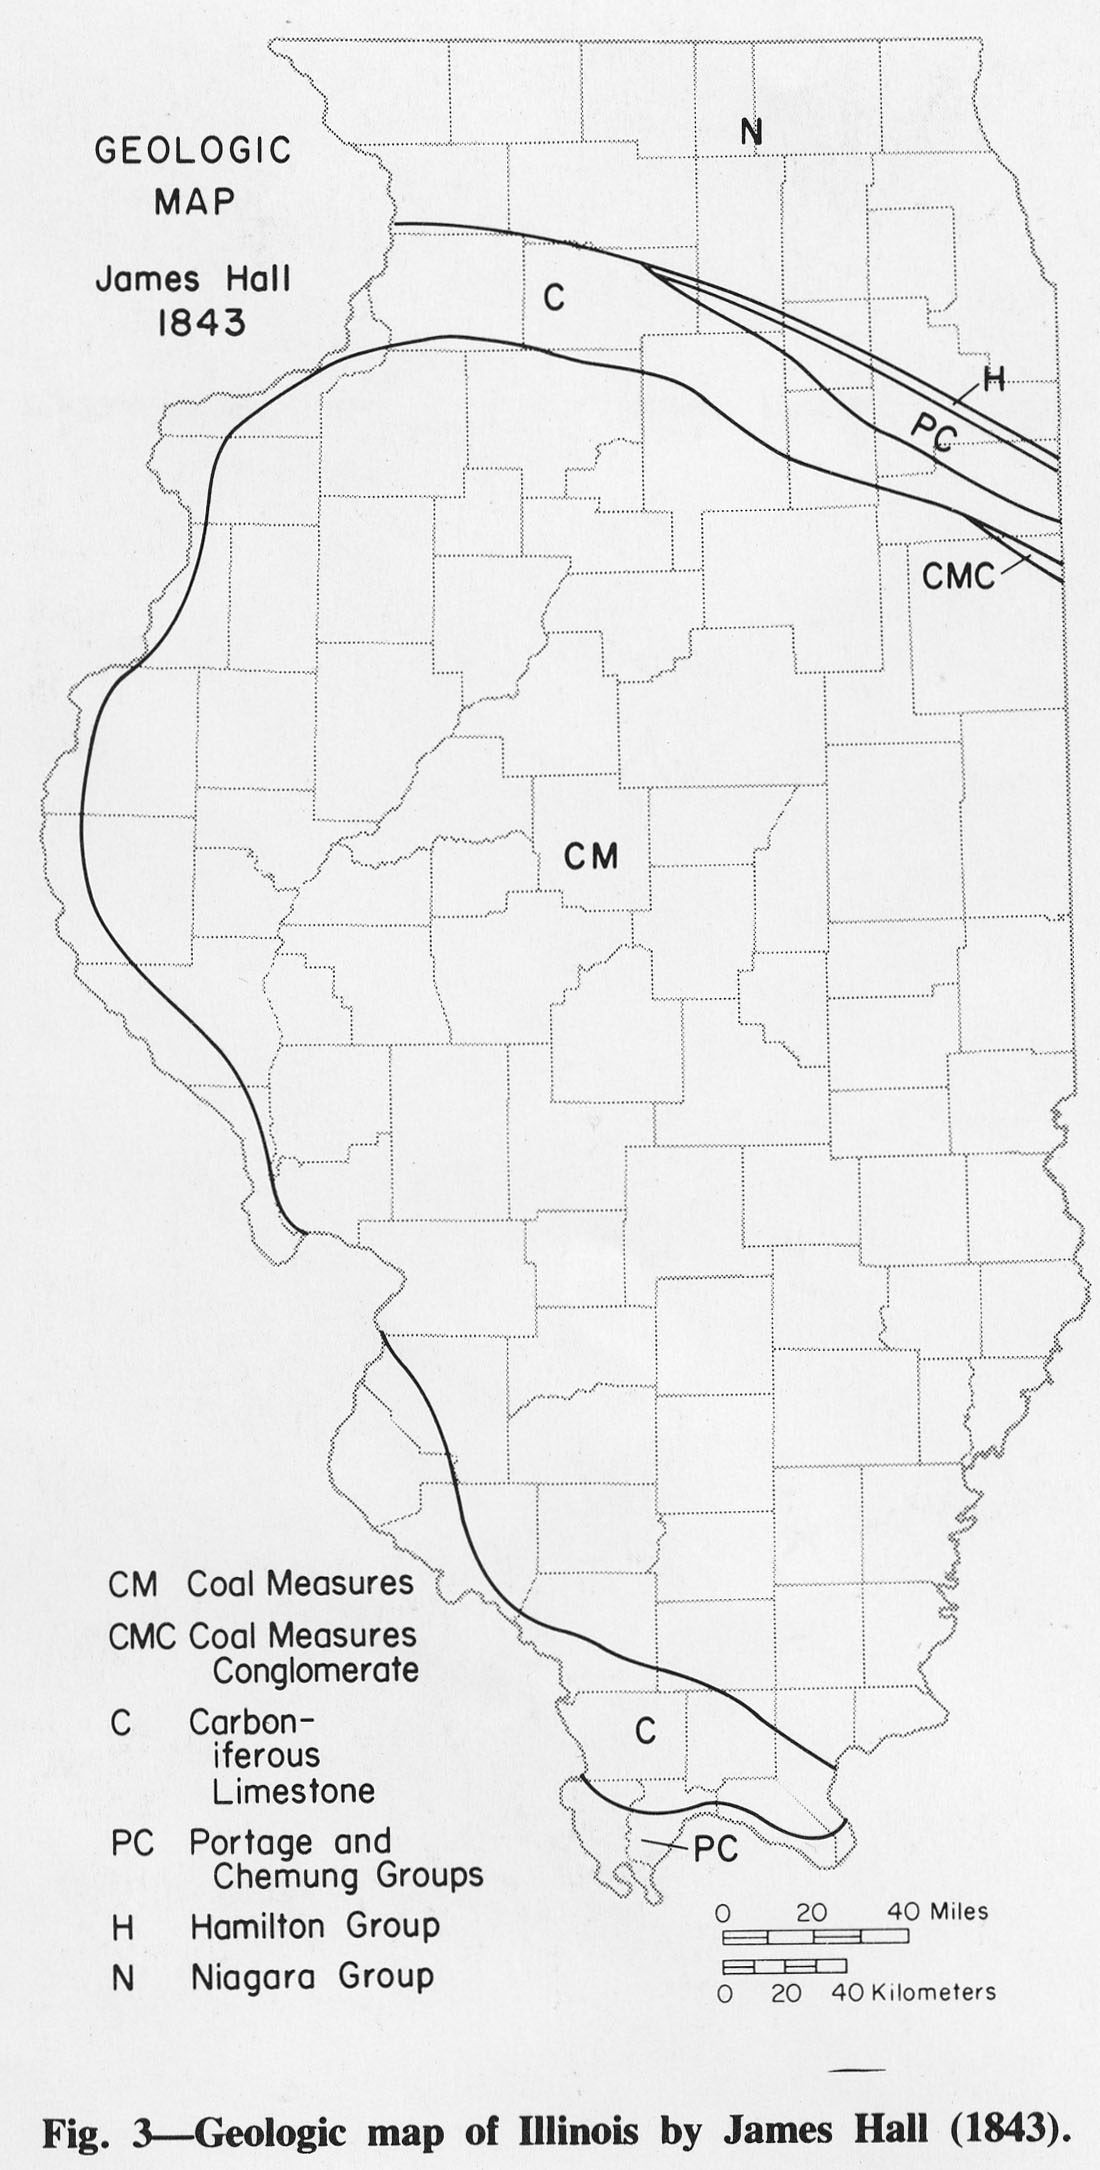
| 15:46, 1 April 2016 | Figure 3.jpg (file) |  |
273 KB | Fig. 3 -- Geologic map of Illinois by James Hall (1843). | 1 |
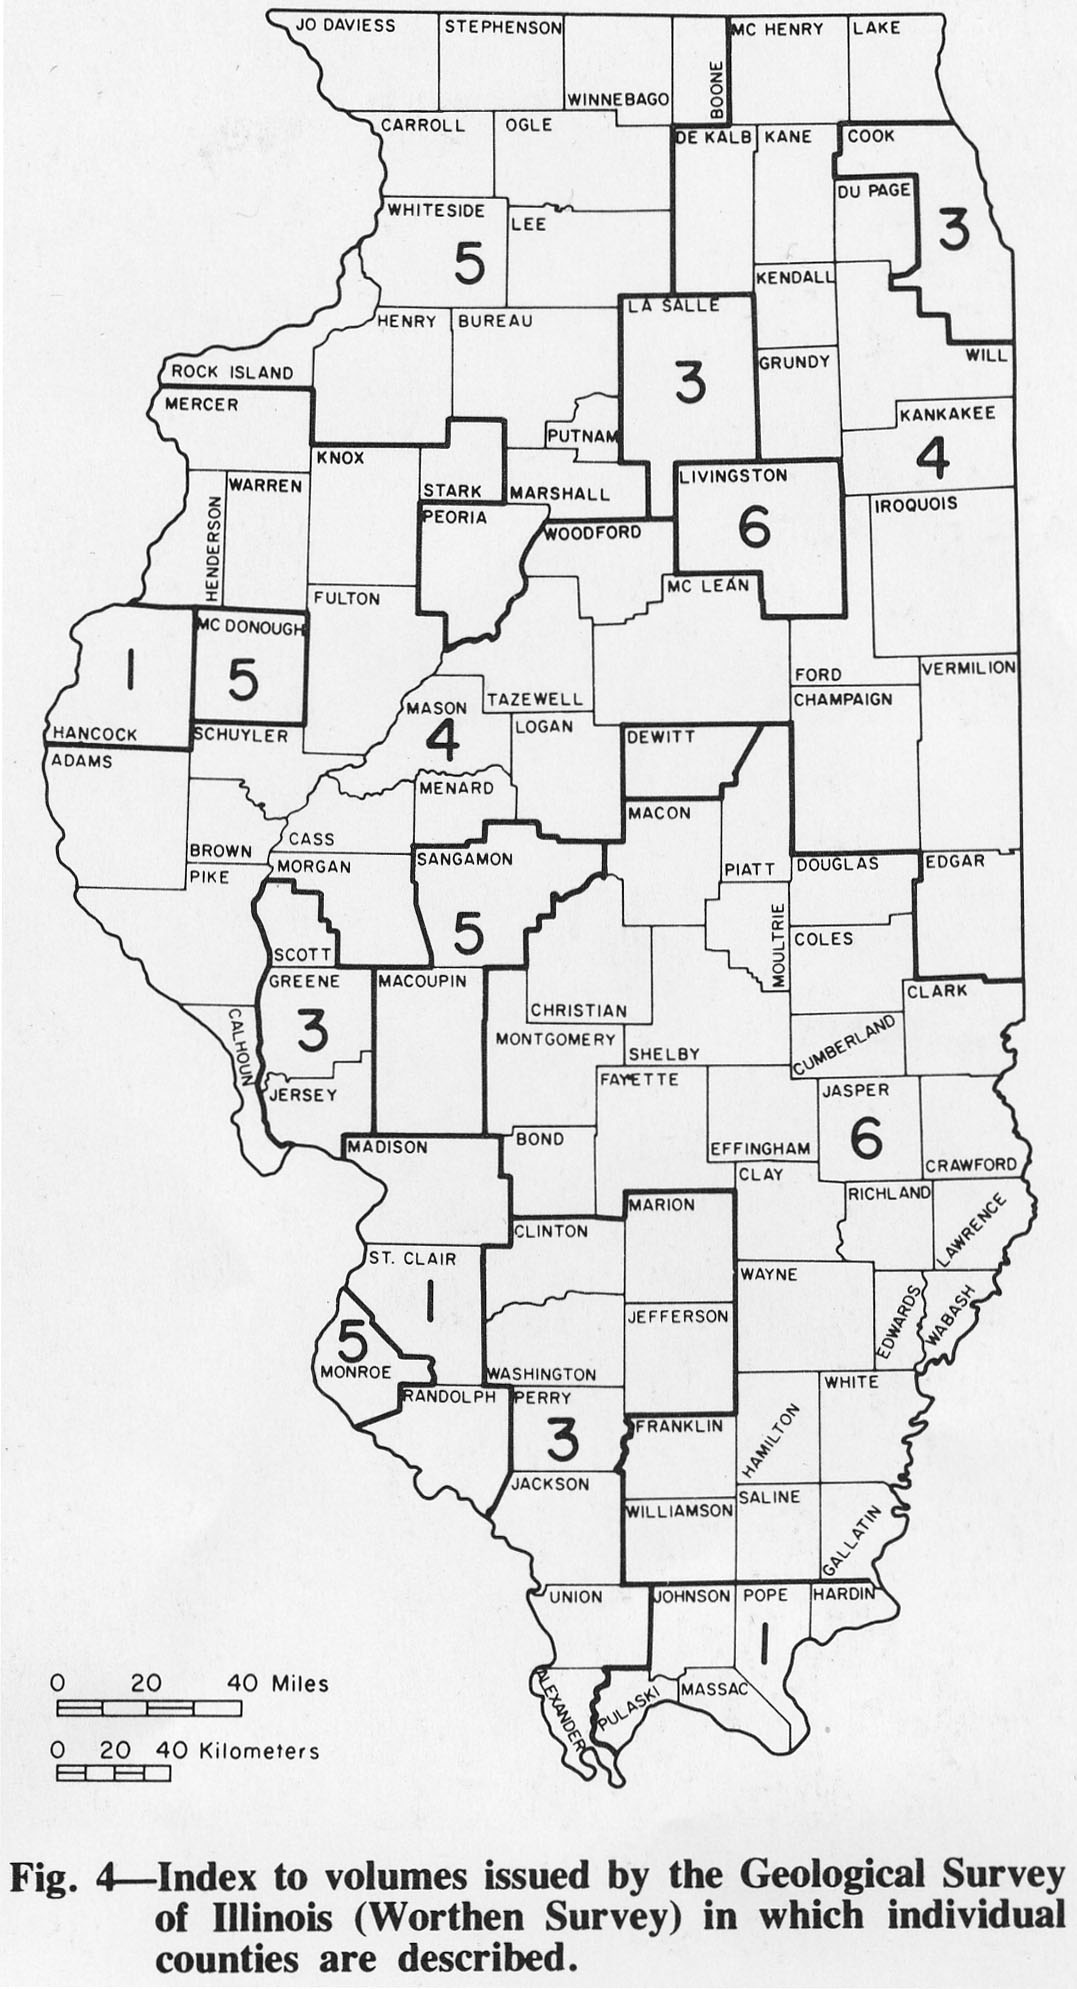
| 15:49, 1 April 2016 | Figure 4.jpg (file) |  |
274 KB | Fig. 4 -- Index to volumes issued by the Geological Survey of Illinois (Worthen Survey) in which individual counties are described. | 1 |
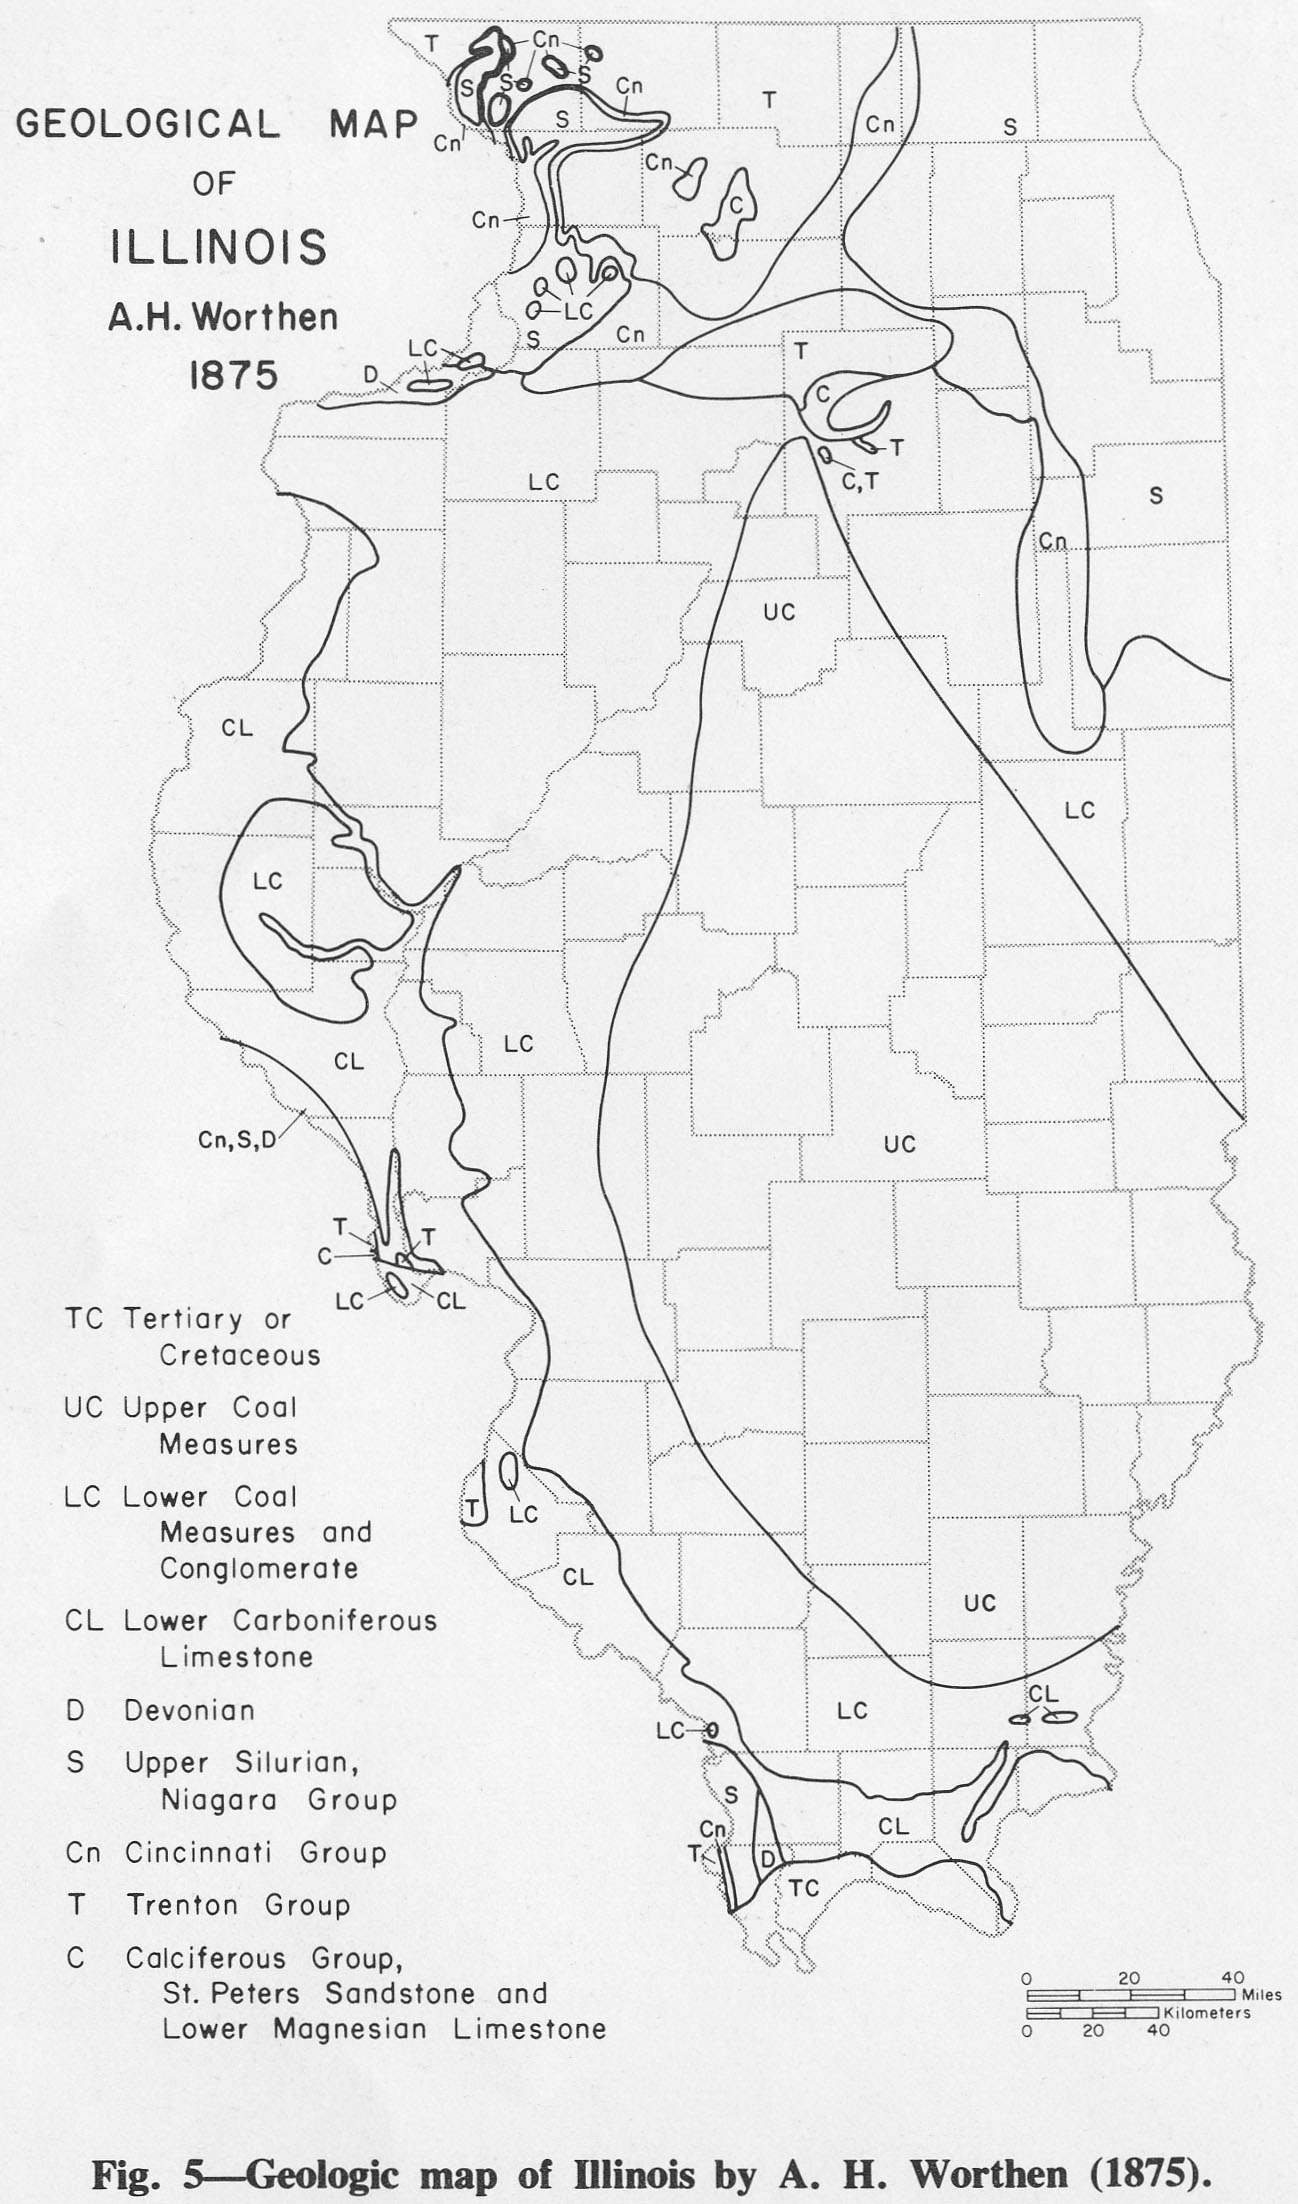
| 15:50, 1 April 2016 | Figure 5.jpg (file) |  |
350 KB | Fig. 5 -- Geologic map of Illinois by A. H. Worthen (1875). | 1 |
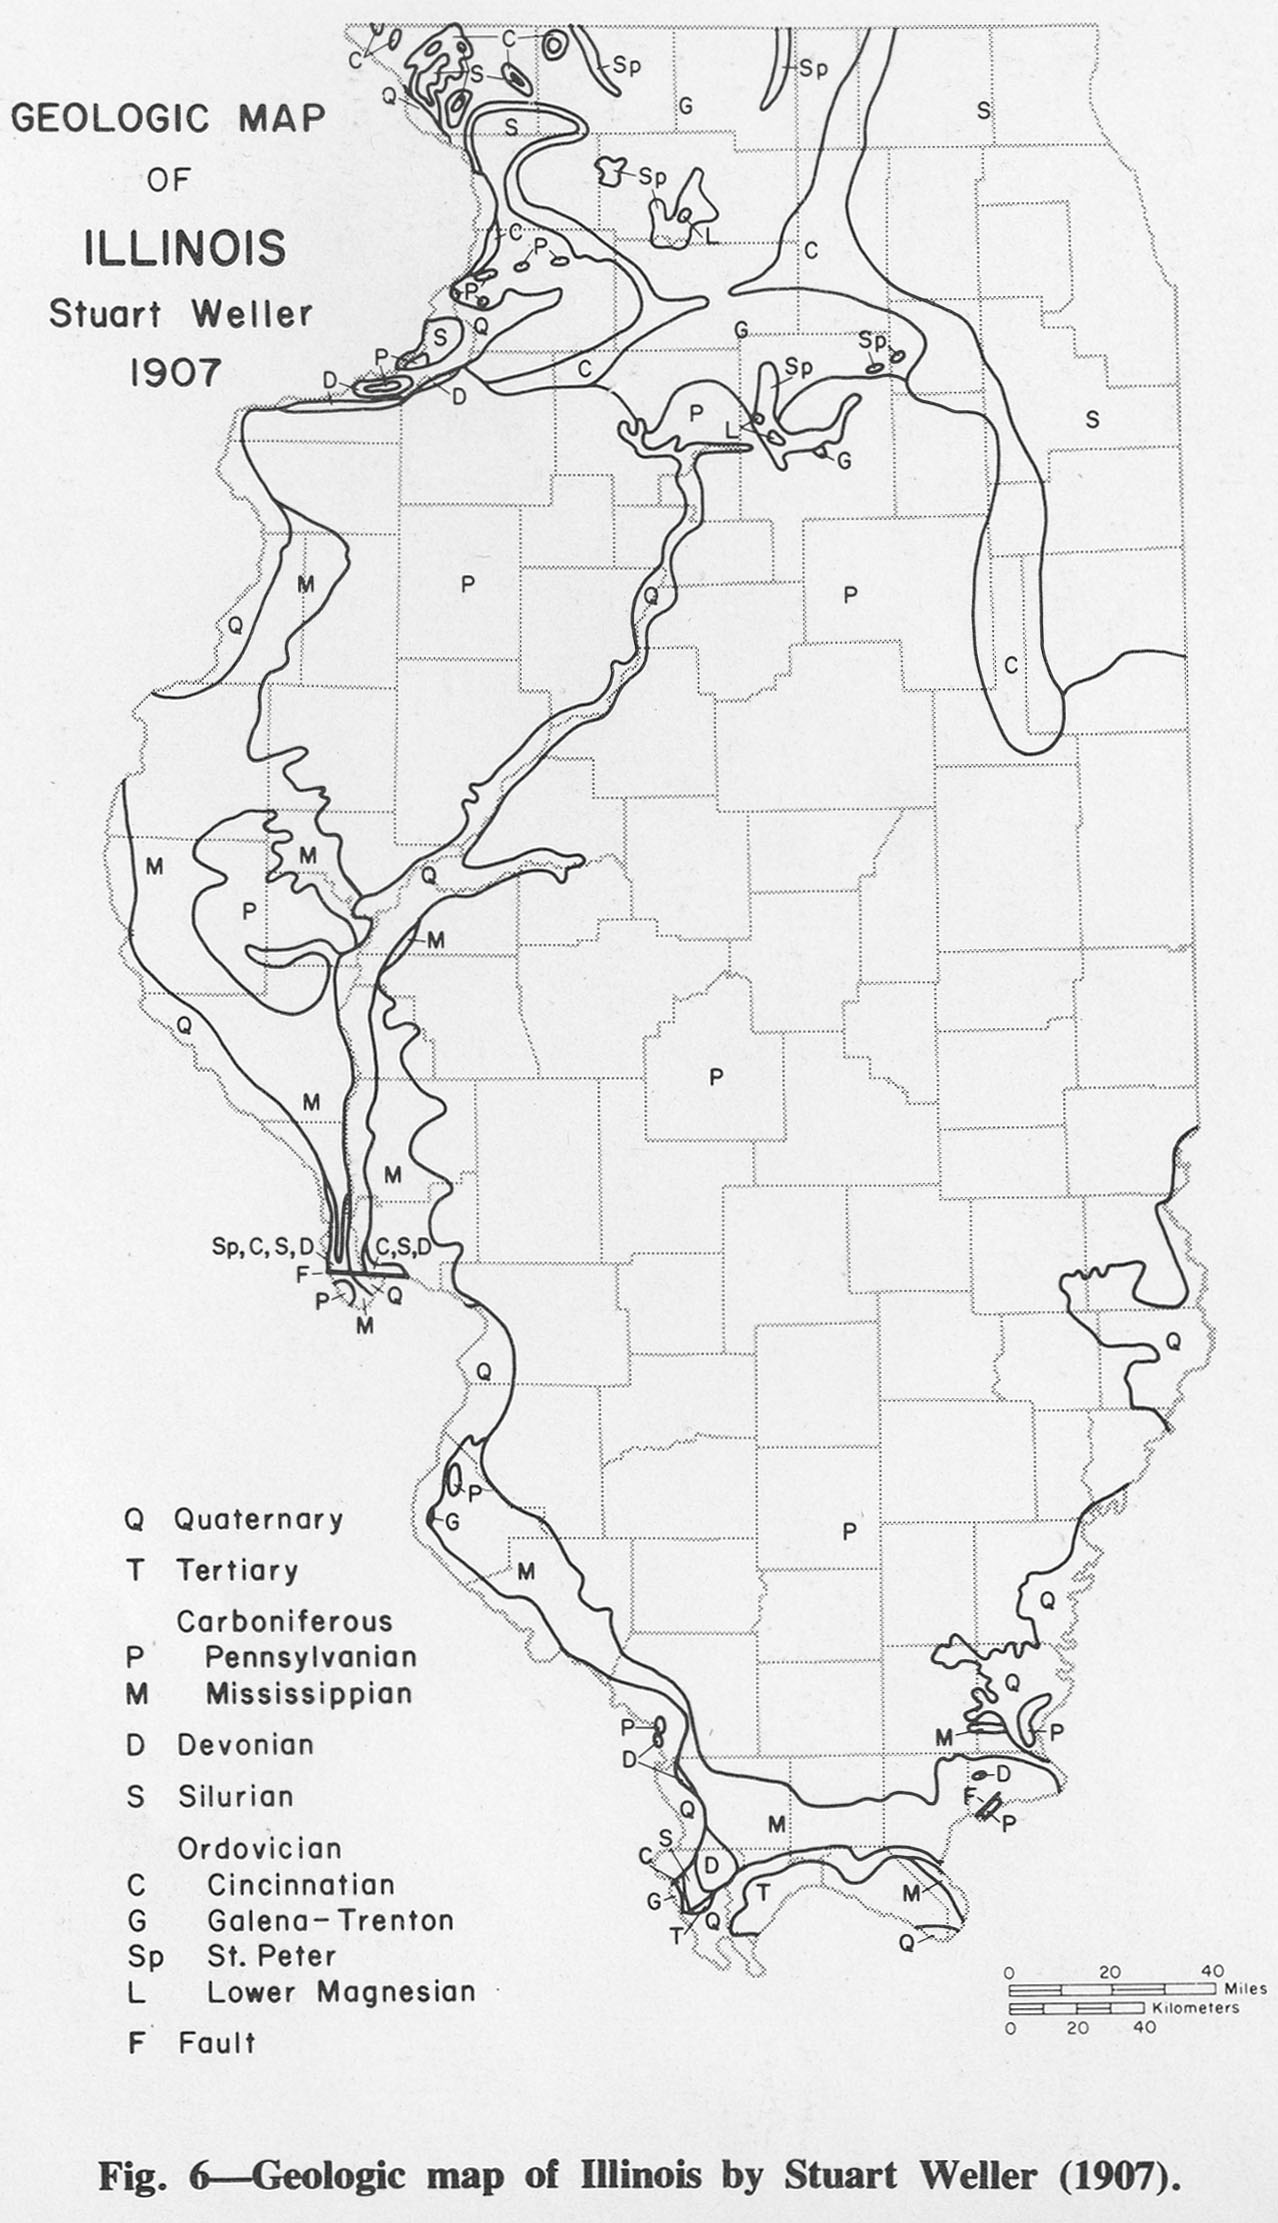
| 15:51, 1 April 2016 | Figure 6.jpg (file) |  |
344 KB | Fig. 6 -- Geologic map of Illinois by Stuart Weller (1907). | 1 |
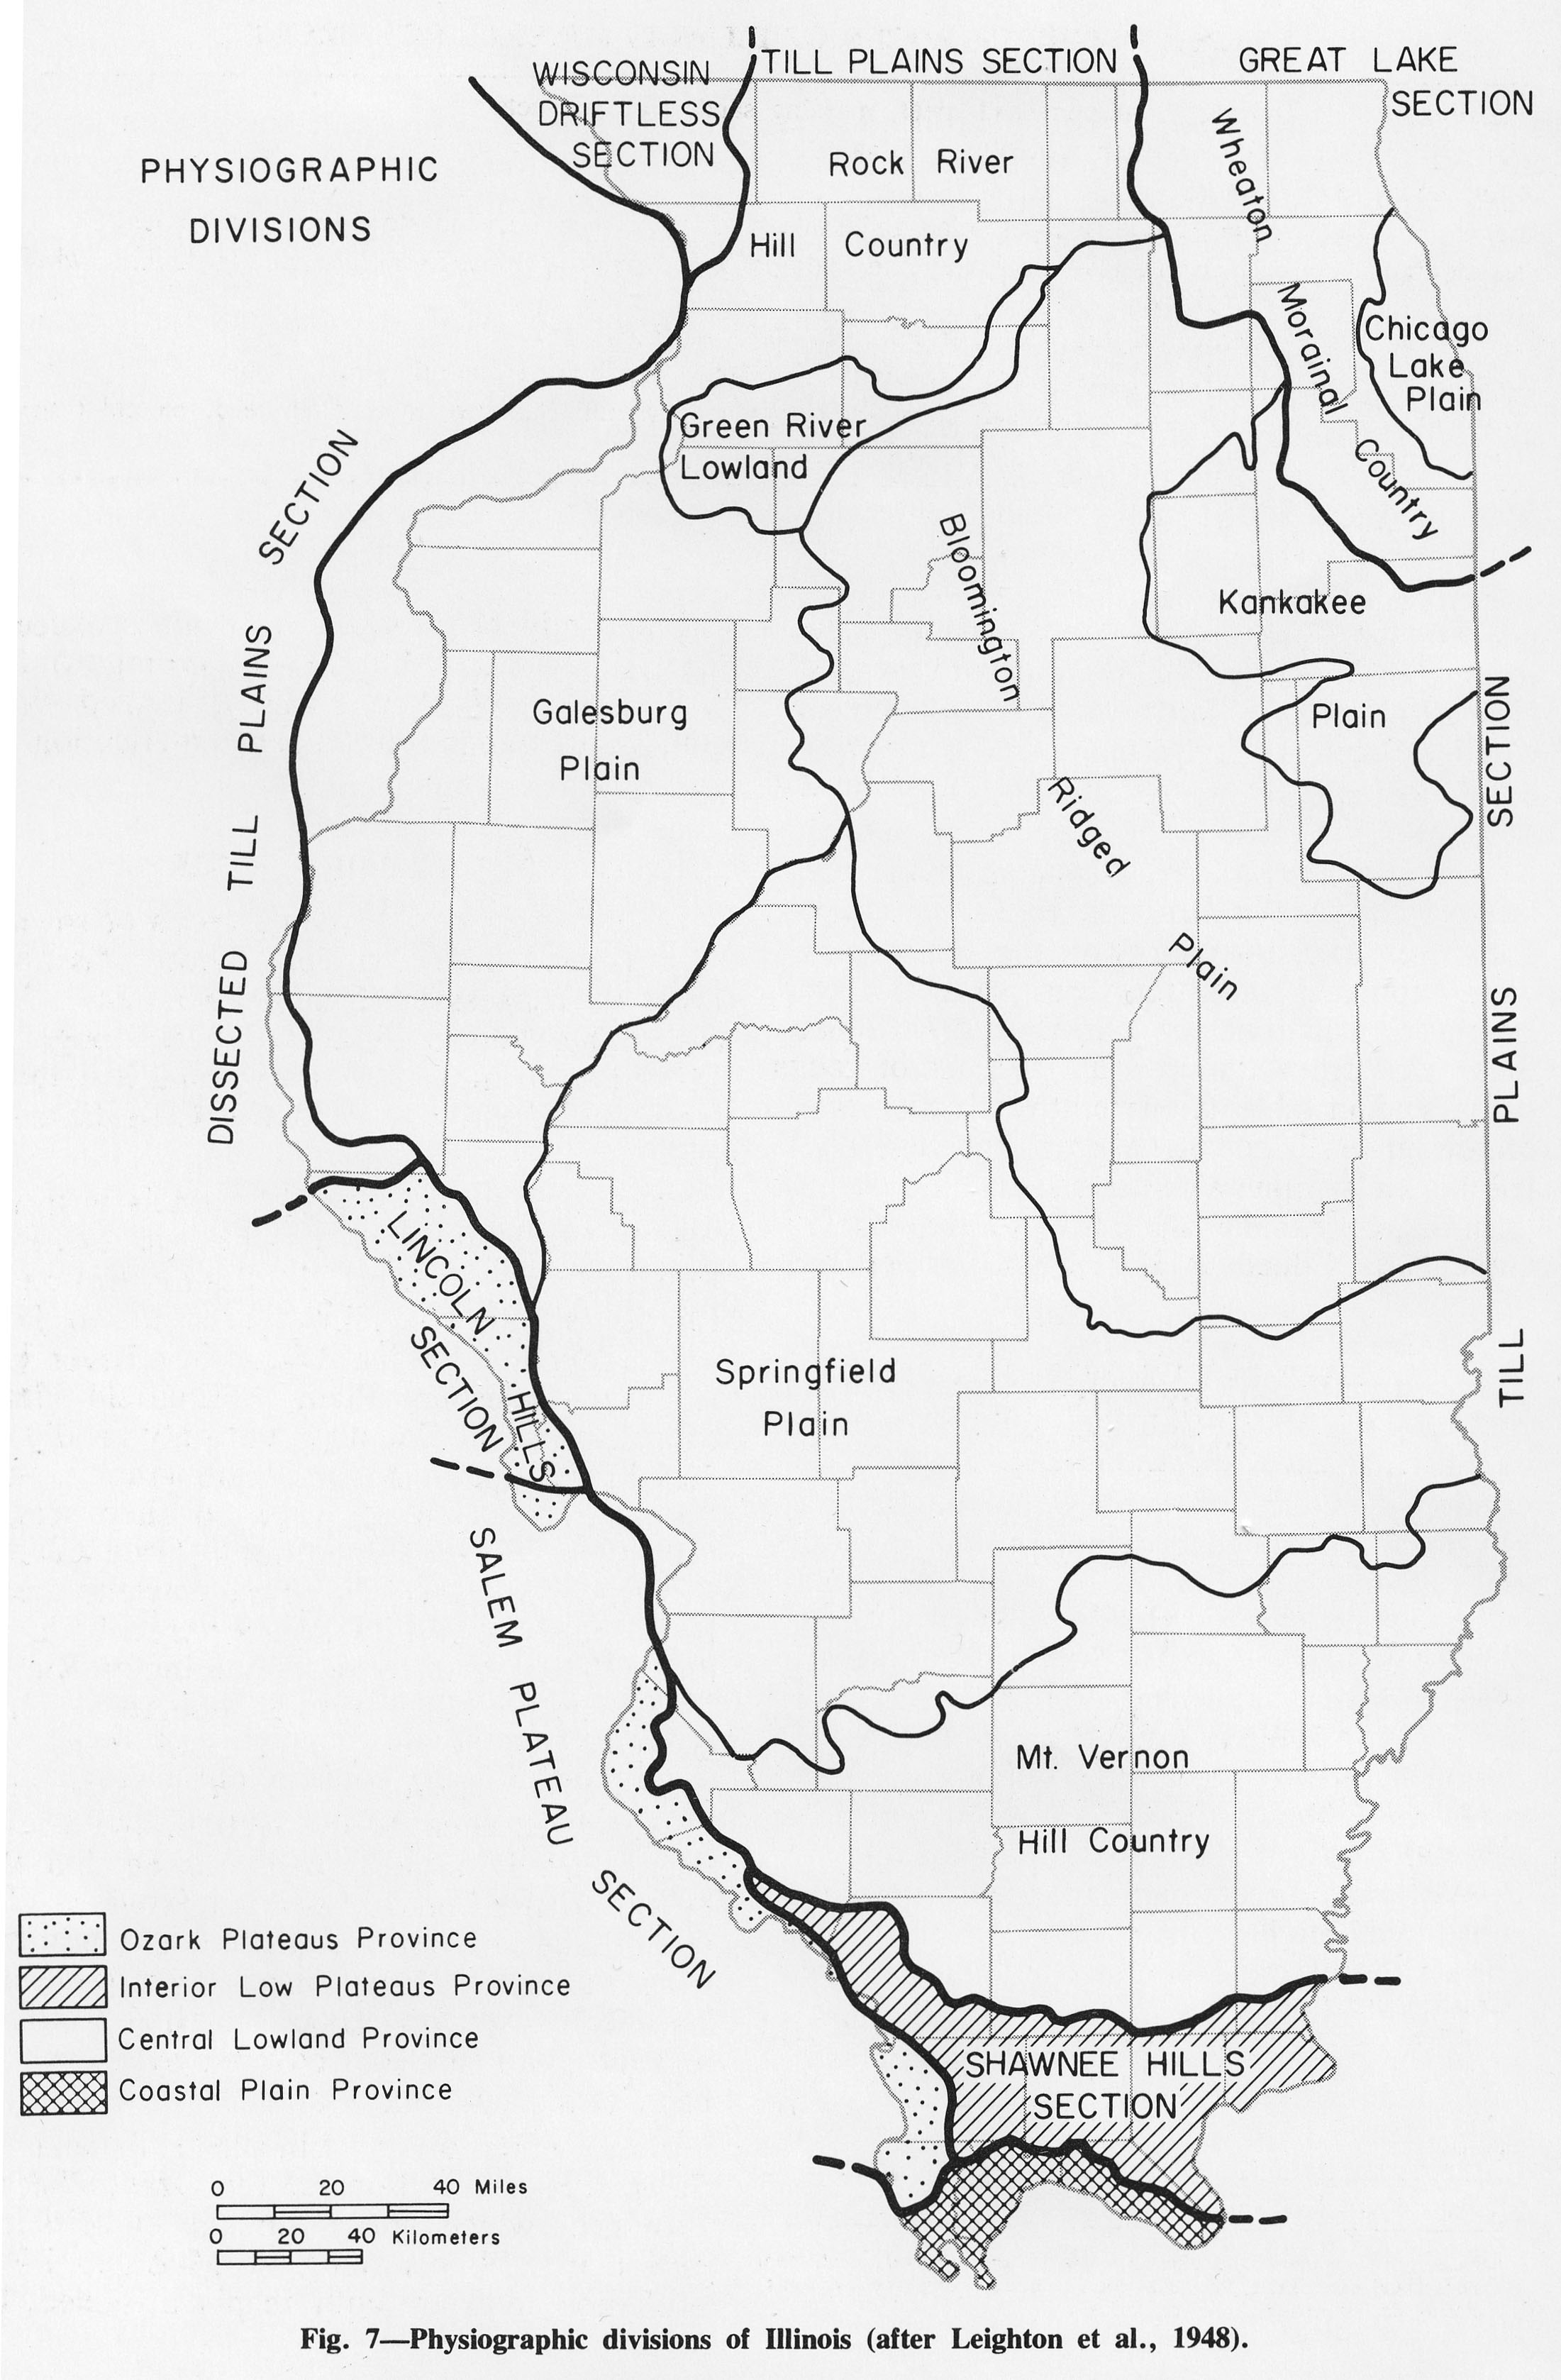
| 15:52, 1 April 2016 | Figure 7.jpg (file) |  |
762 KB | Fig. 7 -- Physiographic divisions of Illinois (after Leighton et al., 1948). | 1 |
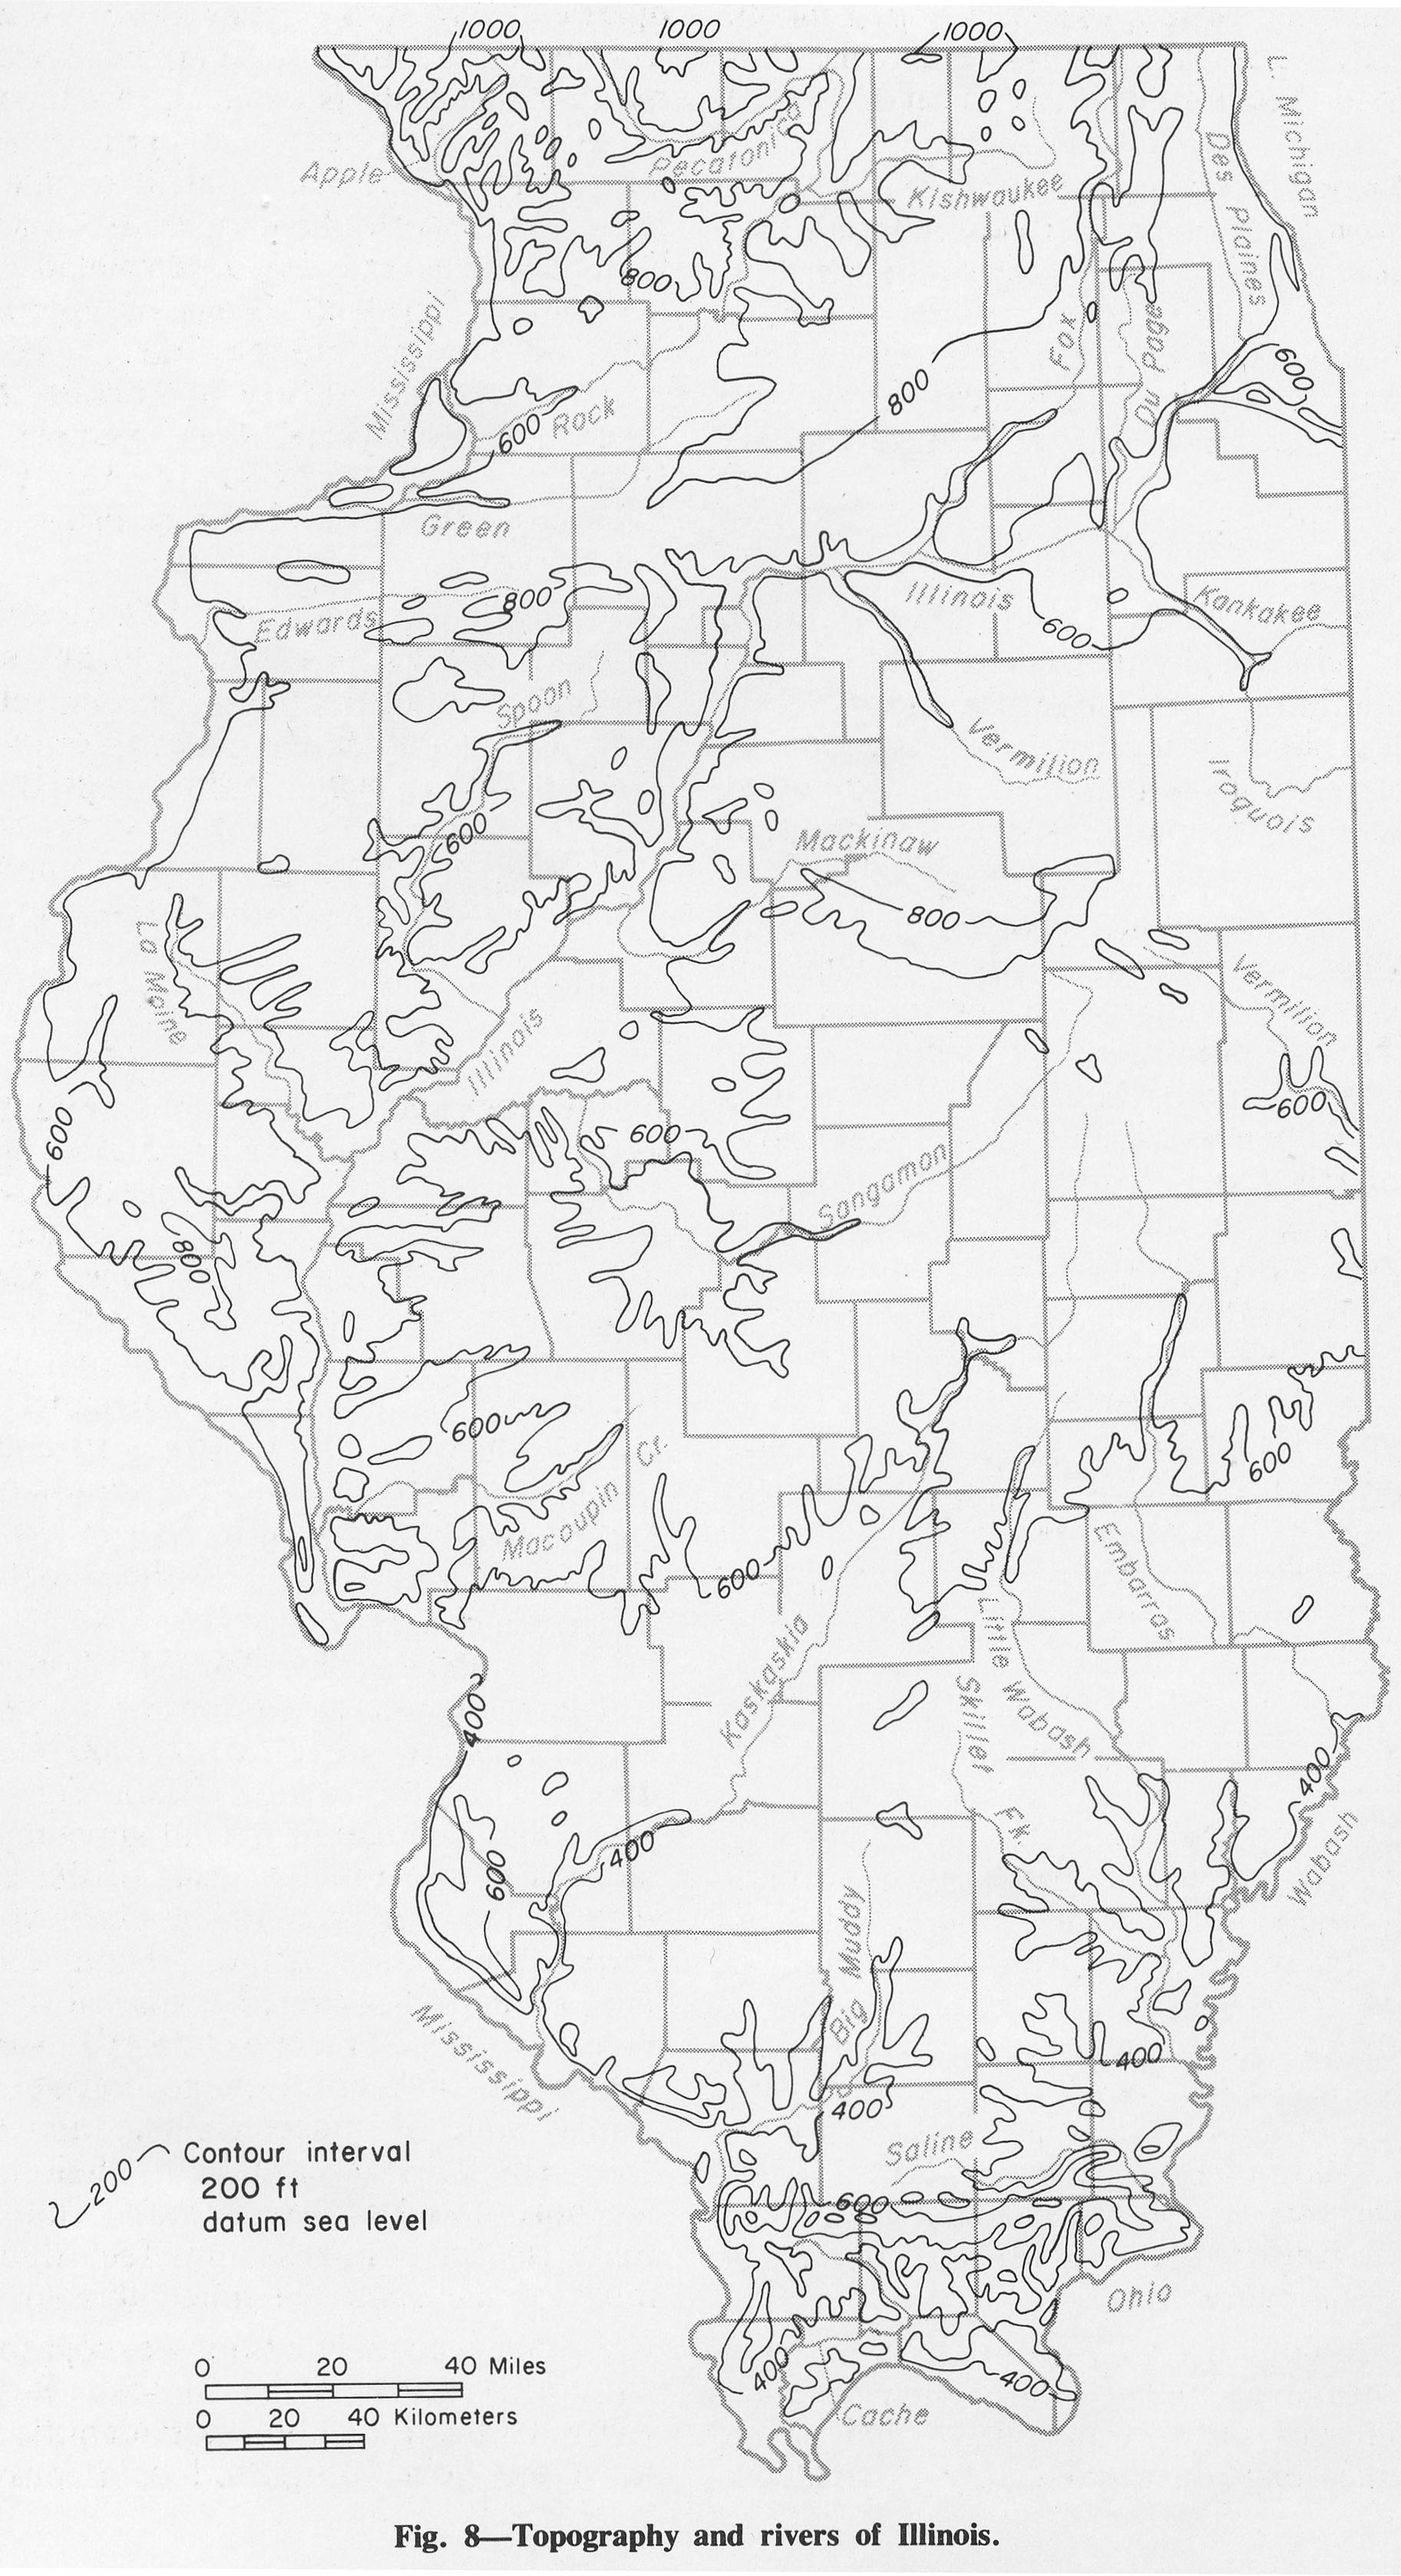
| 15:53, 1 April 2016 | Figure 8.jpg (file) |  |
834 KB | Fig. 8 -- Topography and rivers of Illinois. | 1 |
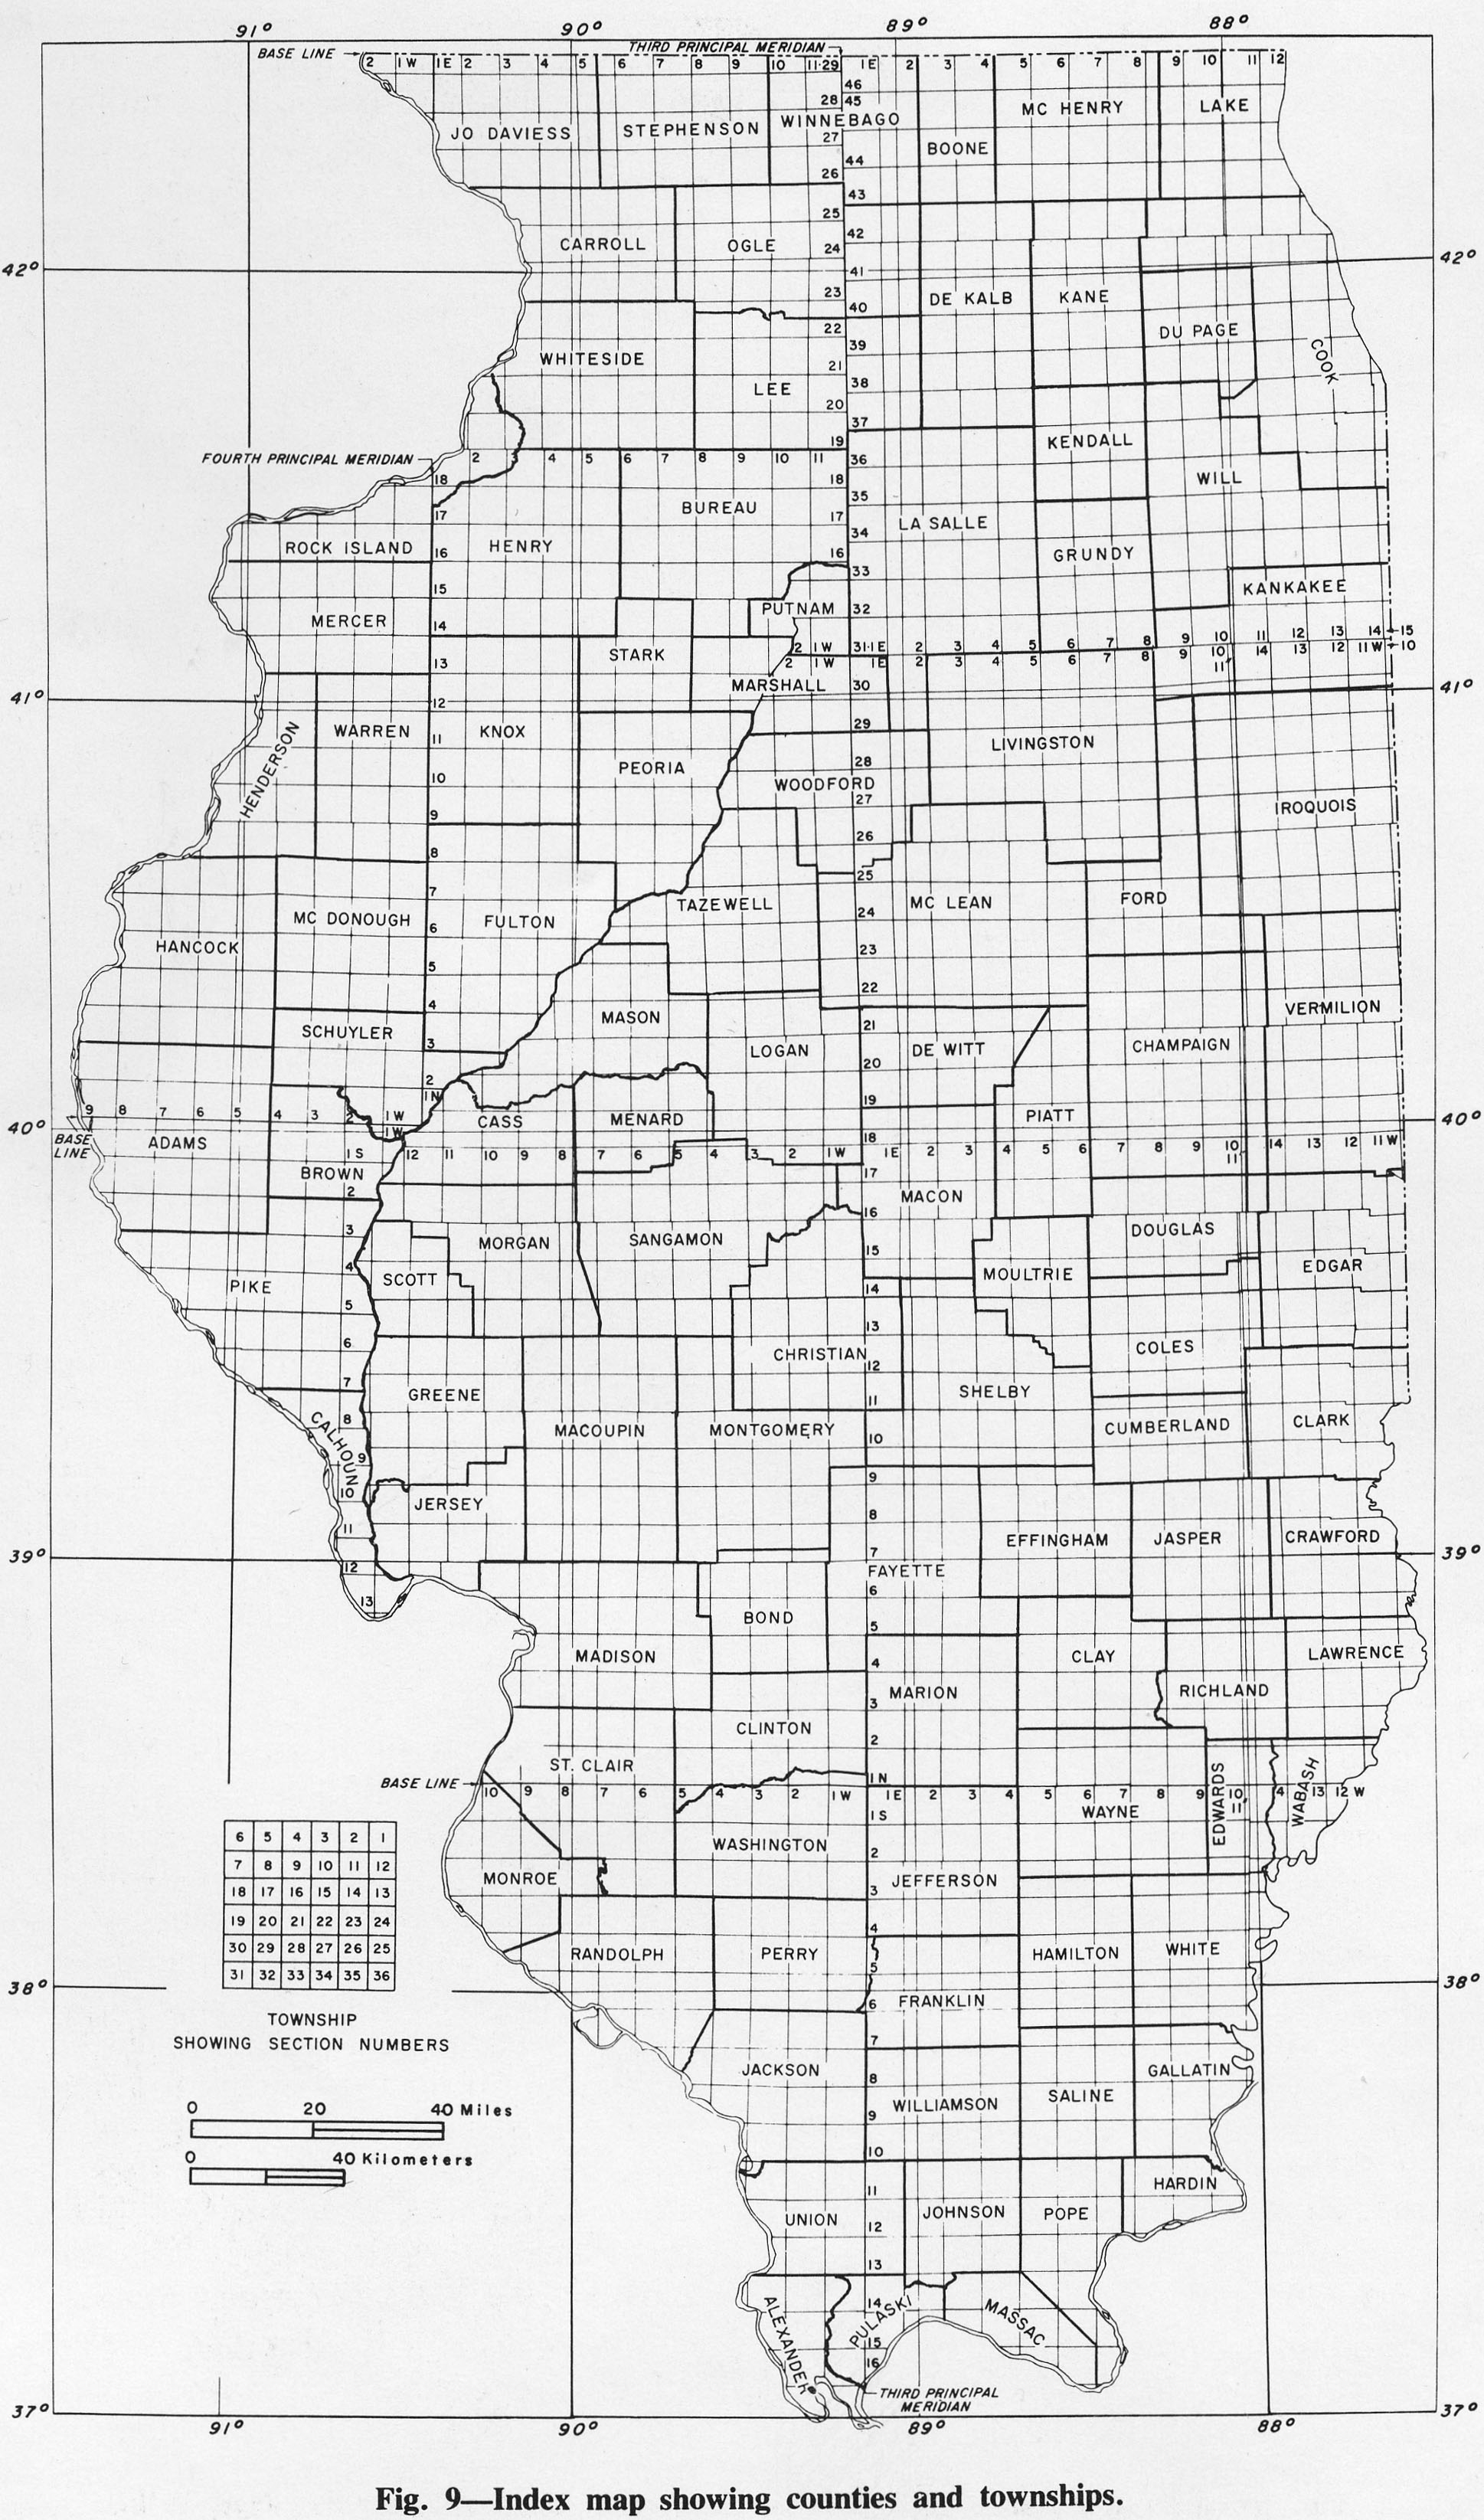
| 15:54, 1 April 2016 | Figure 9.jpg (file) |  |
895 KB | Fig. 9 -- Index map showing counties and townships. | 1 |
| 15:57, 1 April 2016 | Figure 11.jpg (file) |  |
1.89 MB | Fig. 11 -- Generalized surficial geology of Illinois. In uneroded areas the loess thins from 25-100 feet thick in the bluffs of the major valleys to 1-2 feet in areas farthest from valleys. | 1 |
| 19:35, 1 April 2016 | Figure 13.jpg (file) |  |
574 KB | Fig. 13 -- Geologic cross section along the lines shown in figure 12 (after Willman er al., 1967). | 1 |
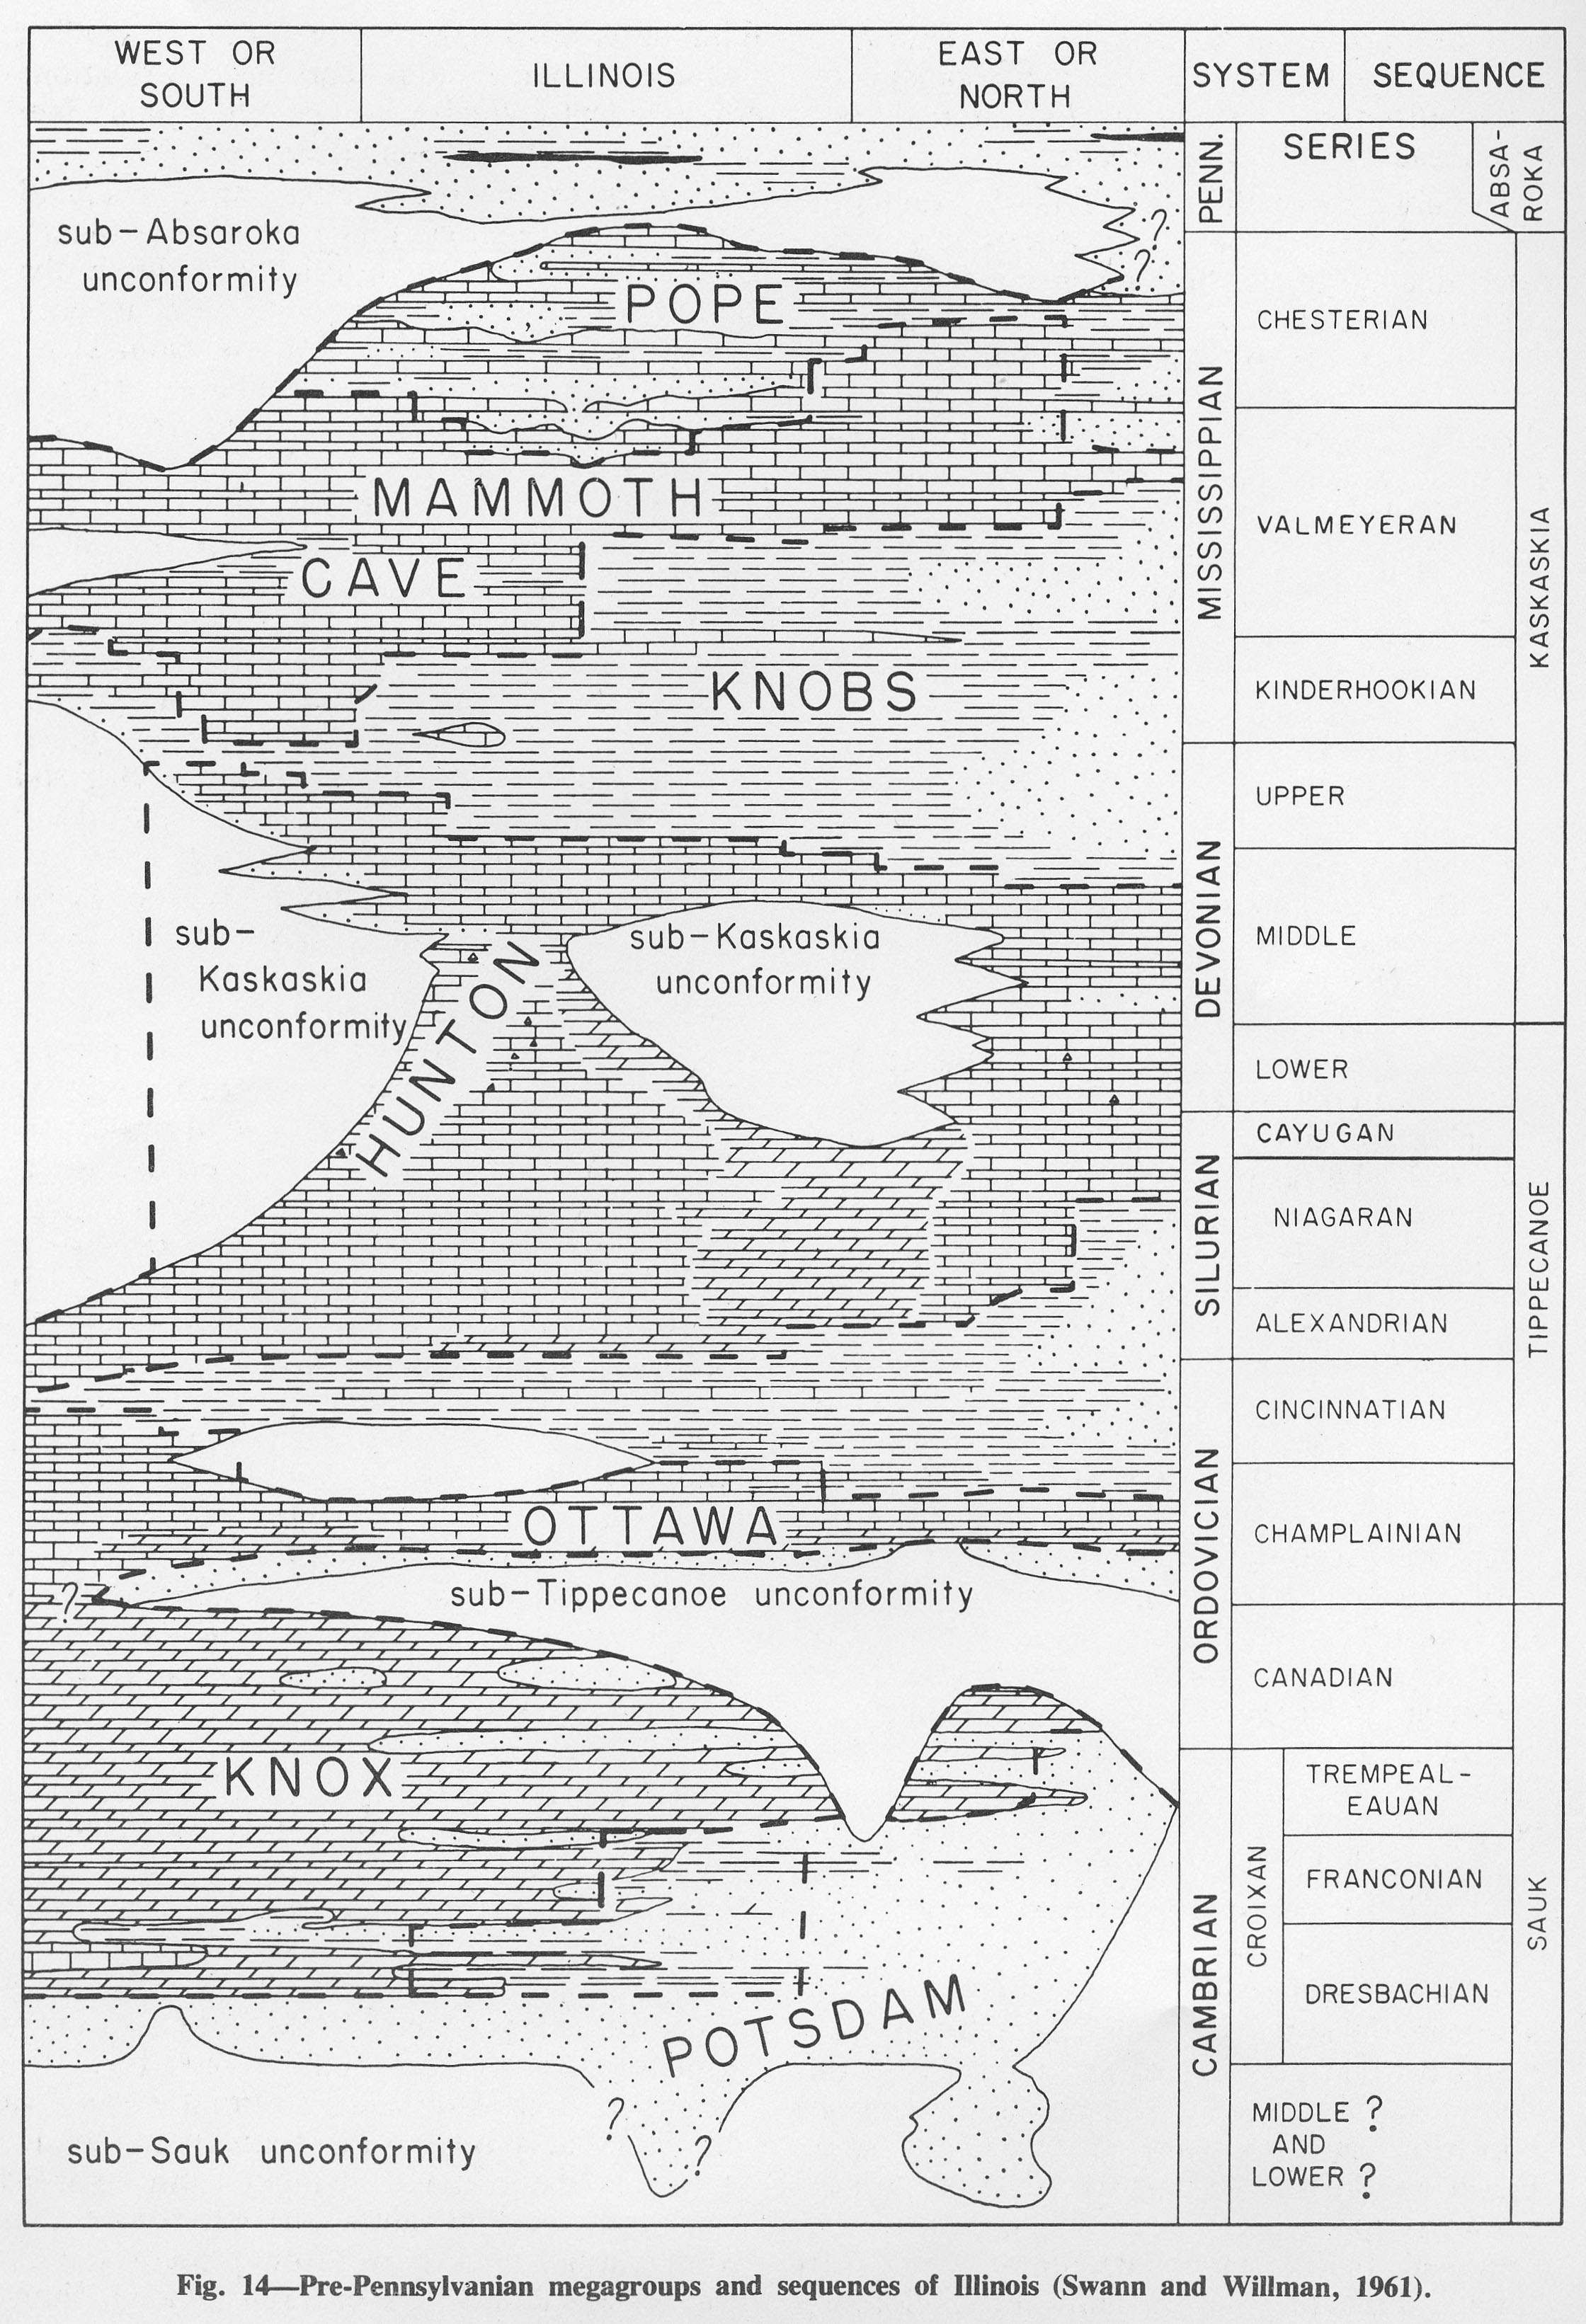
| 19:36, 1 April 2016 | Figure 14.jpg (file) |  |
1.08 MB | Fig. 14 -- Pre-Pennsylvanian megagroups and sequences of Illinois (Swann and Willman, 1961). | 1 |
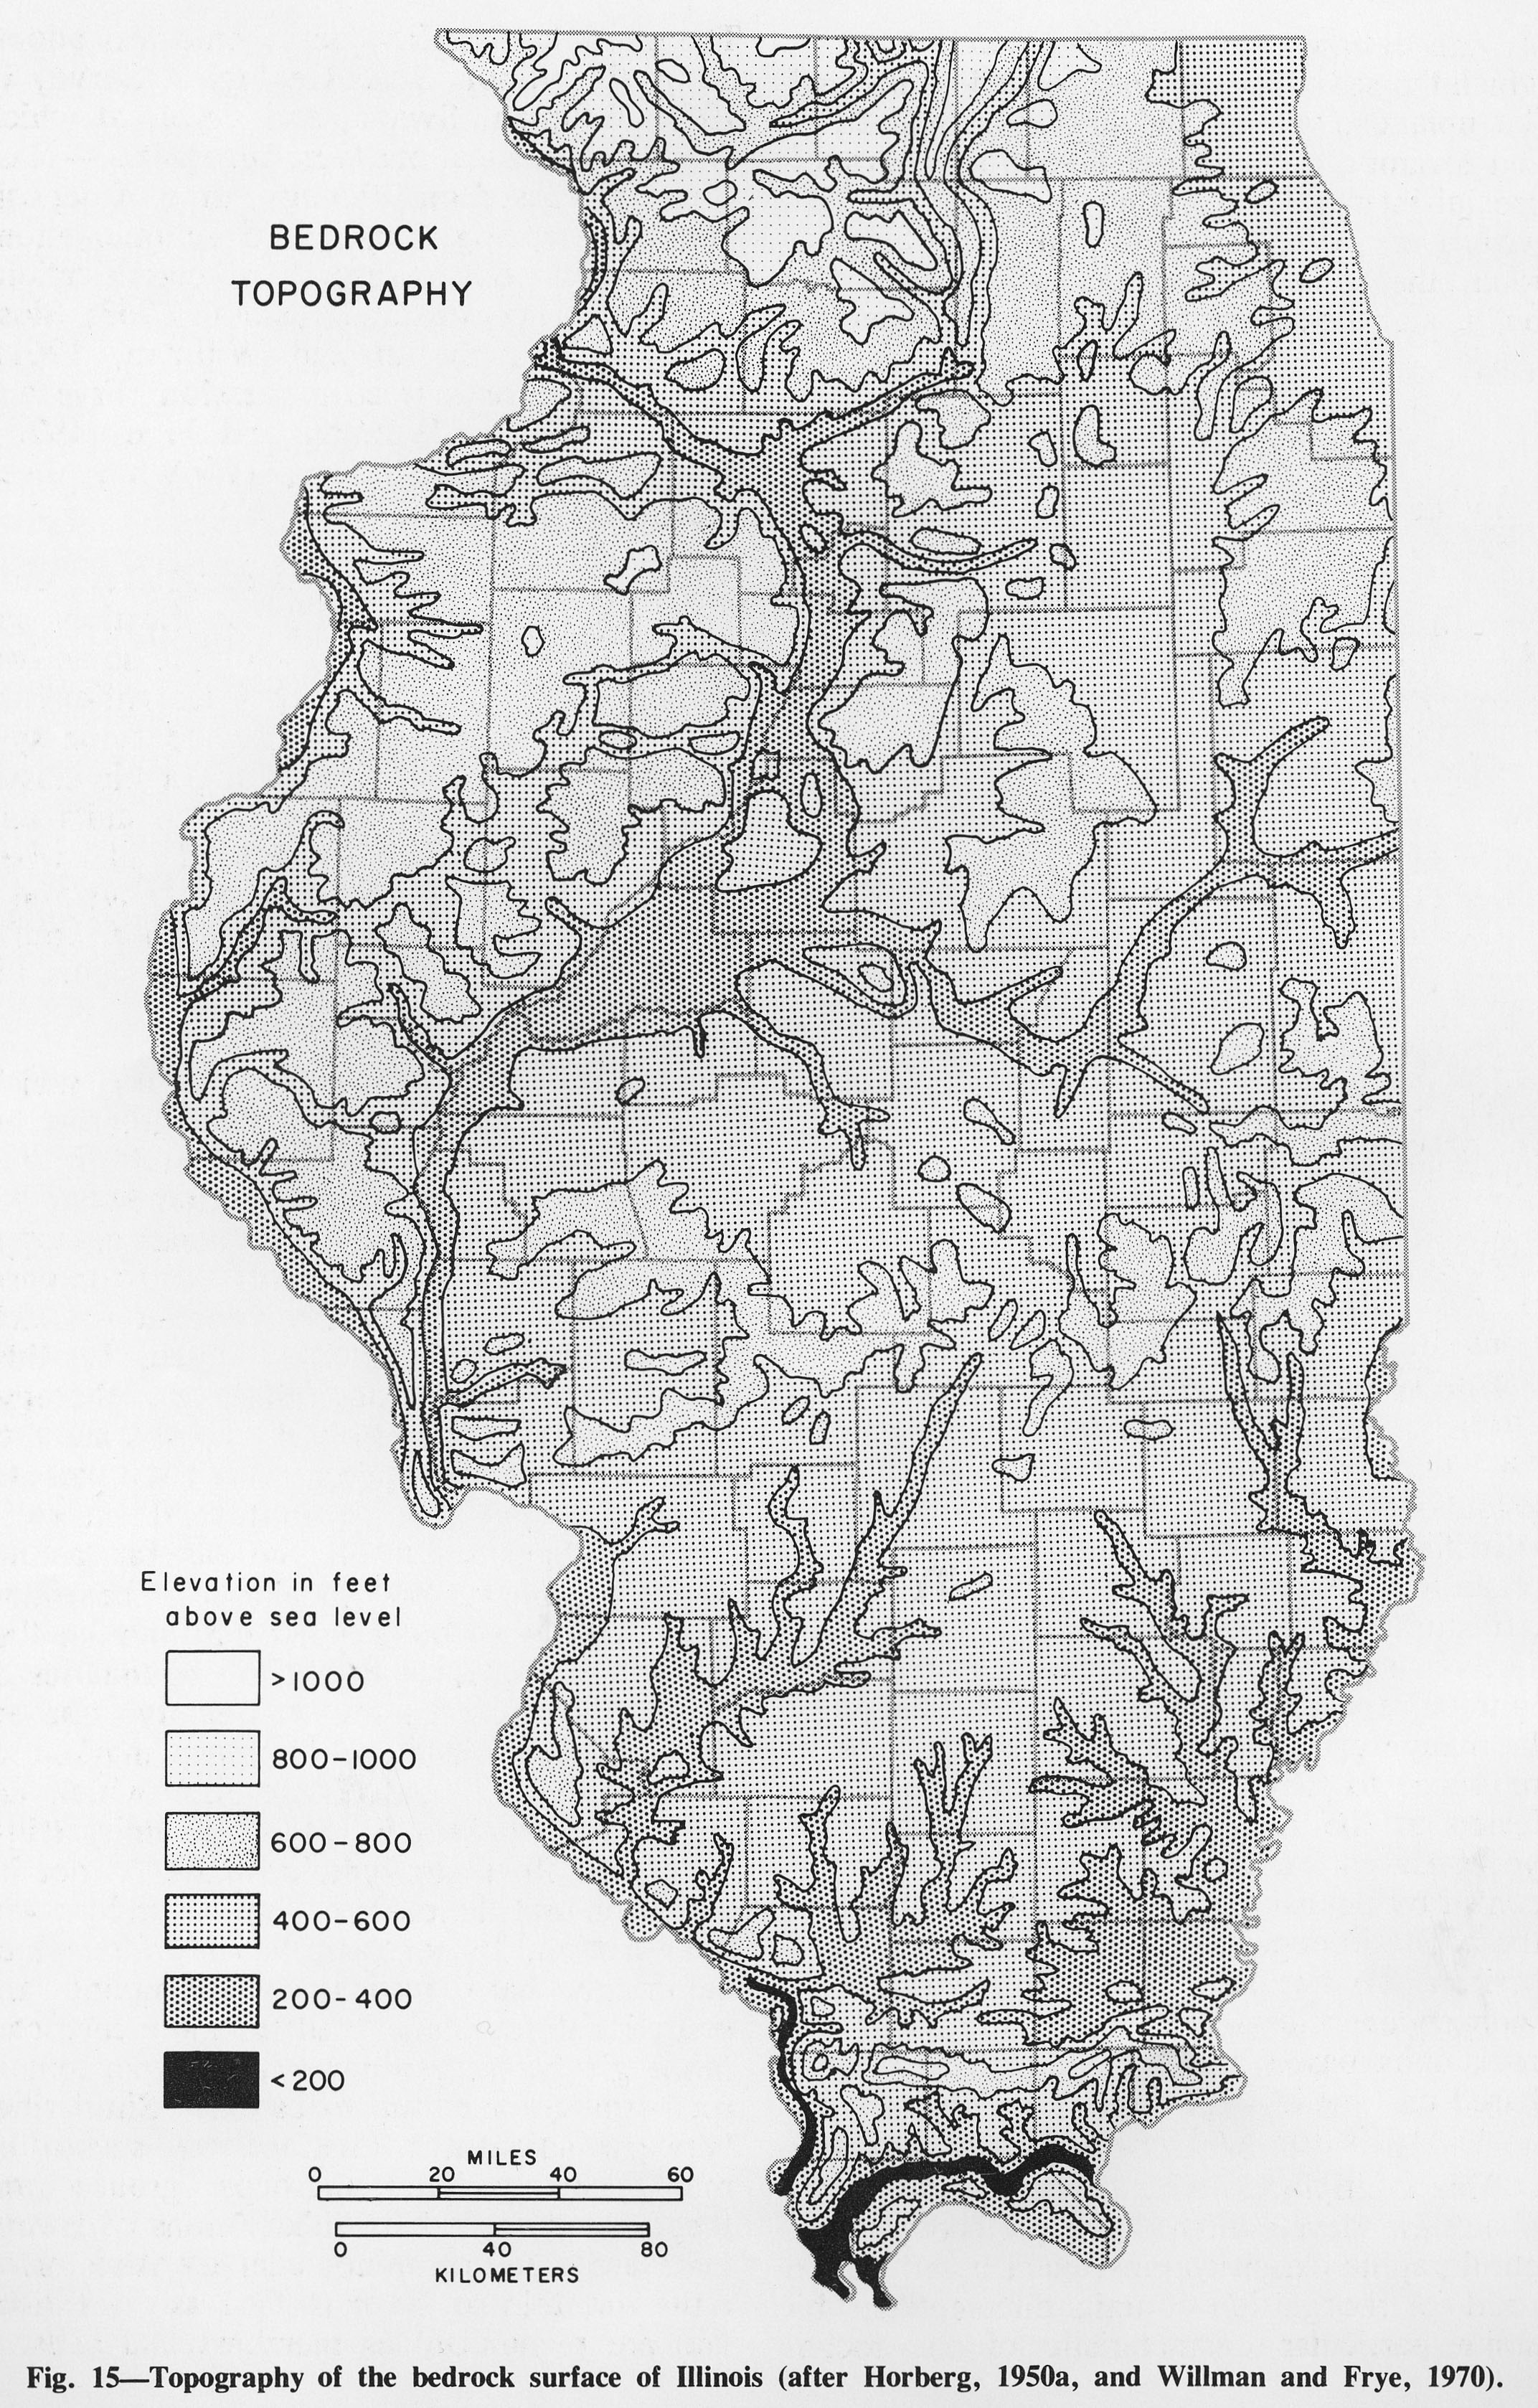
| 19:38, 1 April 2016 | Figure 15.jpg (file) |  |
1.73 MB | Fig. 15 -- Topography of the bedrock surface of Illinois (after Horberg, 1950a and Willman and Frye, 1970). | 1 |
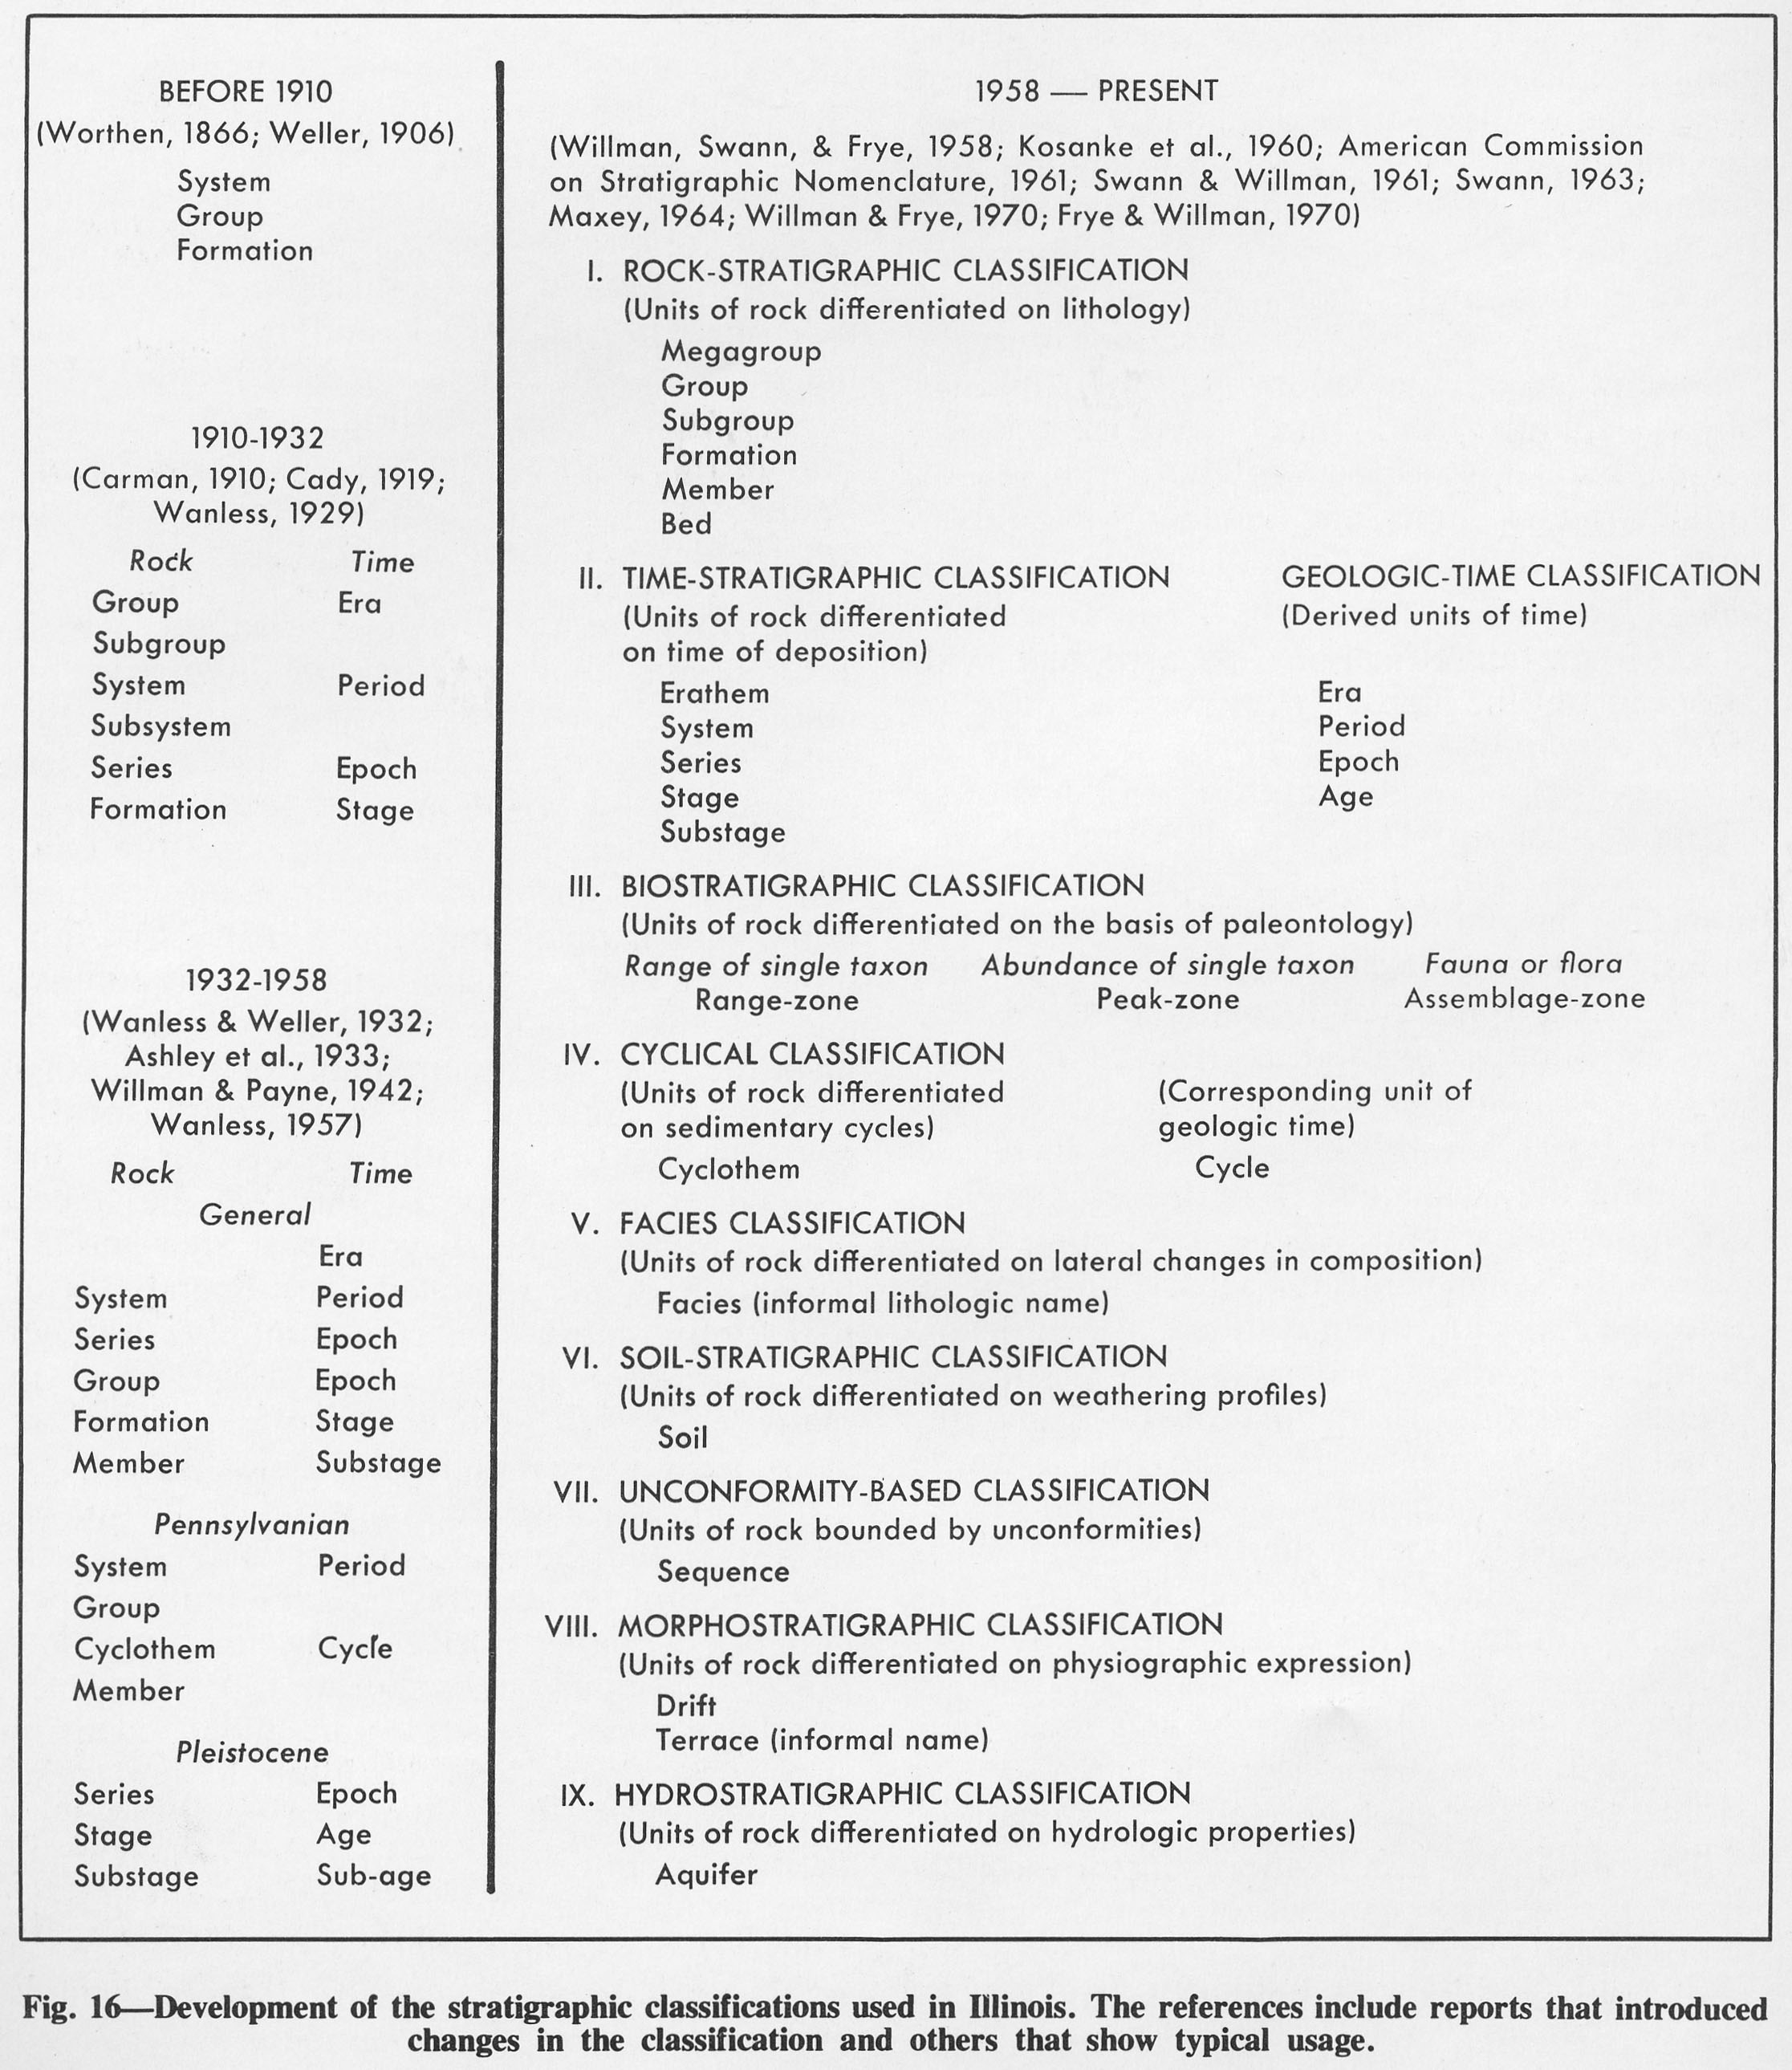
| 19:39, 1 April 2016 | Figure 16.jpg (file) |  |
610 KB | Fig. 16 -- Development of the stratigraphic classifications used in Illinois. The references include reports that introduced changes in the classification and others that show typical usage. | 1 |
| 19:40, 1 April 2016 | Figure 17.jpg (file) |  |
301 KB | Fig. 17 -- Patterns and symbols used in figures. | 1 |
| 19:41, 1 April 2016 | Figure C-2.jpg (file) |  |
321 KB | Fig. C-2 --Thickness of the Cambrian System. The dashed lines show reconstructed thickness. | 1 |
| 19:42, 1 April 2016 | Figure C-3.jpg (file) |  |
377 KB | Fig. C-3 -- columnar section of the Cambrian System. | 1 |
| 19:43, 1 April 2016 | Figure C-4.jpg (file) |  |
585 KB | Fig. C-4 -- Diagrammatic cross section of the Cambrian System from northwestern to southeastern Illinois. | 1 |
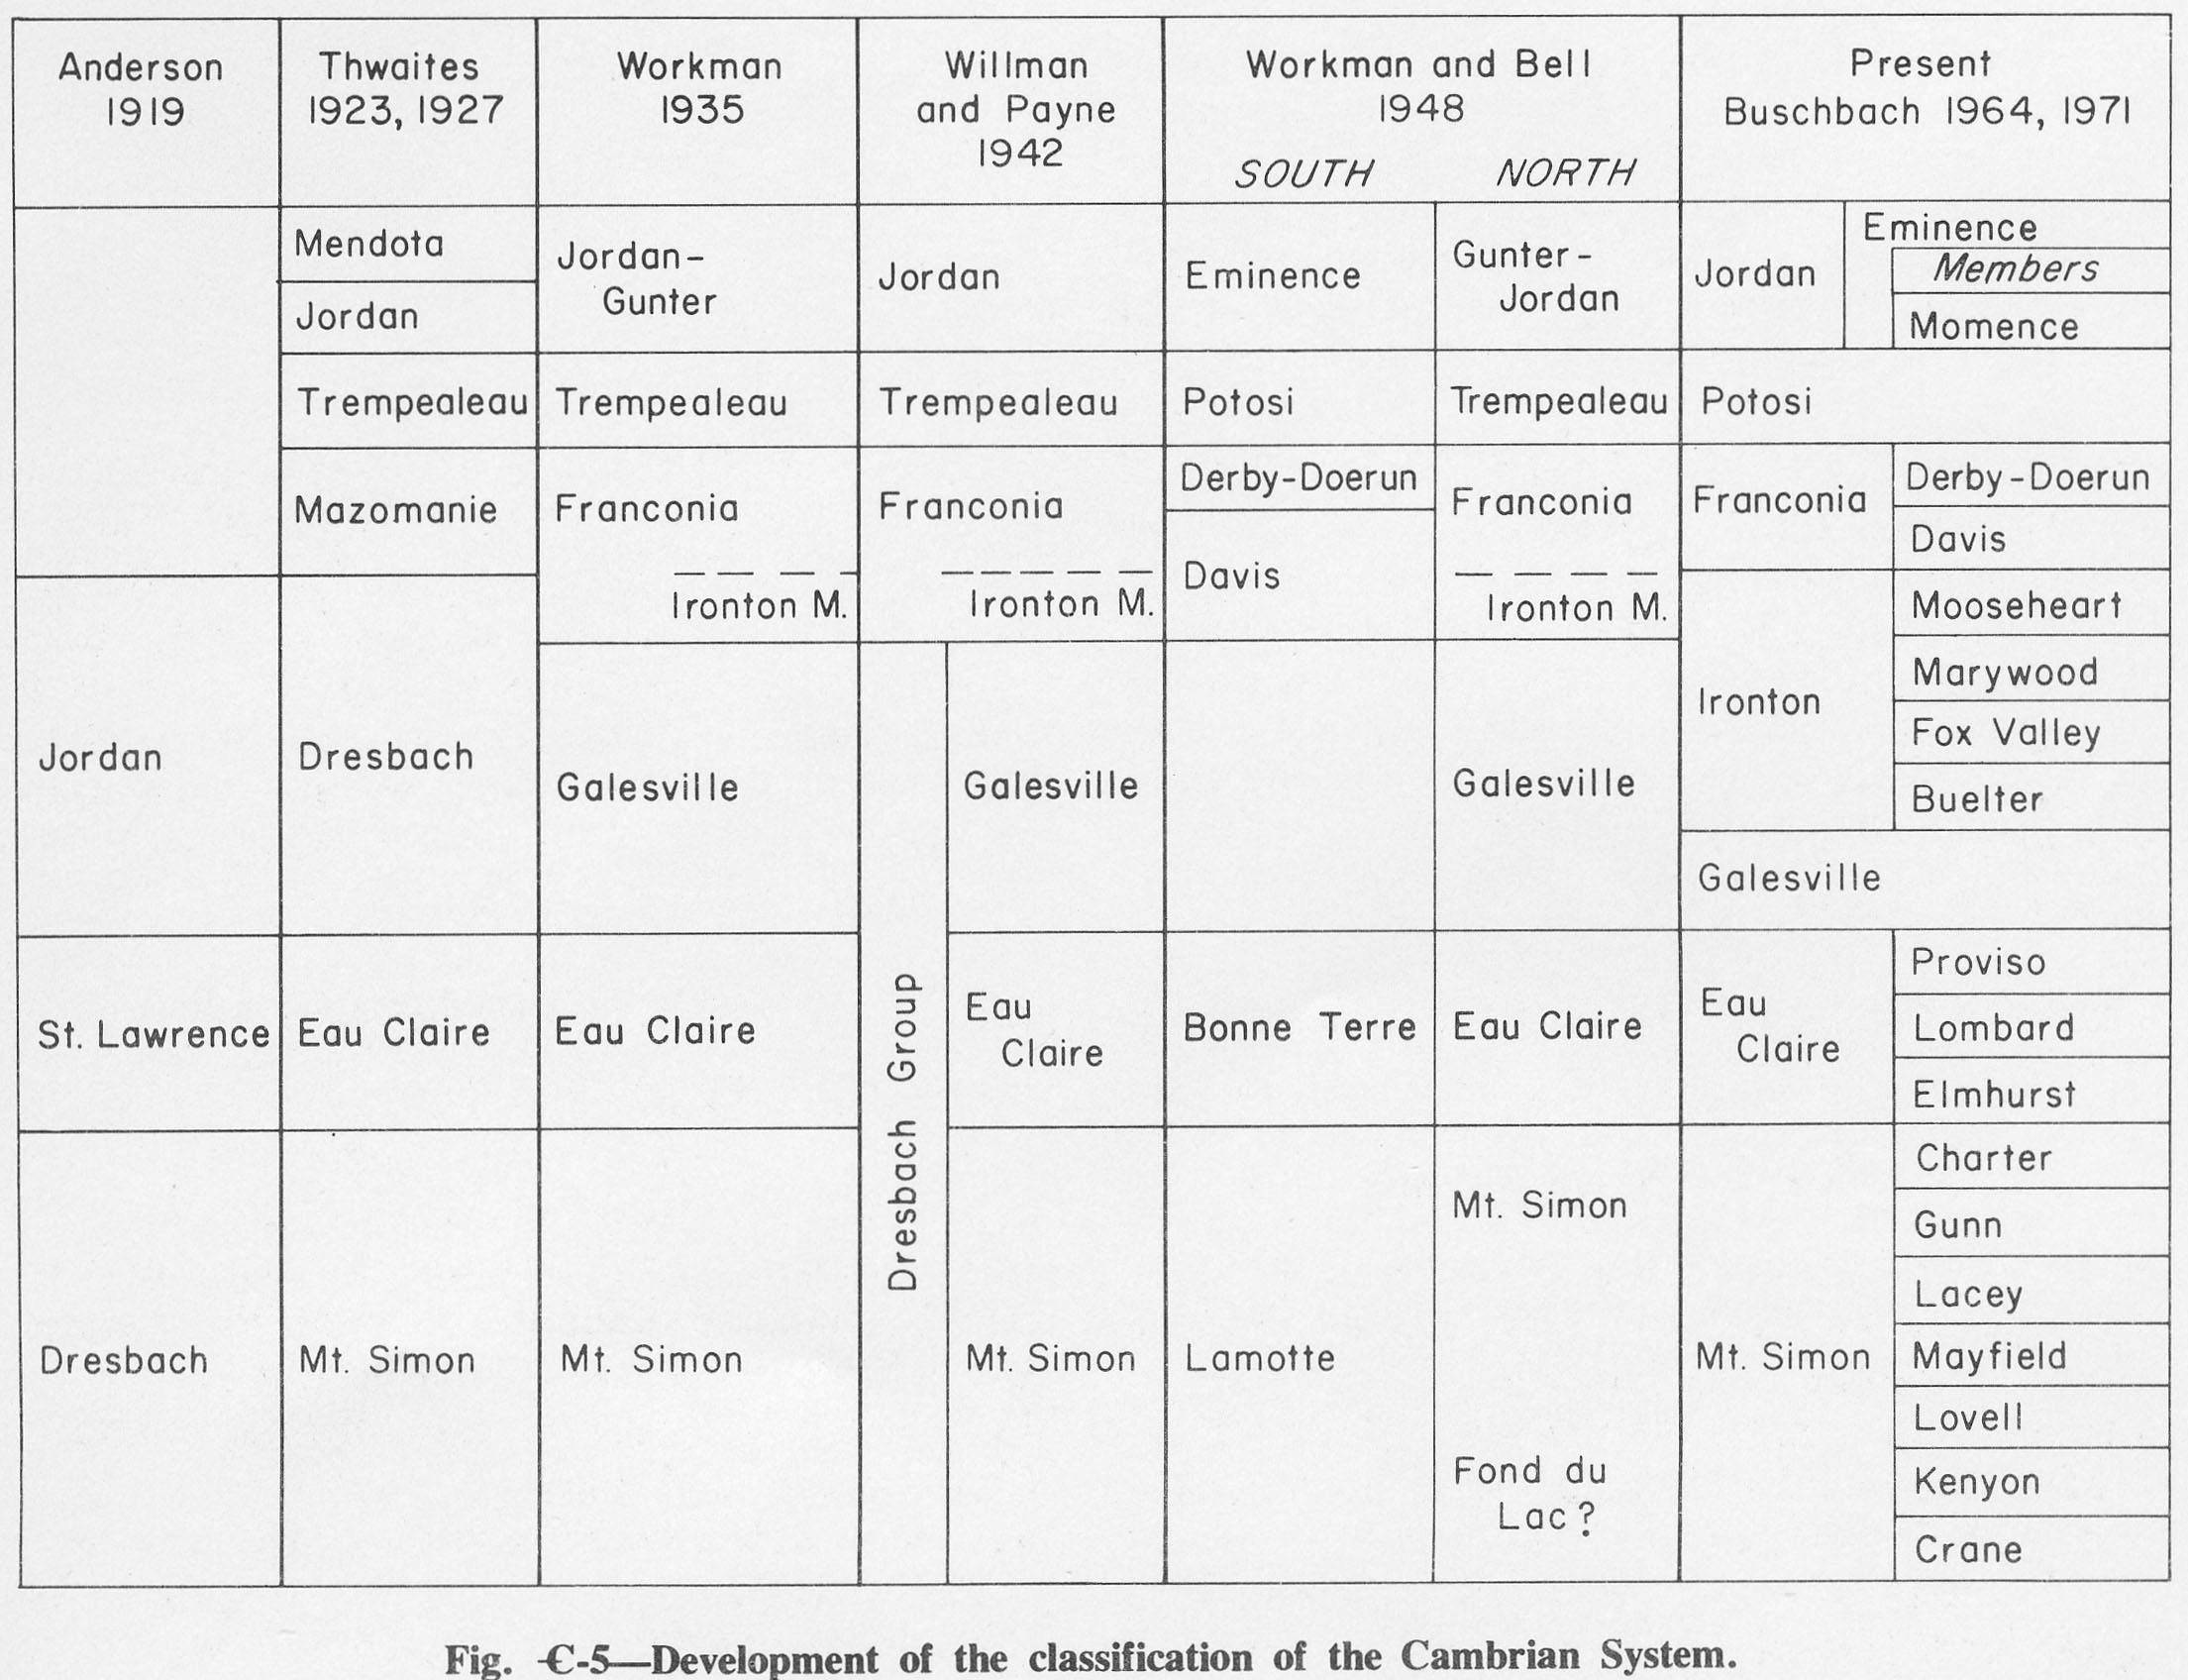
| 19:44, 1 April 2016 | Figure C-5.jpg (file) |  |
388 KB | Fig. C-5 -- Development of the classification of the Cambrian System. | 1 |
| 19:45, 1 April 2016 | Figure C-6.jpg (file) |  |
233 KB | Fig. C-6 -- Thickness of the Mt. Simon Sandstone. | 1 |
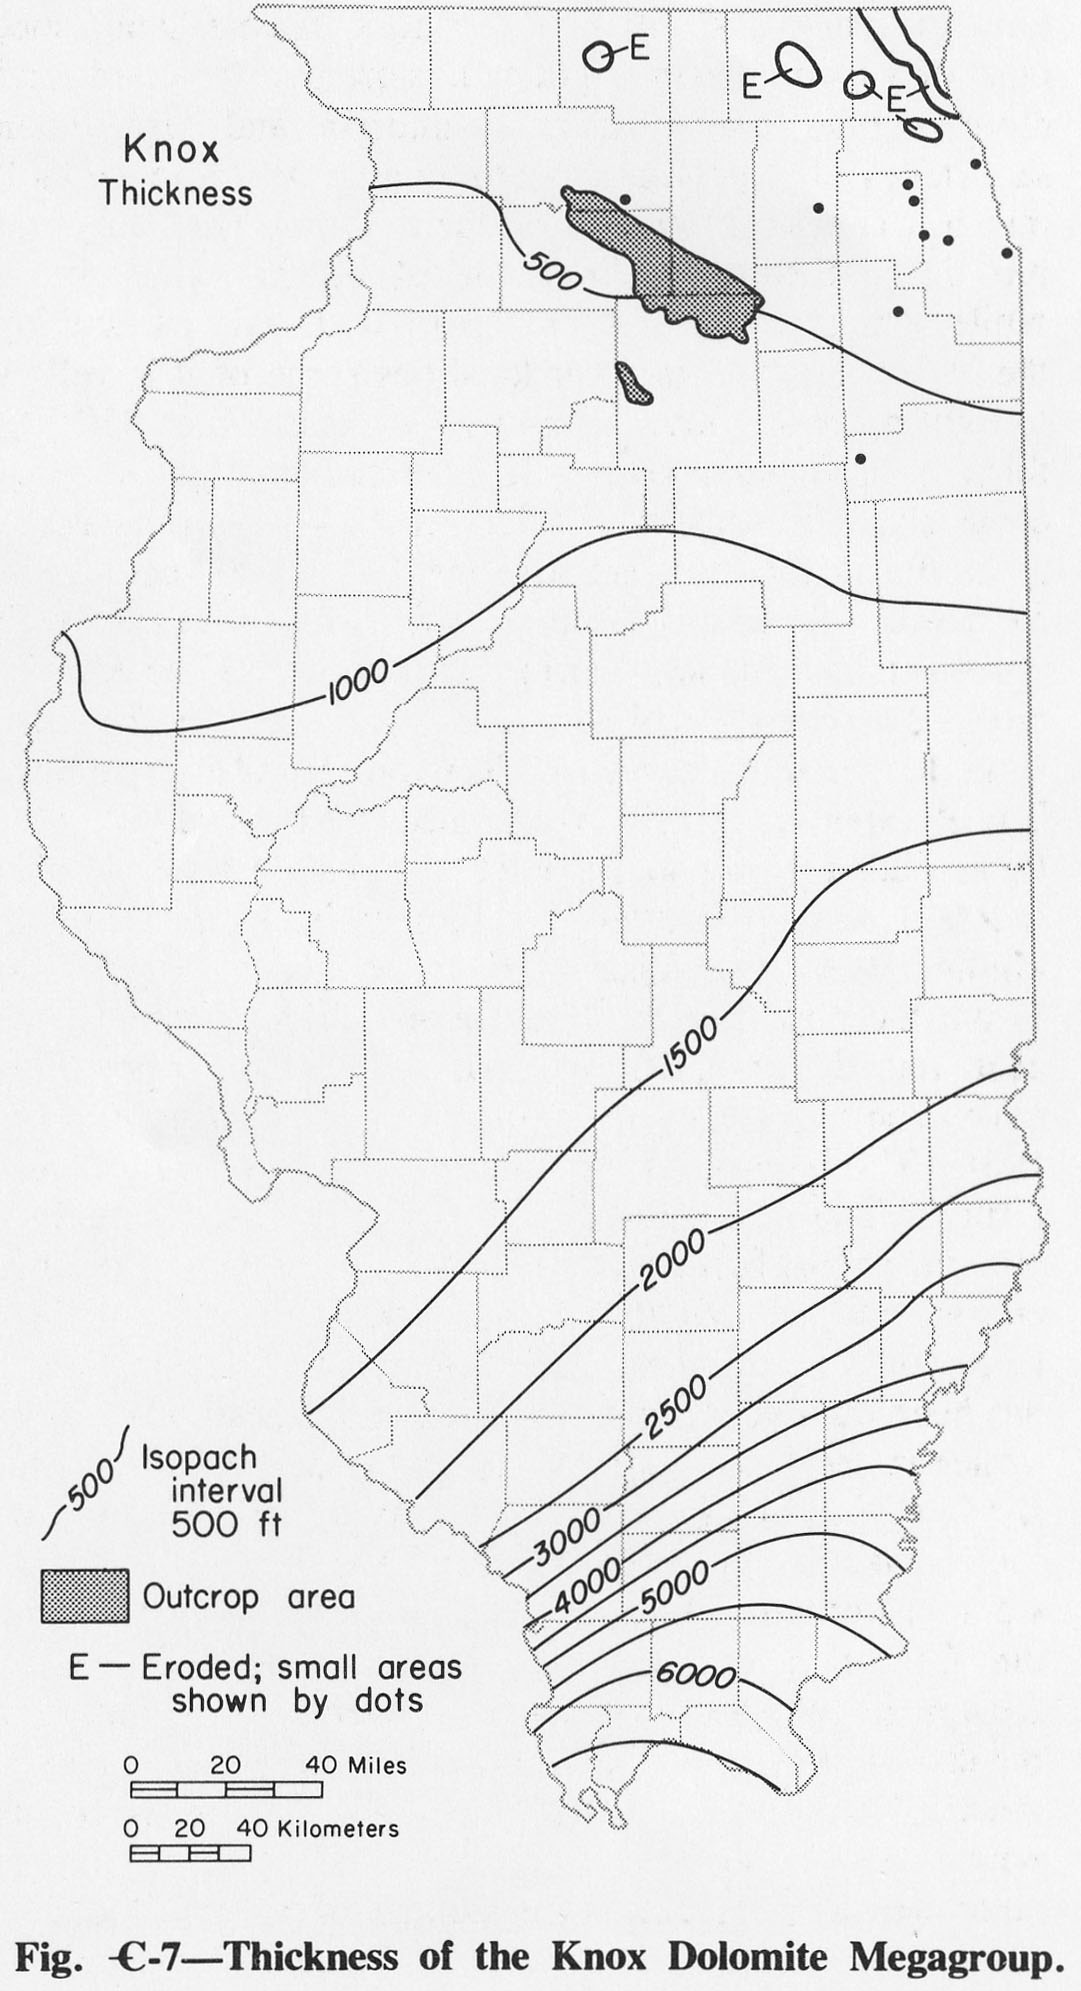
| 19:46, 1 April 2016 | Figure C-7.jpg (file) |  |
261 KB | Fig. C-7 -- Thickness of the Knox Dolomite Megagroup. | 1 |
| 19:47, 1 April 2016 | Figure C-8.jpg (file) |  |
260 KB | Fig. C-8 -- Thickness of the Eau Claire Formation. | 1 |
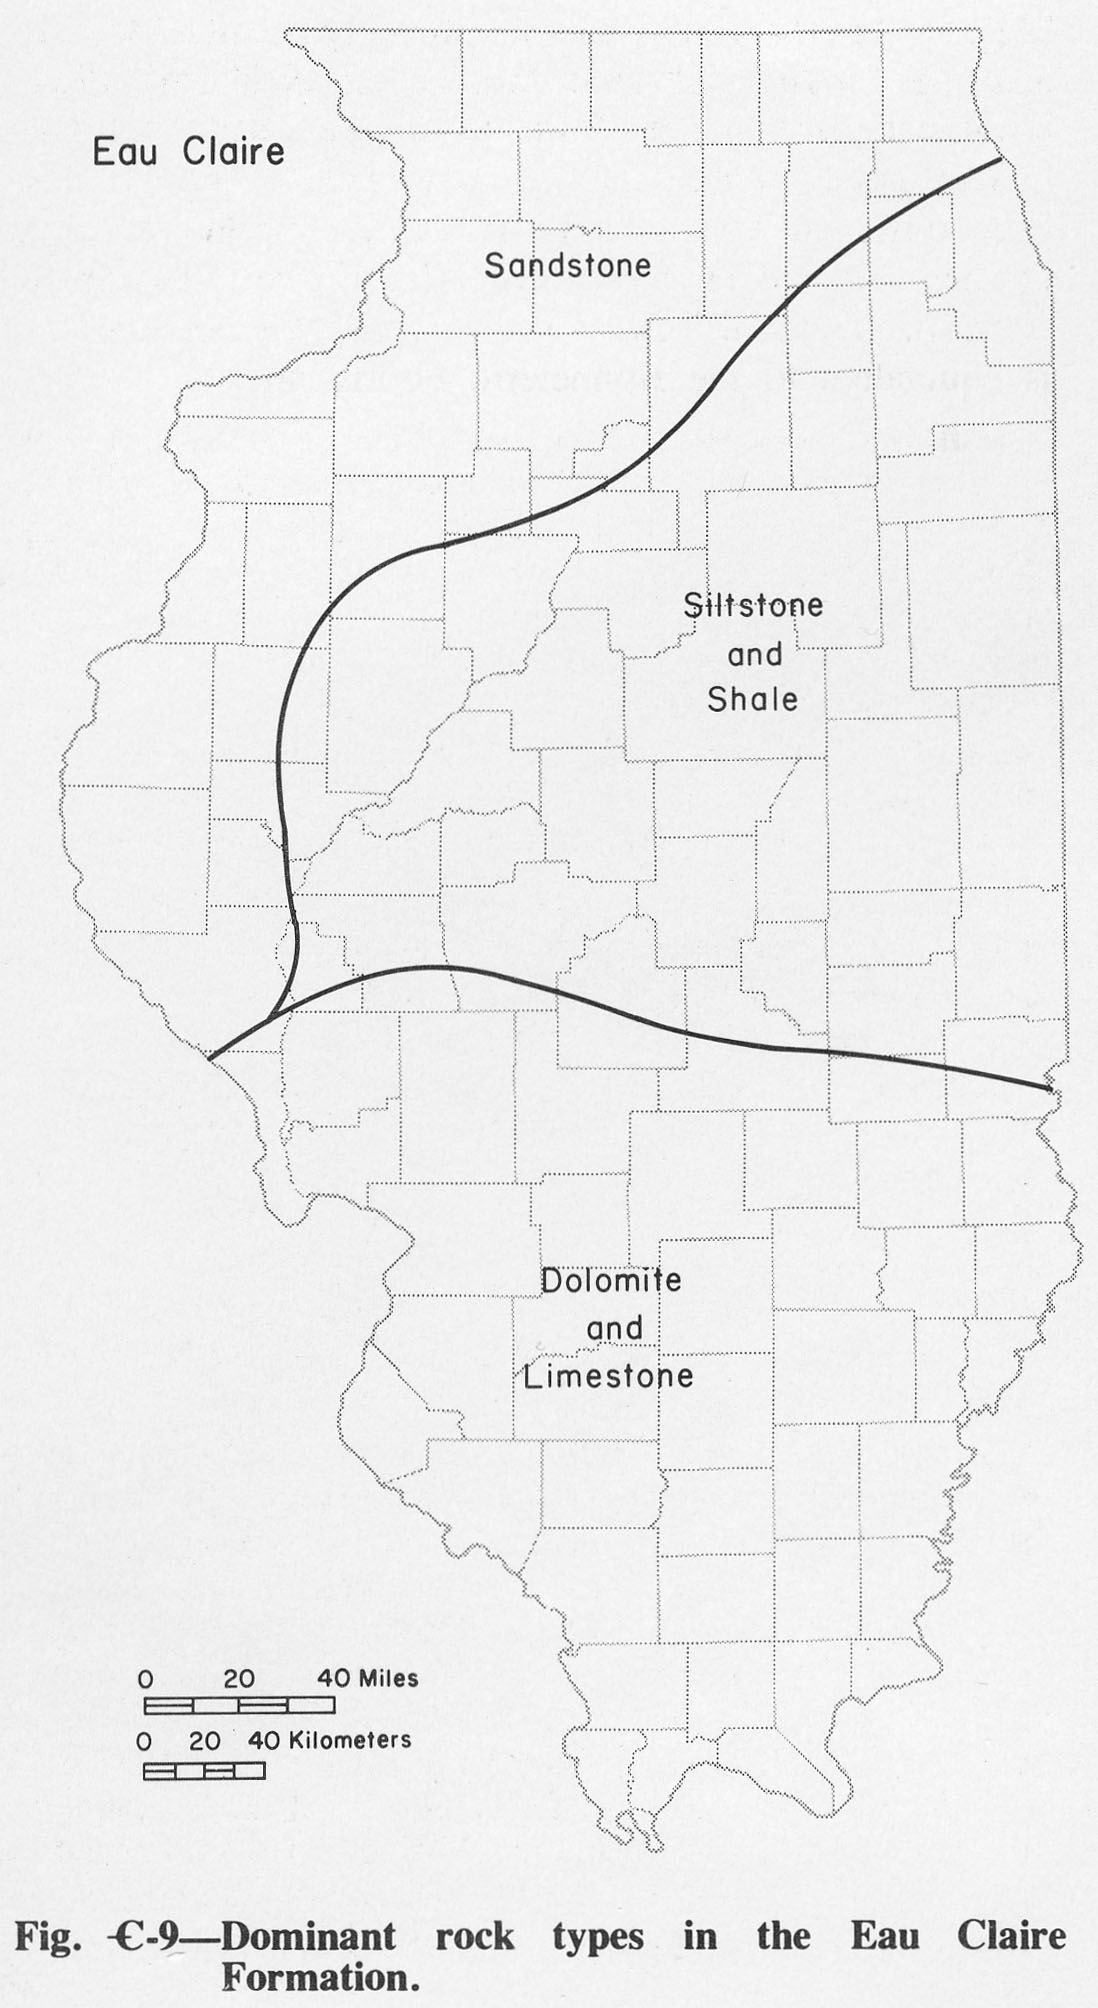
| 19:47, 1 April 2016 | Figure C-9.jpg (file) |  |
231 KB | Fig. C-9 -- Dominant rock types in the Eau Claire Formation. | 1 |
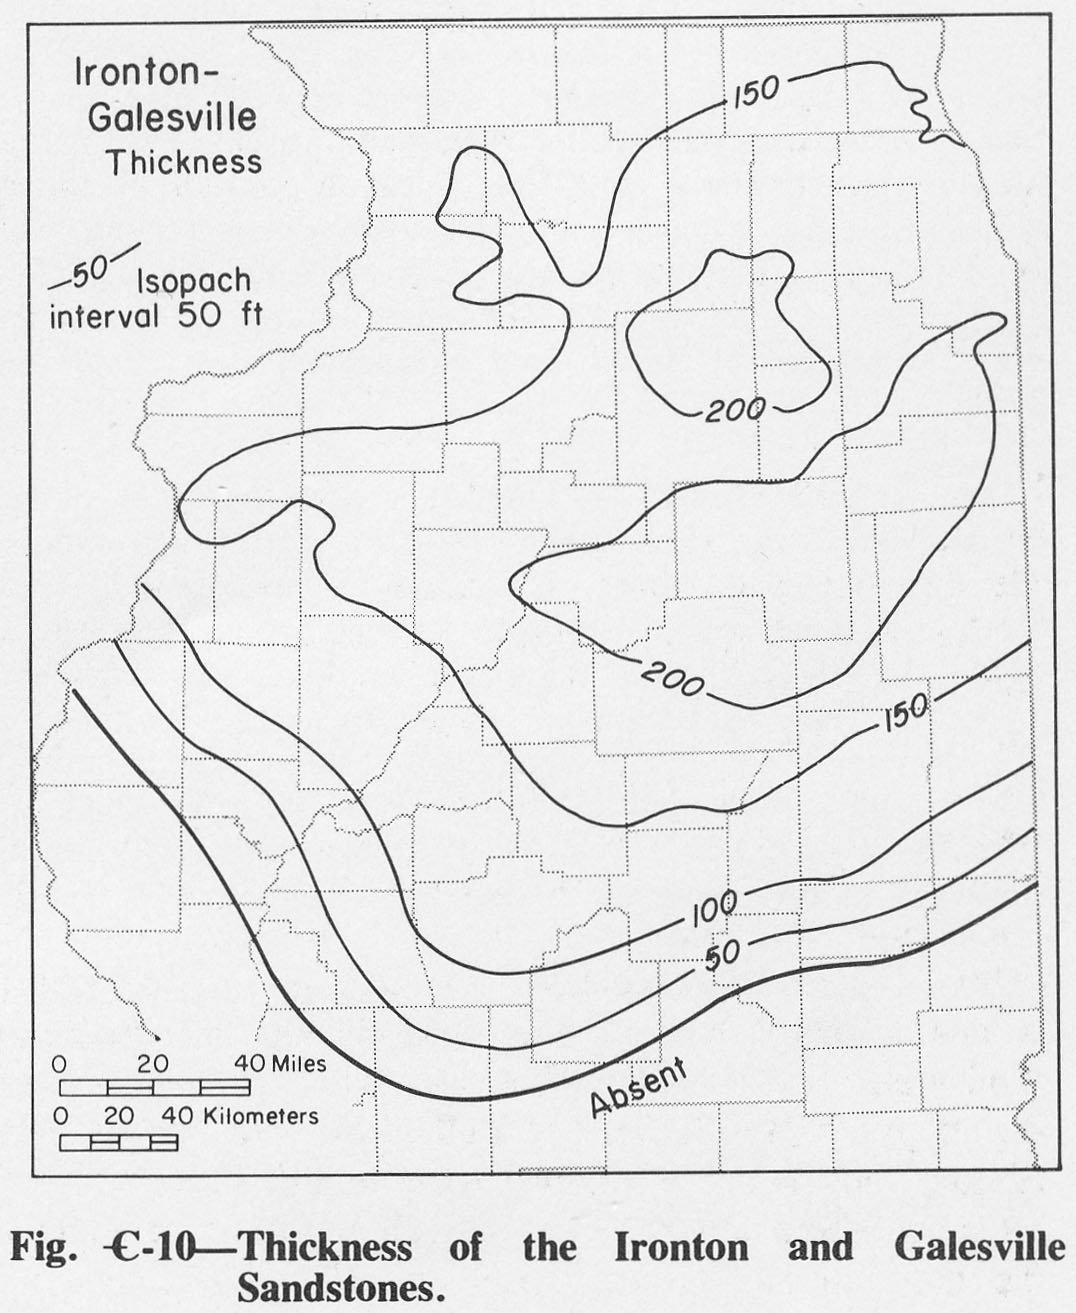
| 19:48, 1 April 2016 | Figure C-10.jpg (file) |  |
204 KB | Fig. C-10 -- Thickness of the Ironton and Galesville Sandstones. | 1 |
| 19:49, 1 April 2016 | Figure C-11.jpg (file) |  |
263 KB | Fig. C- 11 -- Thickness of the Franconia Formation | 1 |
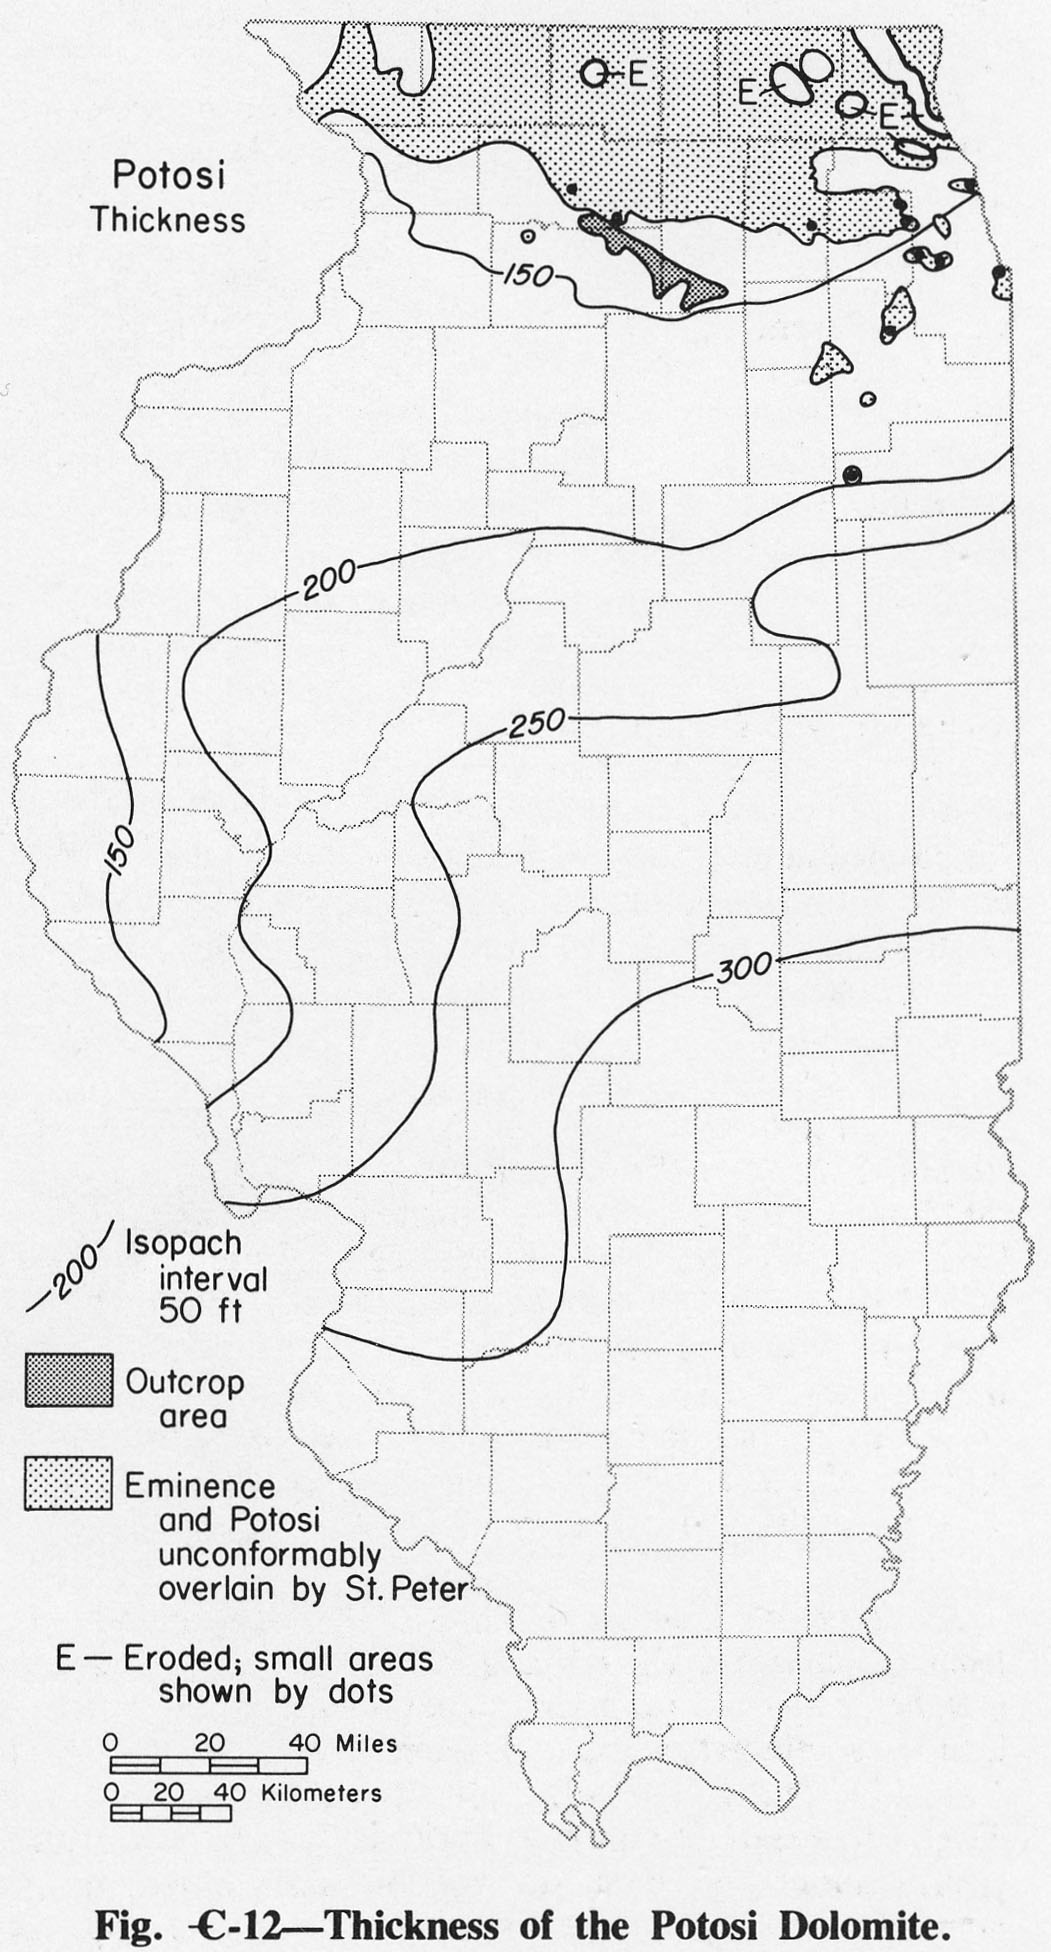
| 19:50, 1 April 2016 | Figure C-12.jpg (file) |  |
298 KB | Fig. C-12 -- Thickness of the Potosi Dolomite. | 1 |
| 19:51, 1 April 2016 | Figure C-13.jpg (file) |  |
293 KB | Fig. C-13 -- Thickness of the Eminence Formation. | 1 |
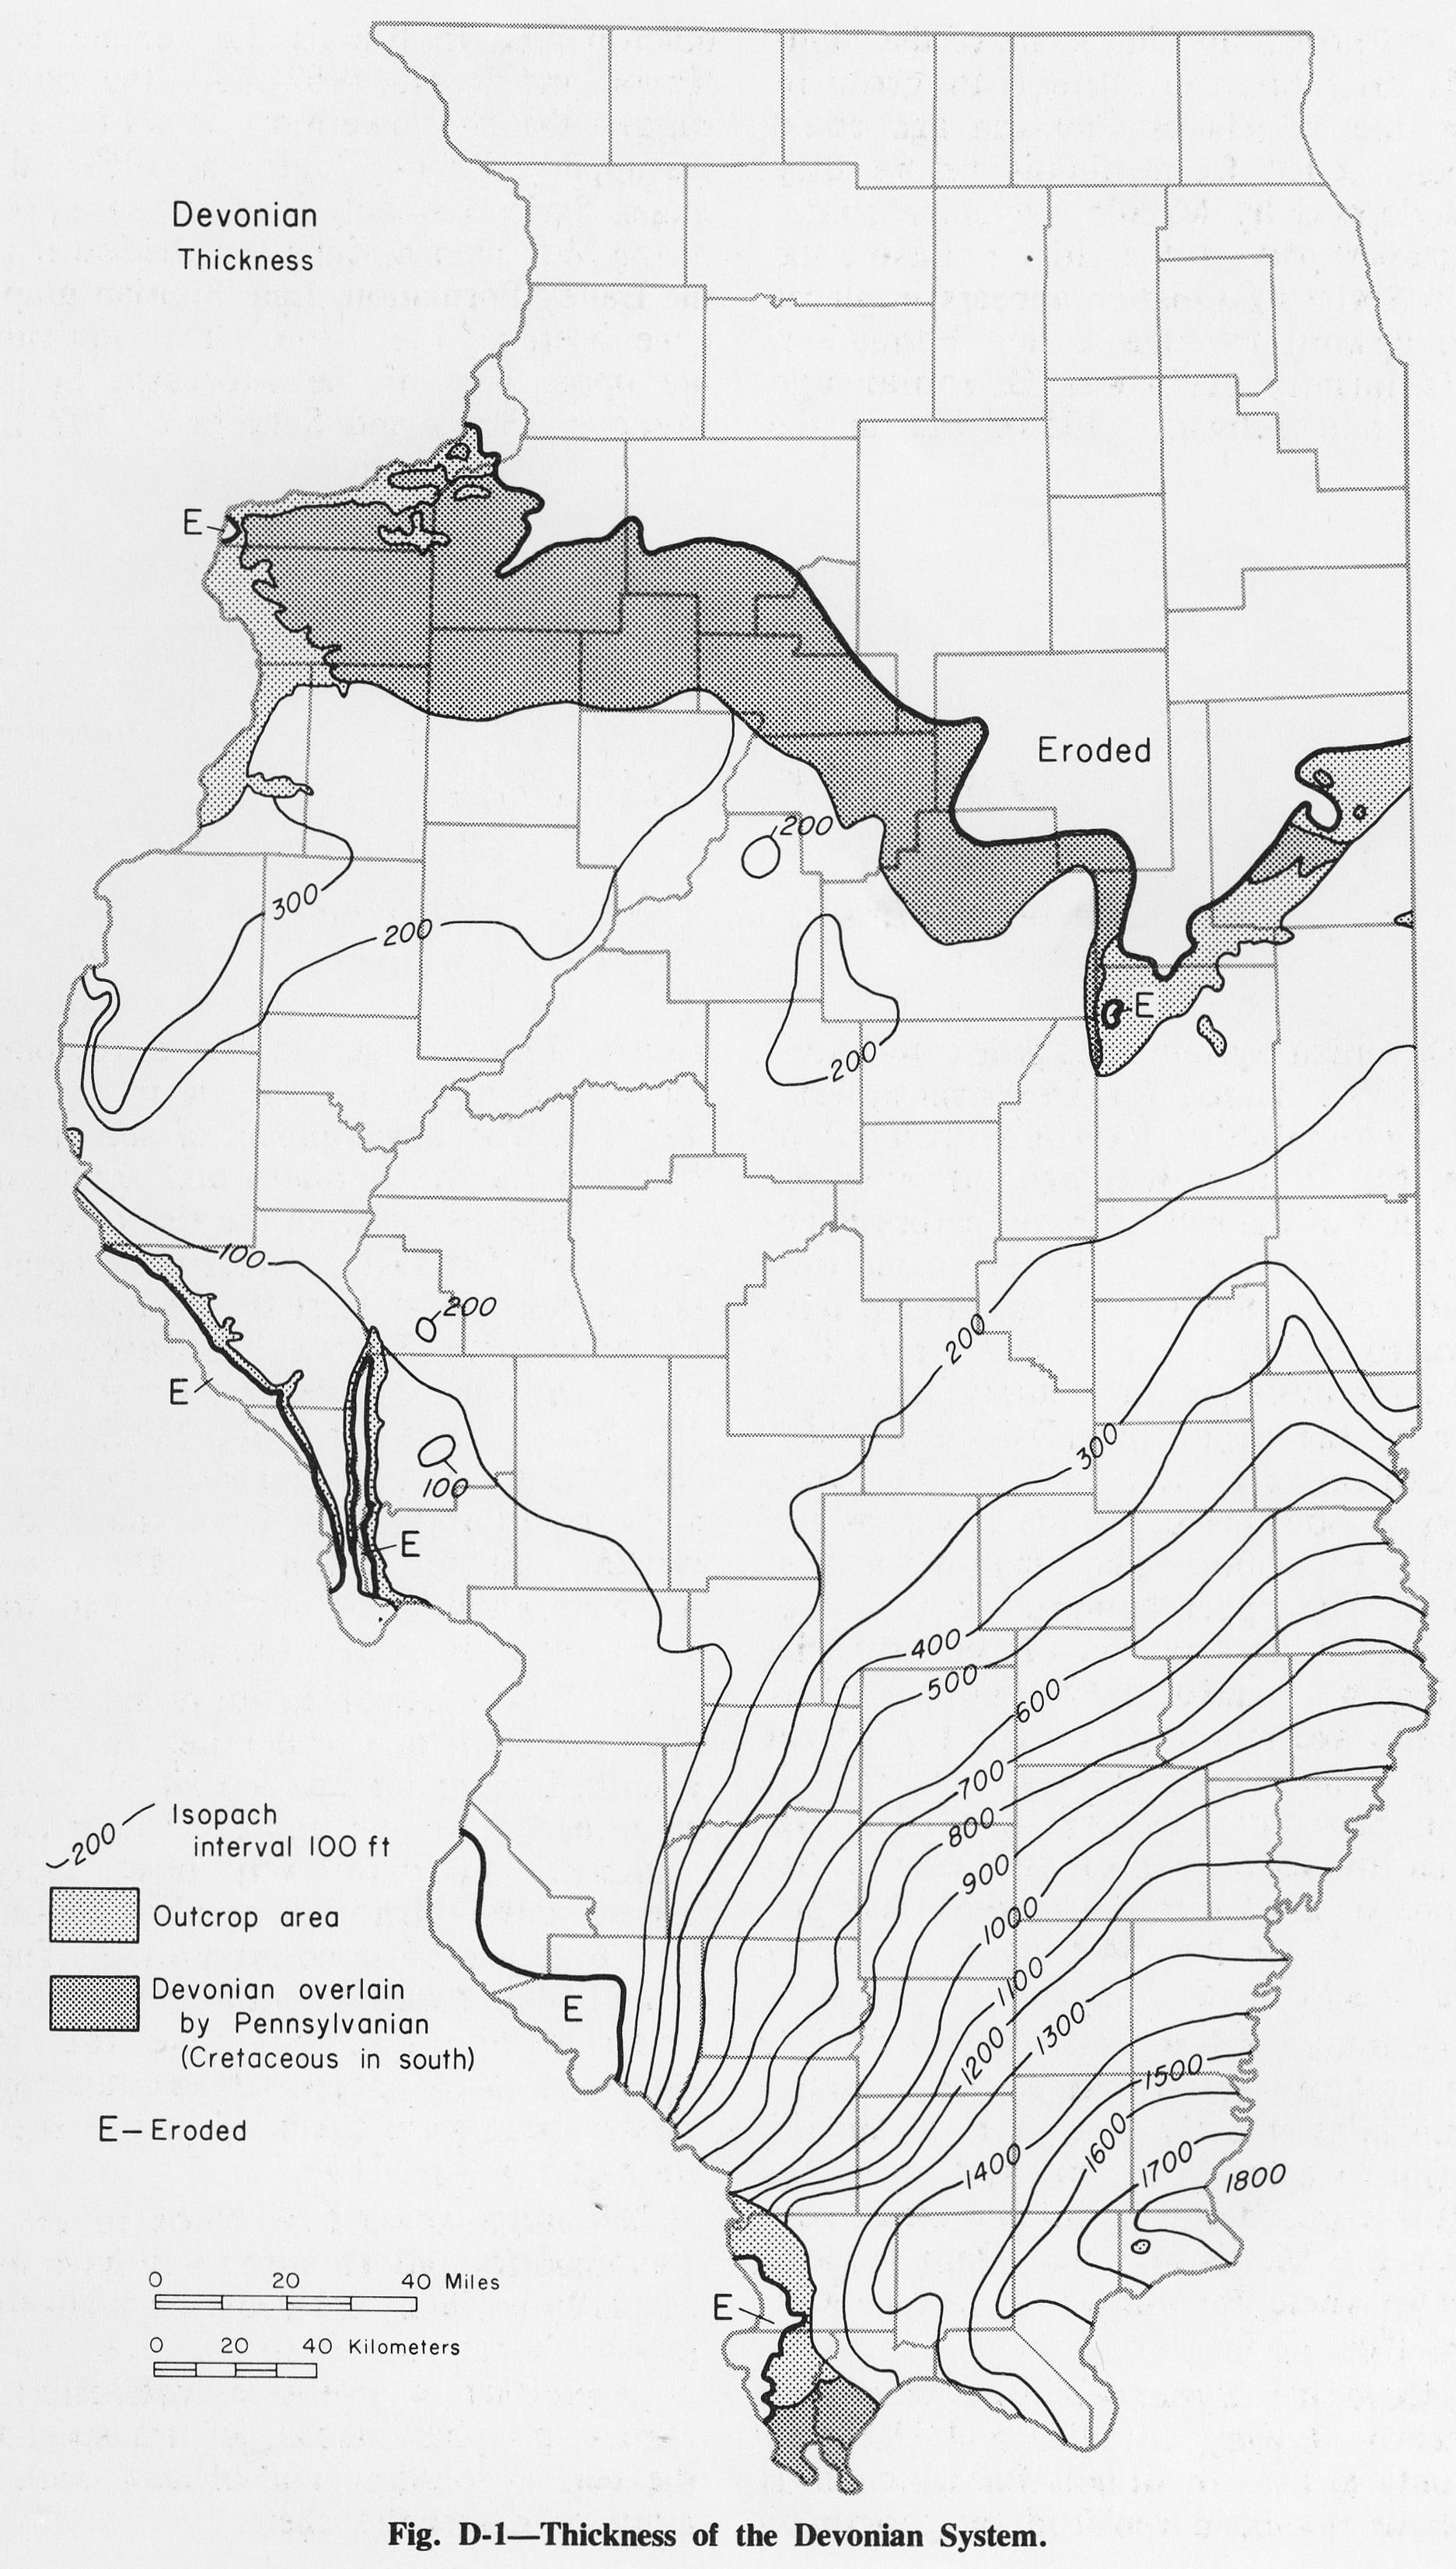
| 19:51, 1 April 2016 | Figure D-1.jpg (file) |  |
777 KB | Fig. D-1 -- Thickness of the Devonian Systems. | 1 |
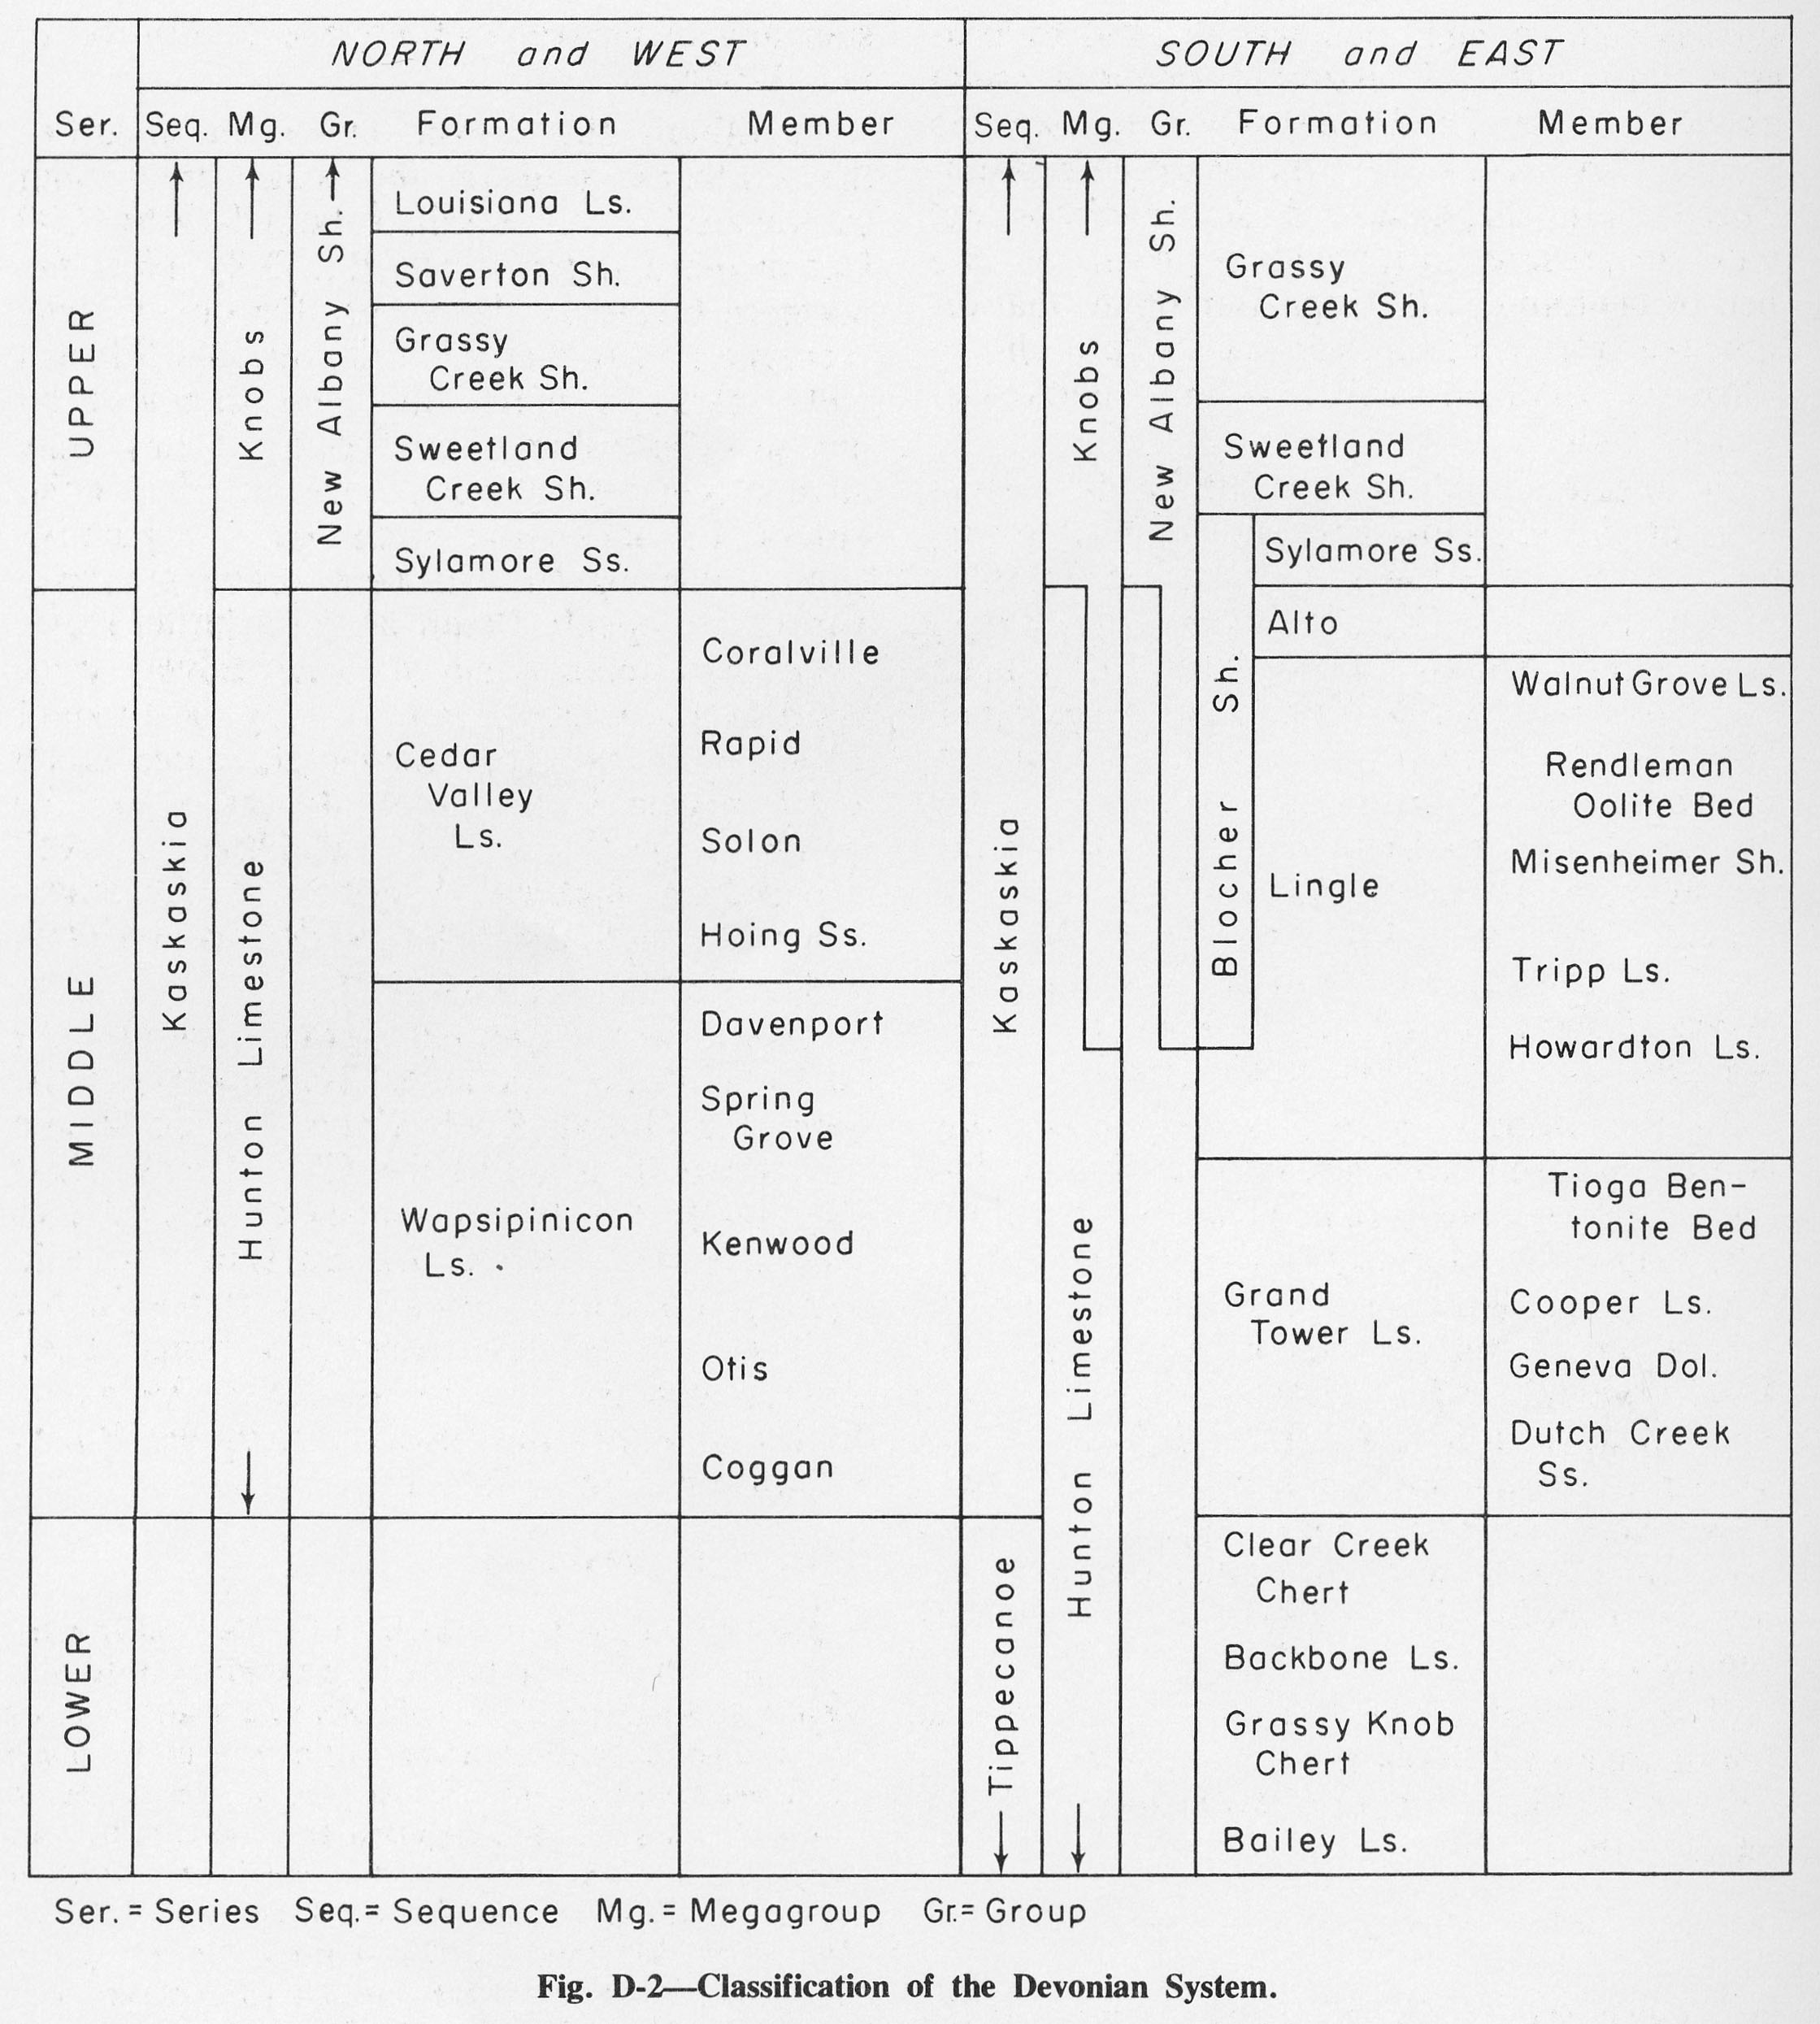
| 19:52, 1 April 2016 | Figure D-2.jpg (file) |  |
546 KB | Fig. D-2 -- Classification of the Devonian System. | 1 |
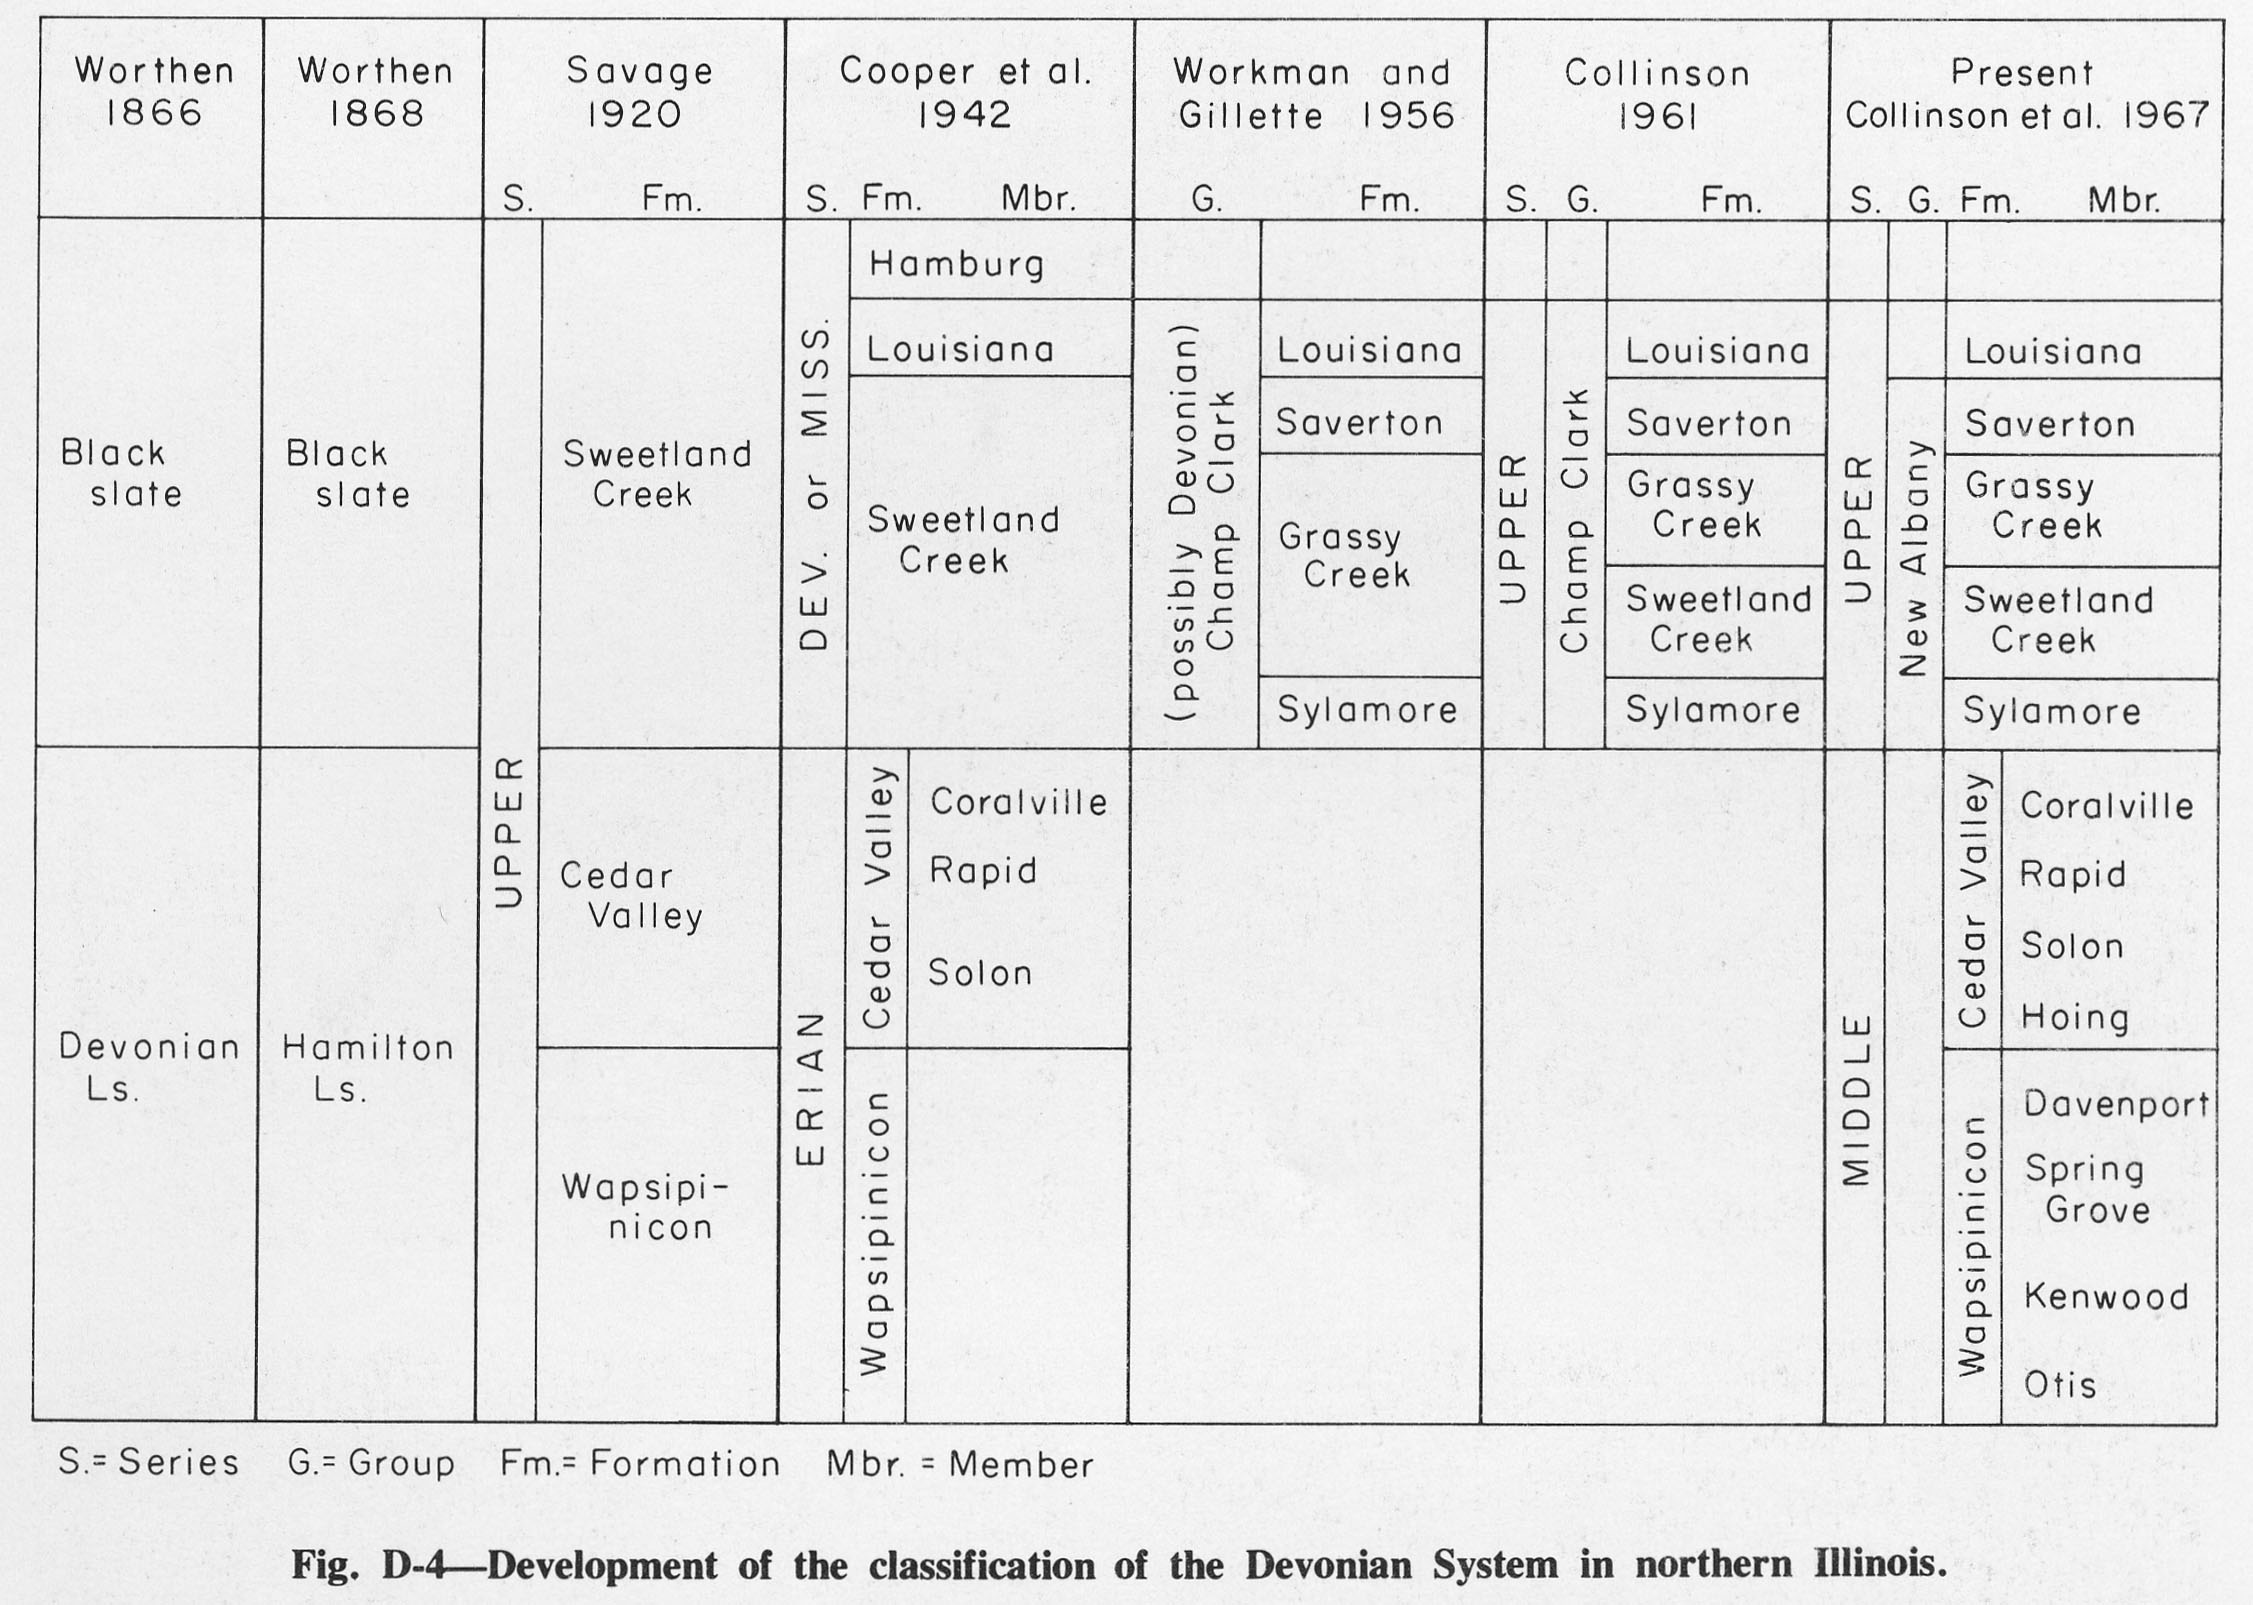
| 19:56, 1 April 2016 | Figure D-4.jpg (file) |  |
408 KB | Fig. D-4 -- Development of the classification of the Devonian System in northern Illinois. | 1 |
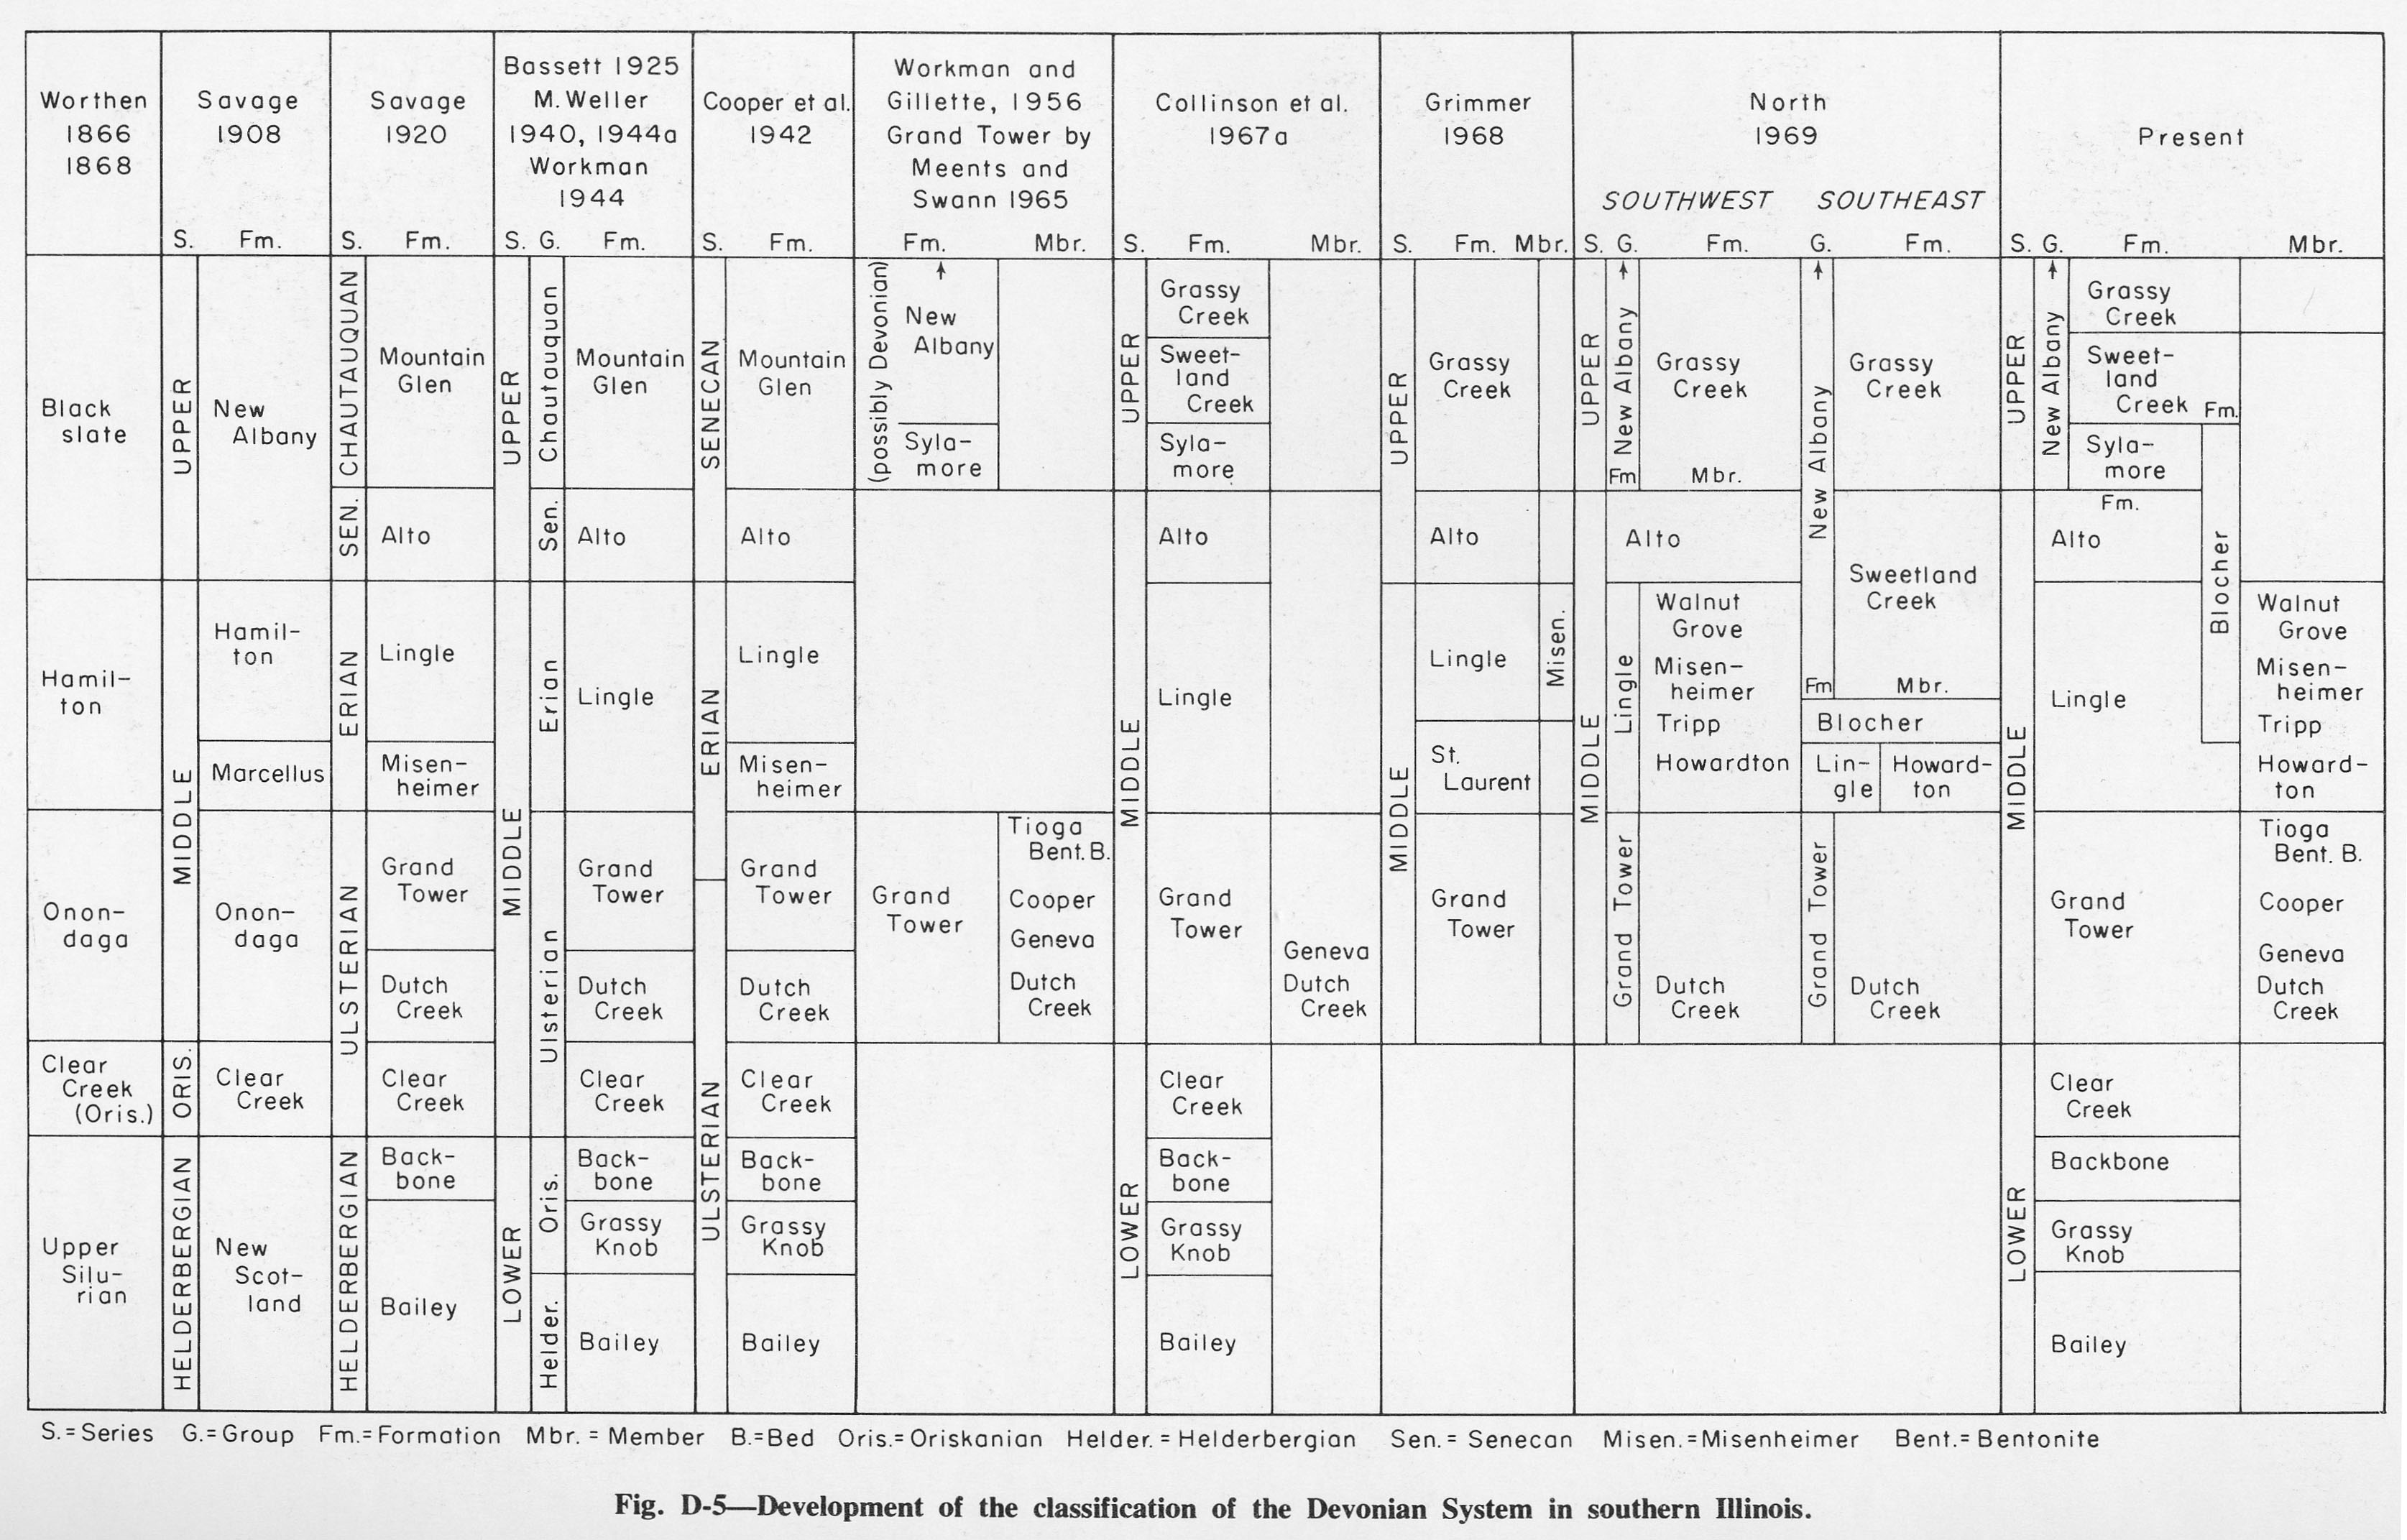
| 19:57, 1 April 2016 | Figure D-5.jpg (file) |  |
779 KB | Fig. D-5 -- Development of the classification of the Devonian System in southern Illinois. | 1 |
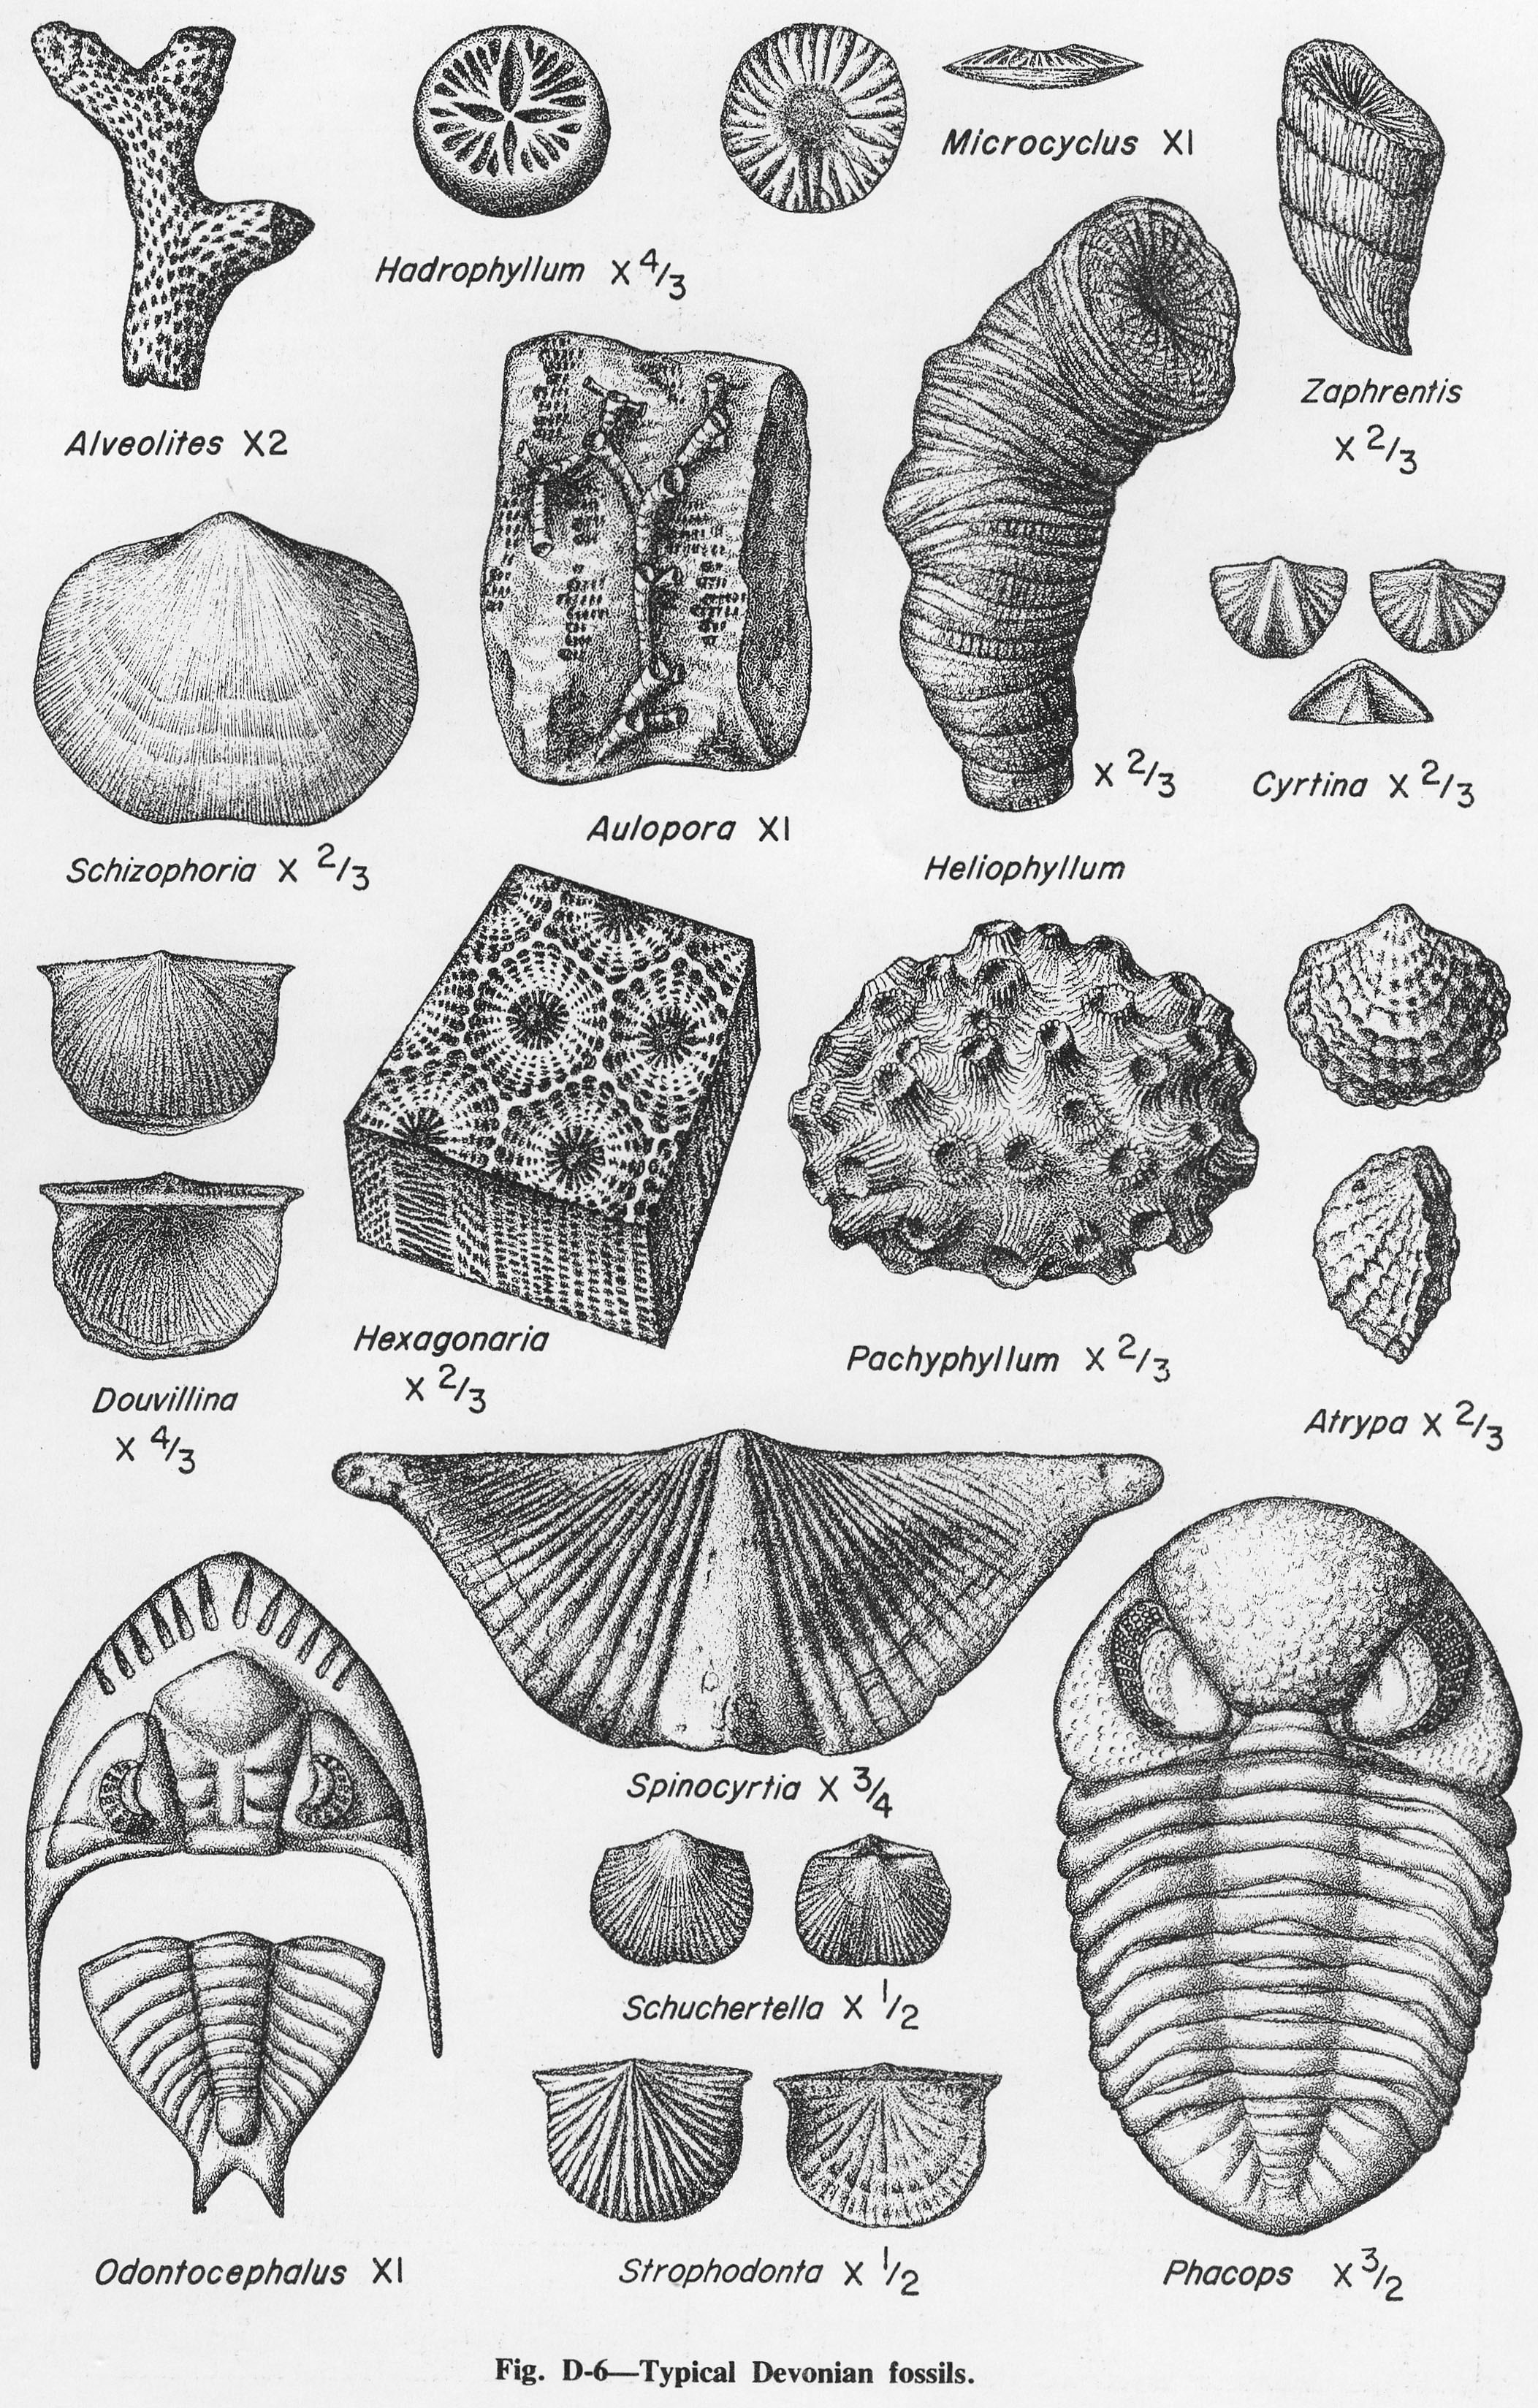
| 19:58, 1 April 2016 | Figure D-6.jpg (file) |  |
1.56 MB | Fig. D-6 -- Typical Devonian fossils. | 1 |
| 19:59, 1 April 2016 | Figure D-7.jpg (file) |  |
525 KB | Fig. D-7 -- Geologic map of the sub-Kaskaskia surface. | 1 |
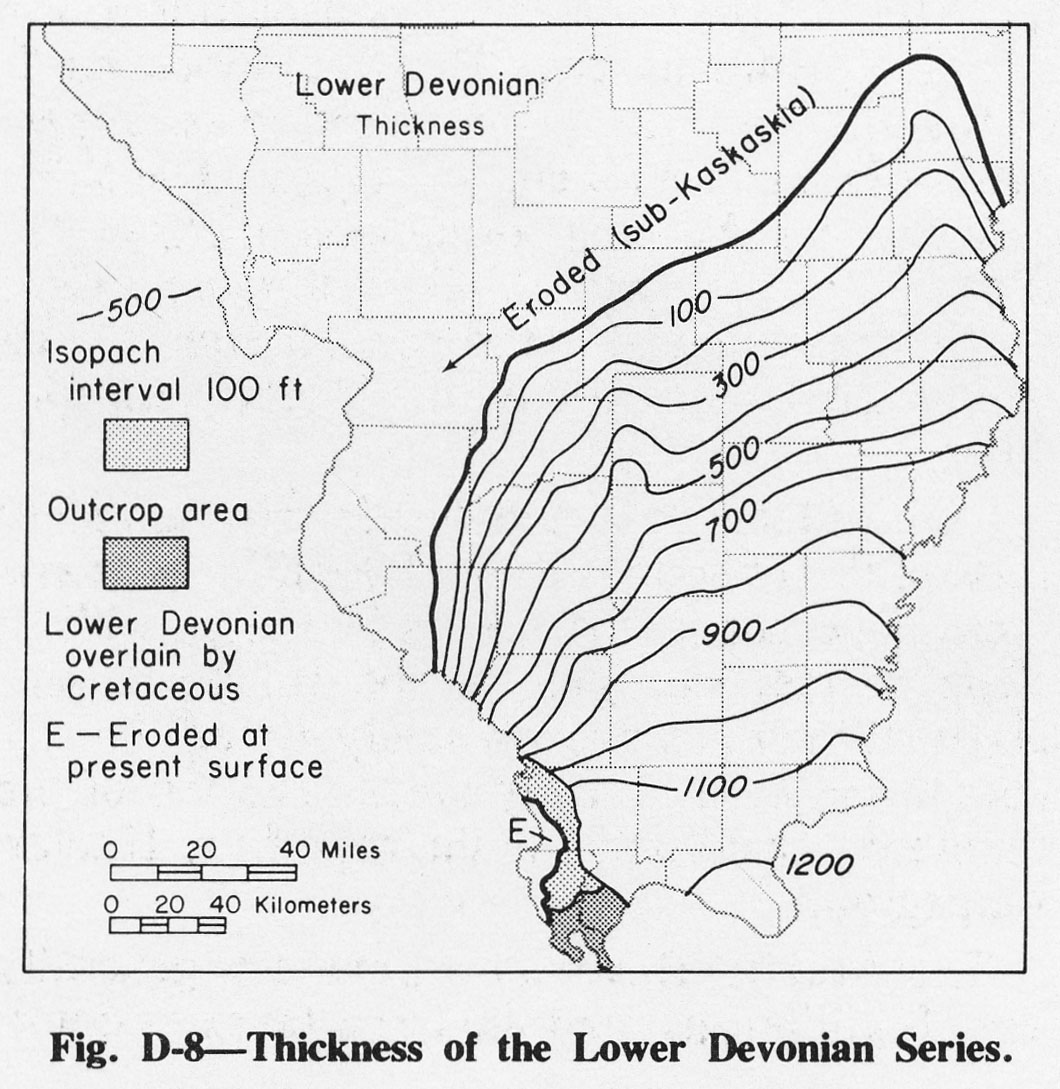
| 20:00, 1 April 2016 | Figure D-8.jpg (file) |  |
245 KB | Fig. D-8 -- Thickness of the Lower Devonian Series. | 1 |
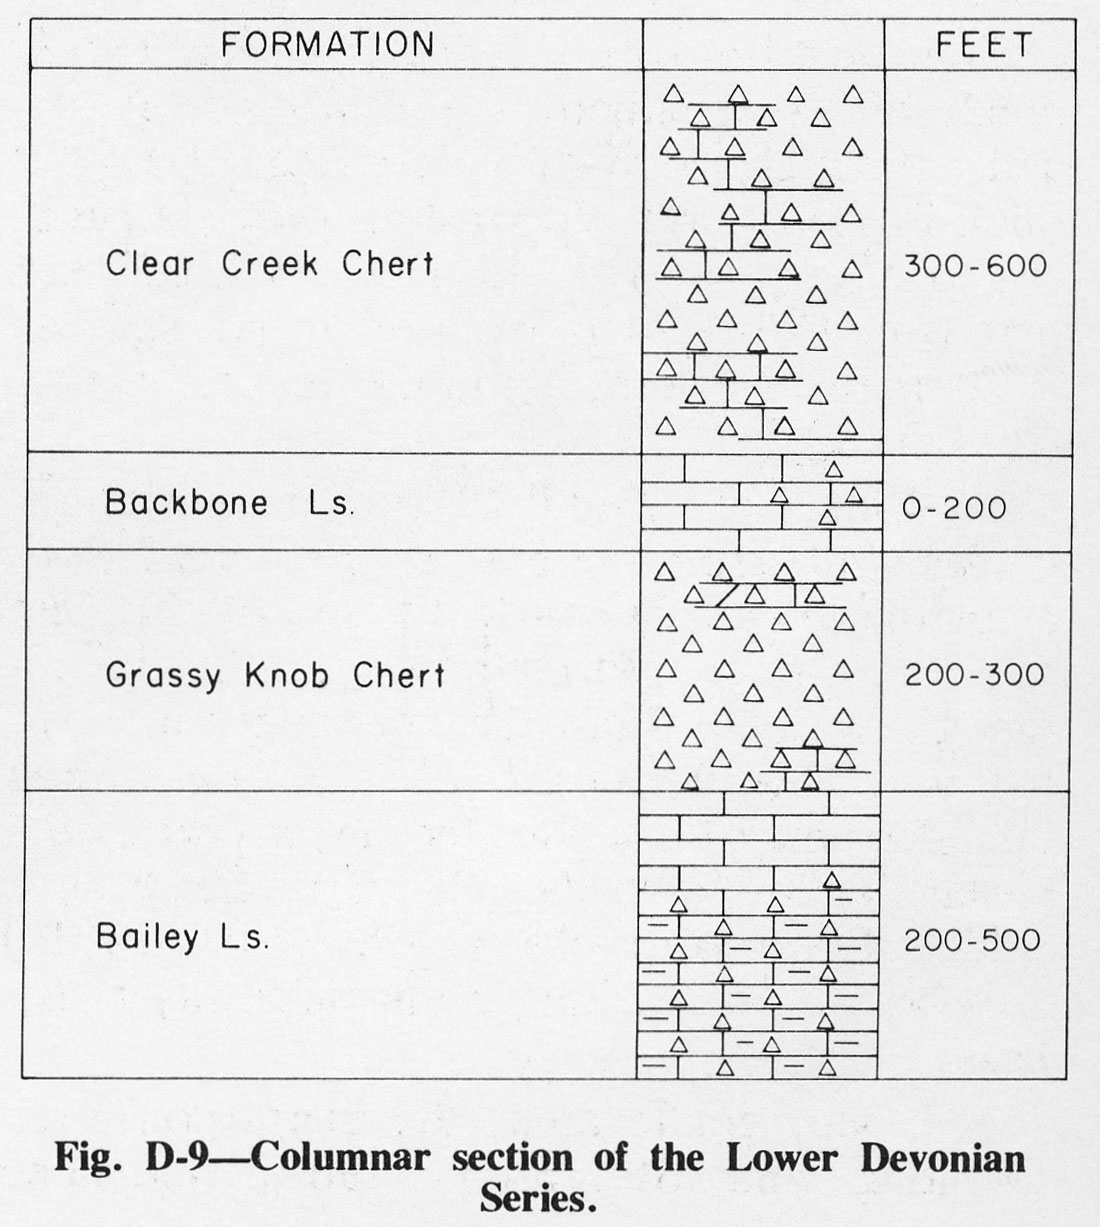
| 20:03, 1 April 2016 | Figure D-9.jpg (file) |  |
211 KB | Fig. D-9 -- Columnar section of the Lower Devonian Series. | 1 |
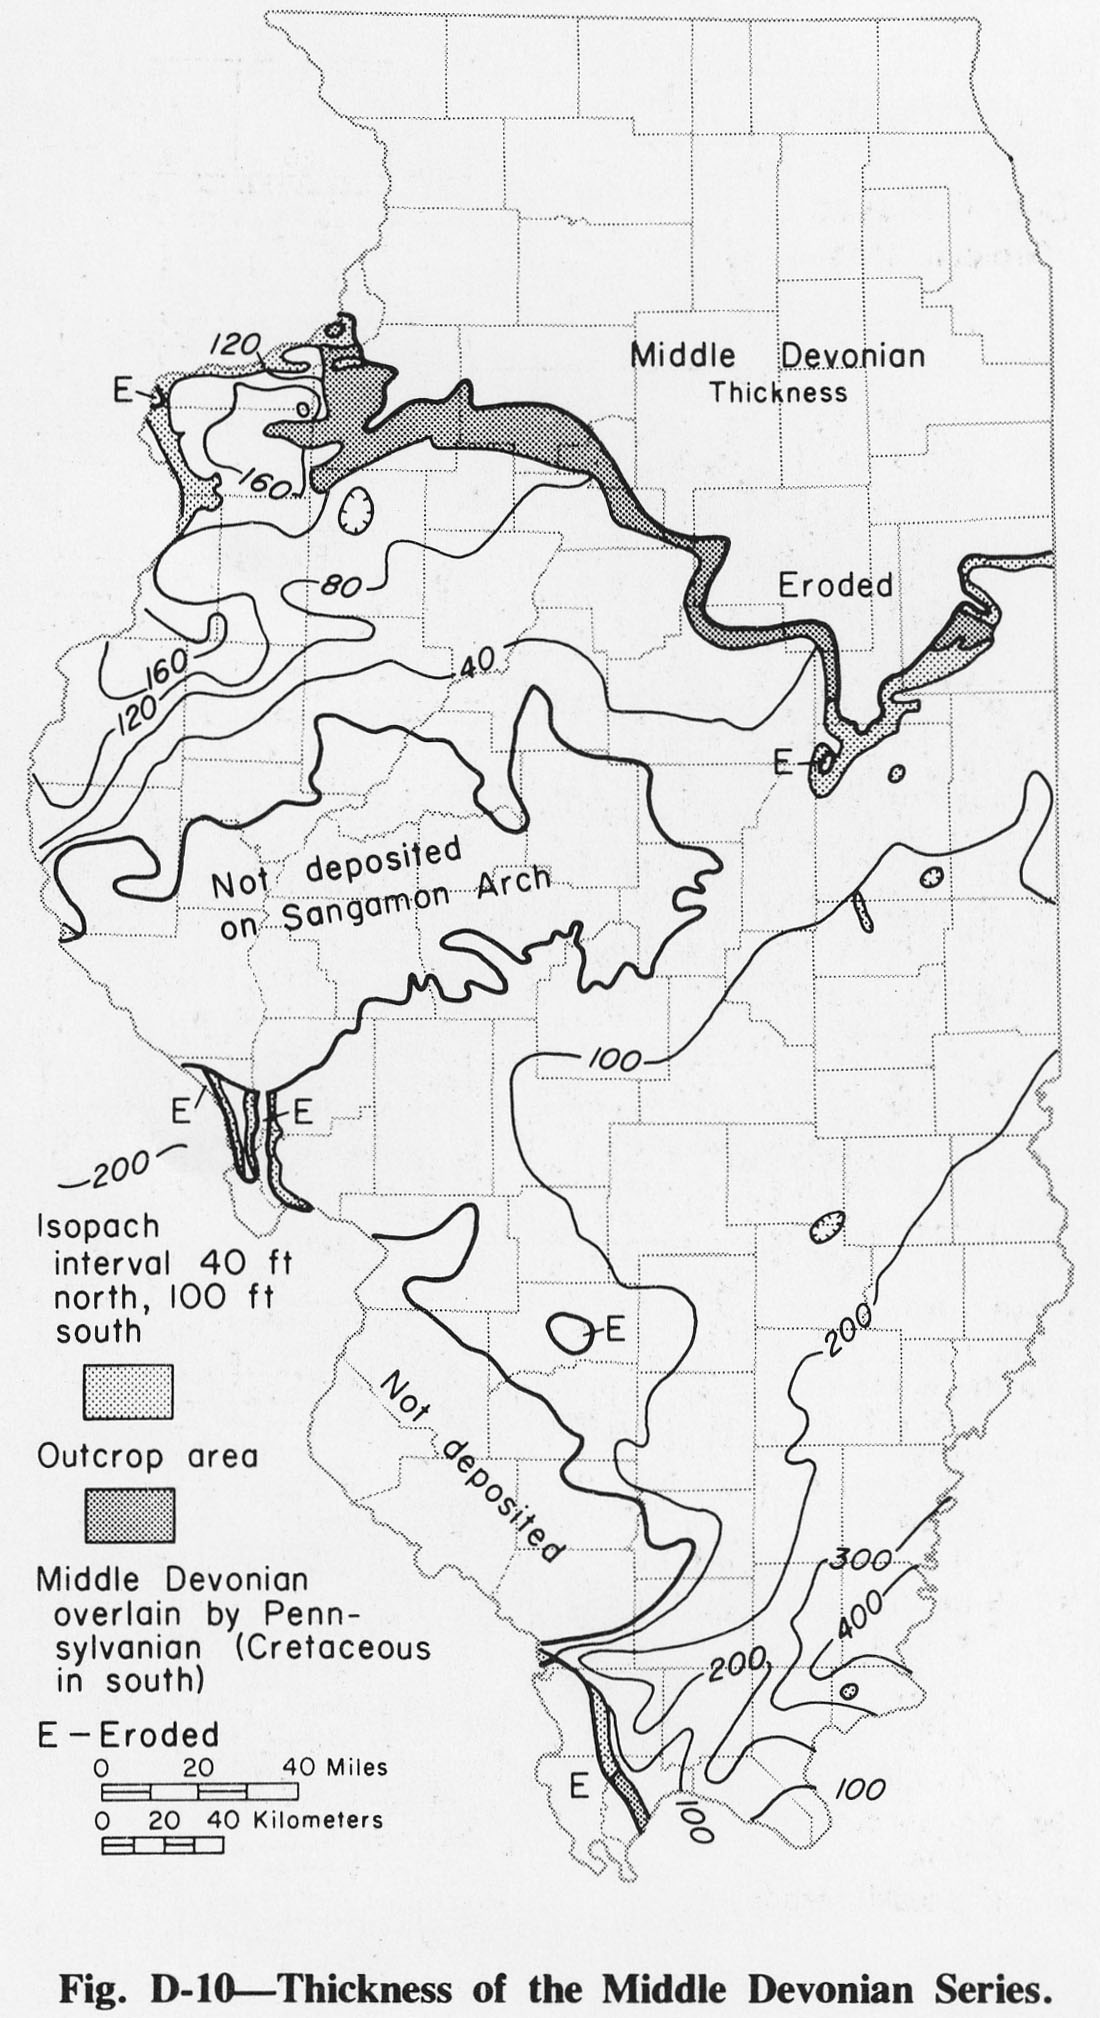
| 20:04, 1 April 2016 | Figure D-10.jpg (file) |  |
318 KB | Fig. D-10 -- Thickness of the Middle Devonian Series. | 1 |
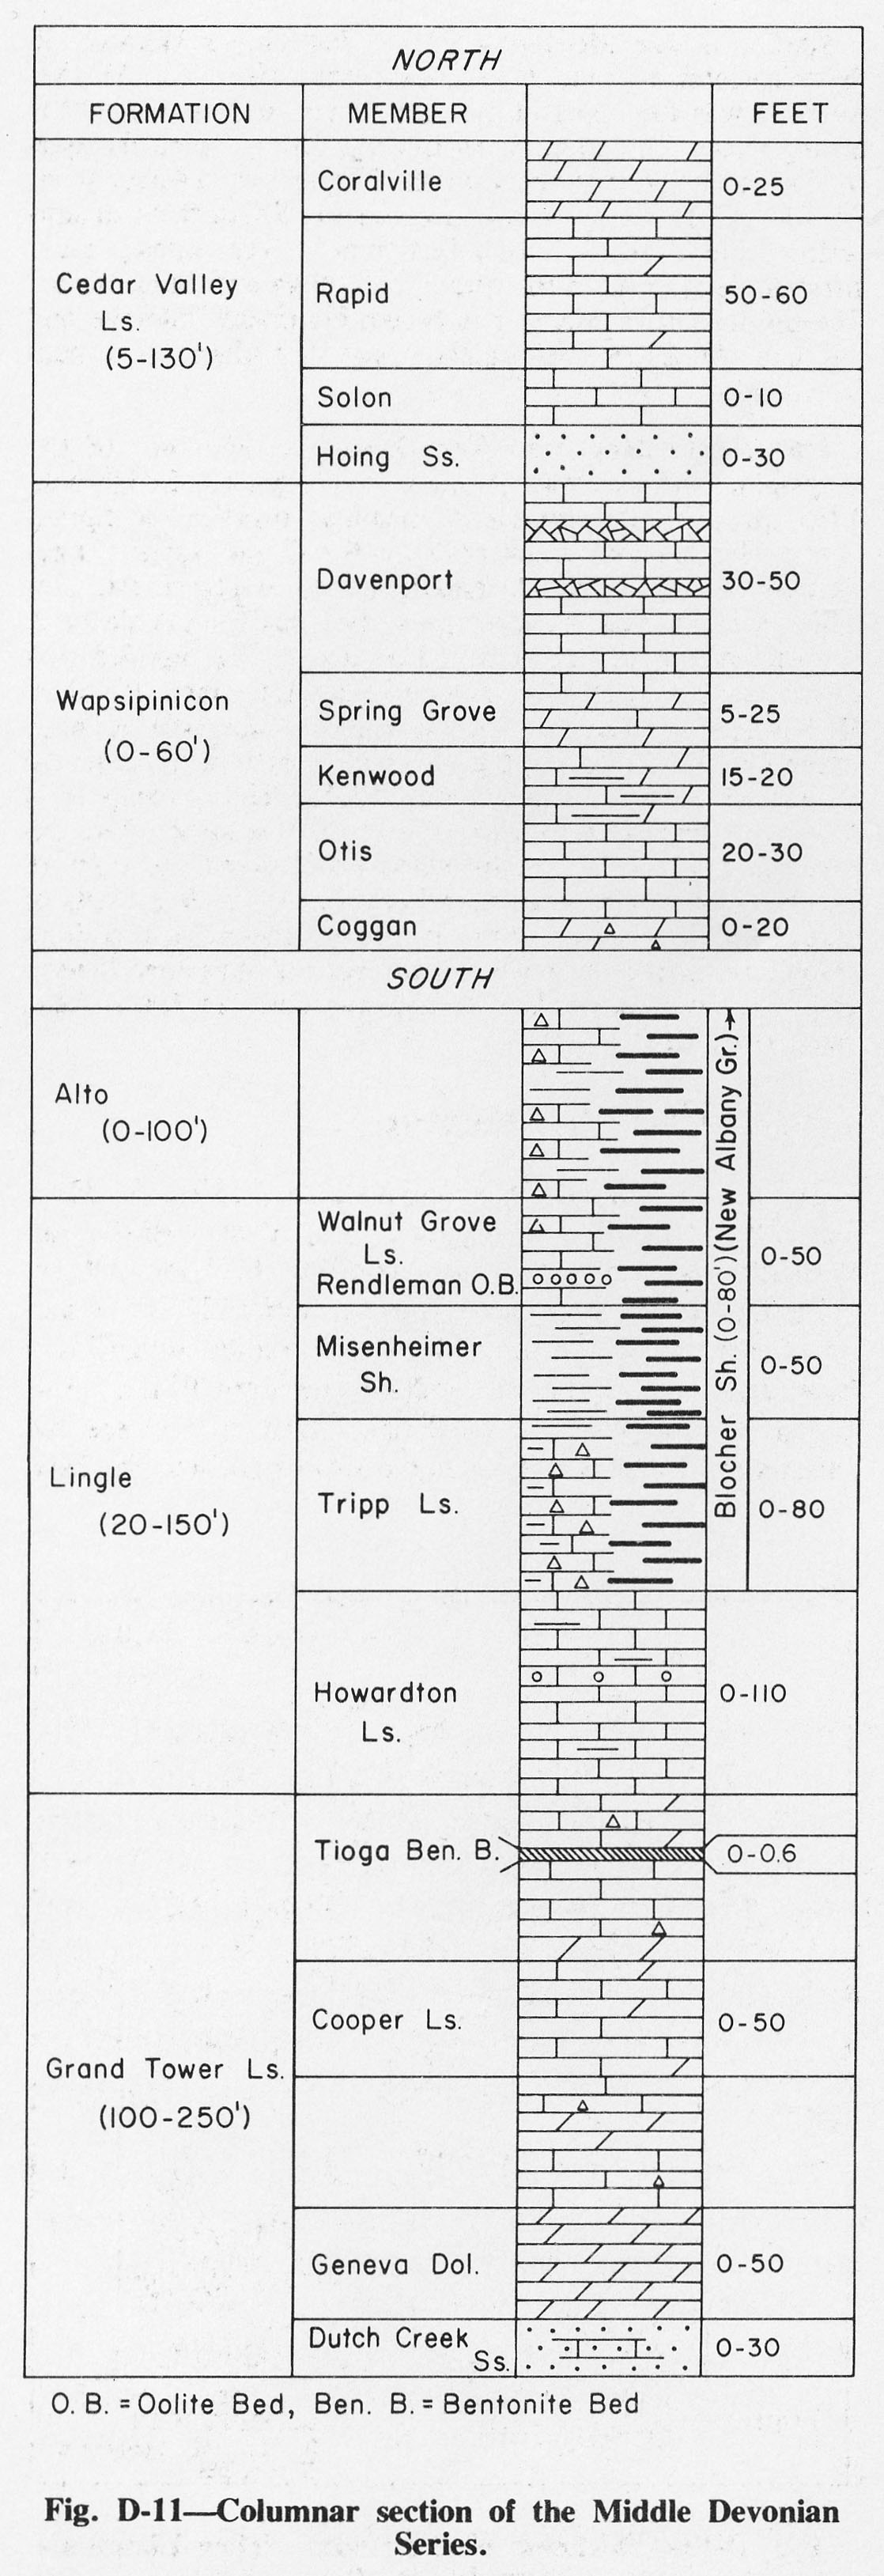
| 20:05, 1 April 2016 | Figure D-11.jpg (file) |  |
428 KB | Fig. D-11 -- Columnar section of the Middle Devonian Series. | 1 |
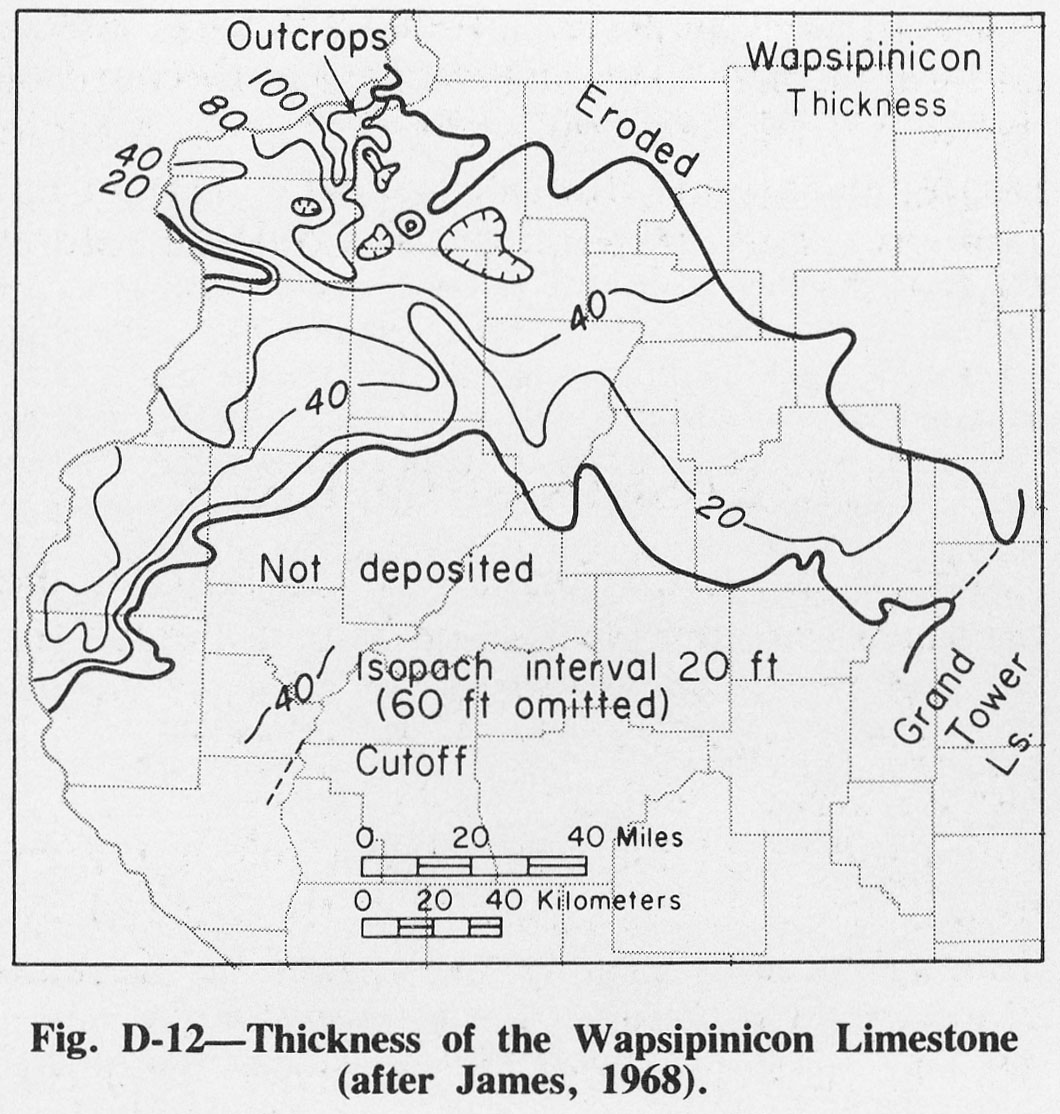
| 20:07, 1 April 2016 | Figure D-12.jpg (file) |  |
249 KB | Fig. D-12 -- Thickness of the Wapsipinicon Limestone (after James, 1968). | 1 |
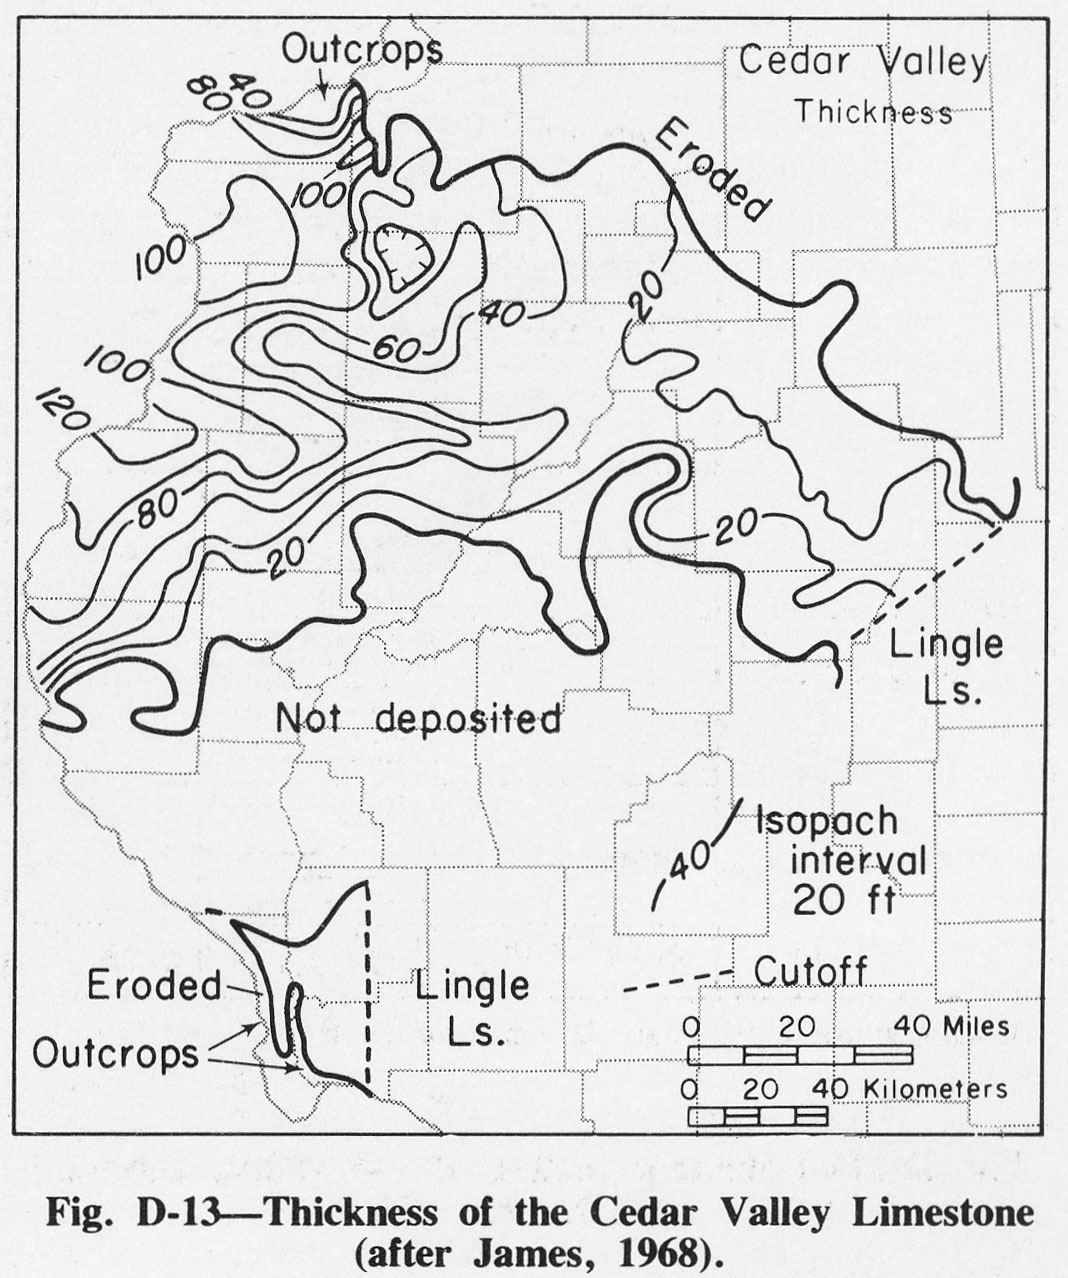
| 20:08, 1 April 2016 | Figure D-13.jpg (file) |  |
291 KB | Fig. D-13 -- Thickness of the Cedar Valley Limestone (after James, 1968). | 1 |
| 20:09, 1 April 2016 | Figure D-14.jpg (file) |  |
232 KB | Fig. D-14 -- Thickness of the Grand Tower Limestone (after North, 1969). | 1 |