Uploads by Illex-gron
Jump to navigation
Jump to search
This special page shows all uploaded files.
| Date | Name | Thumbnail | Size | Description | Versions |
|---|---|---|---|---|---|
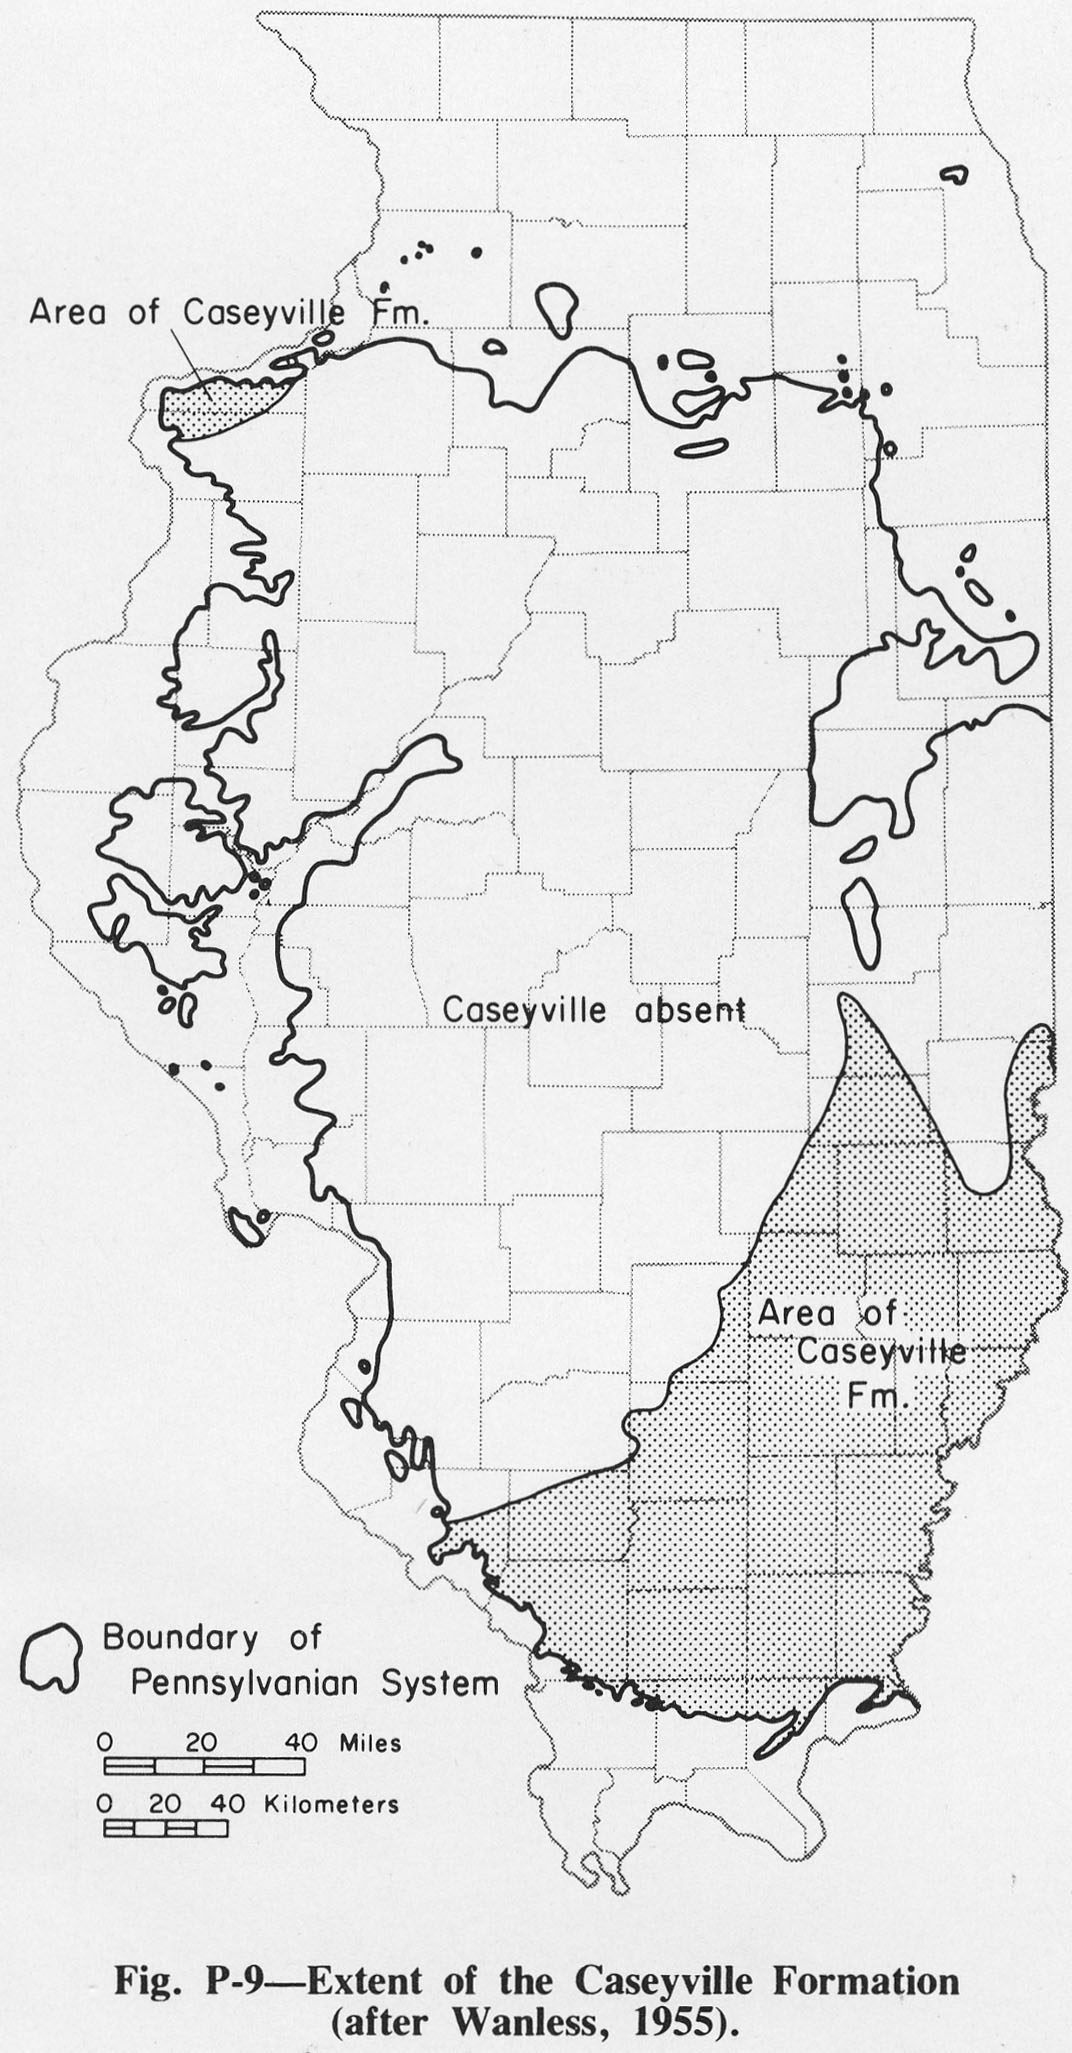
| 14:55, 1 April 2016 | Figure P-9.jpg (file) |  |
334 KB | Fig. P-4 -- Extent of the Caseyville Formation (after Wanless, 1955). | 1 |
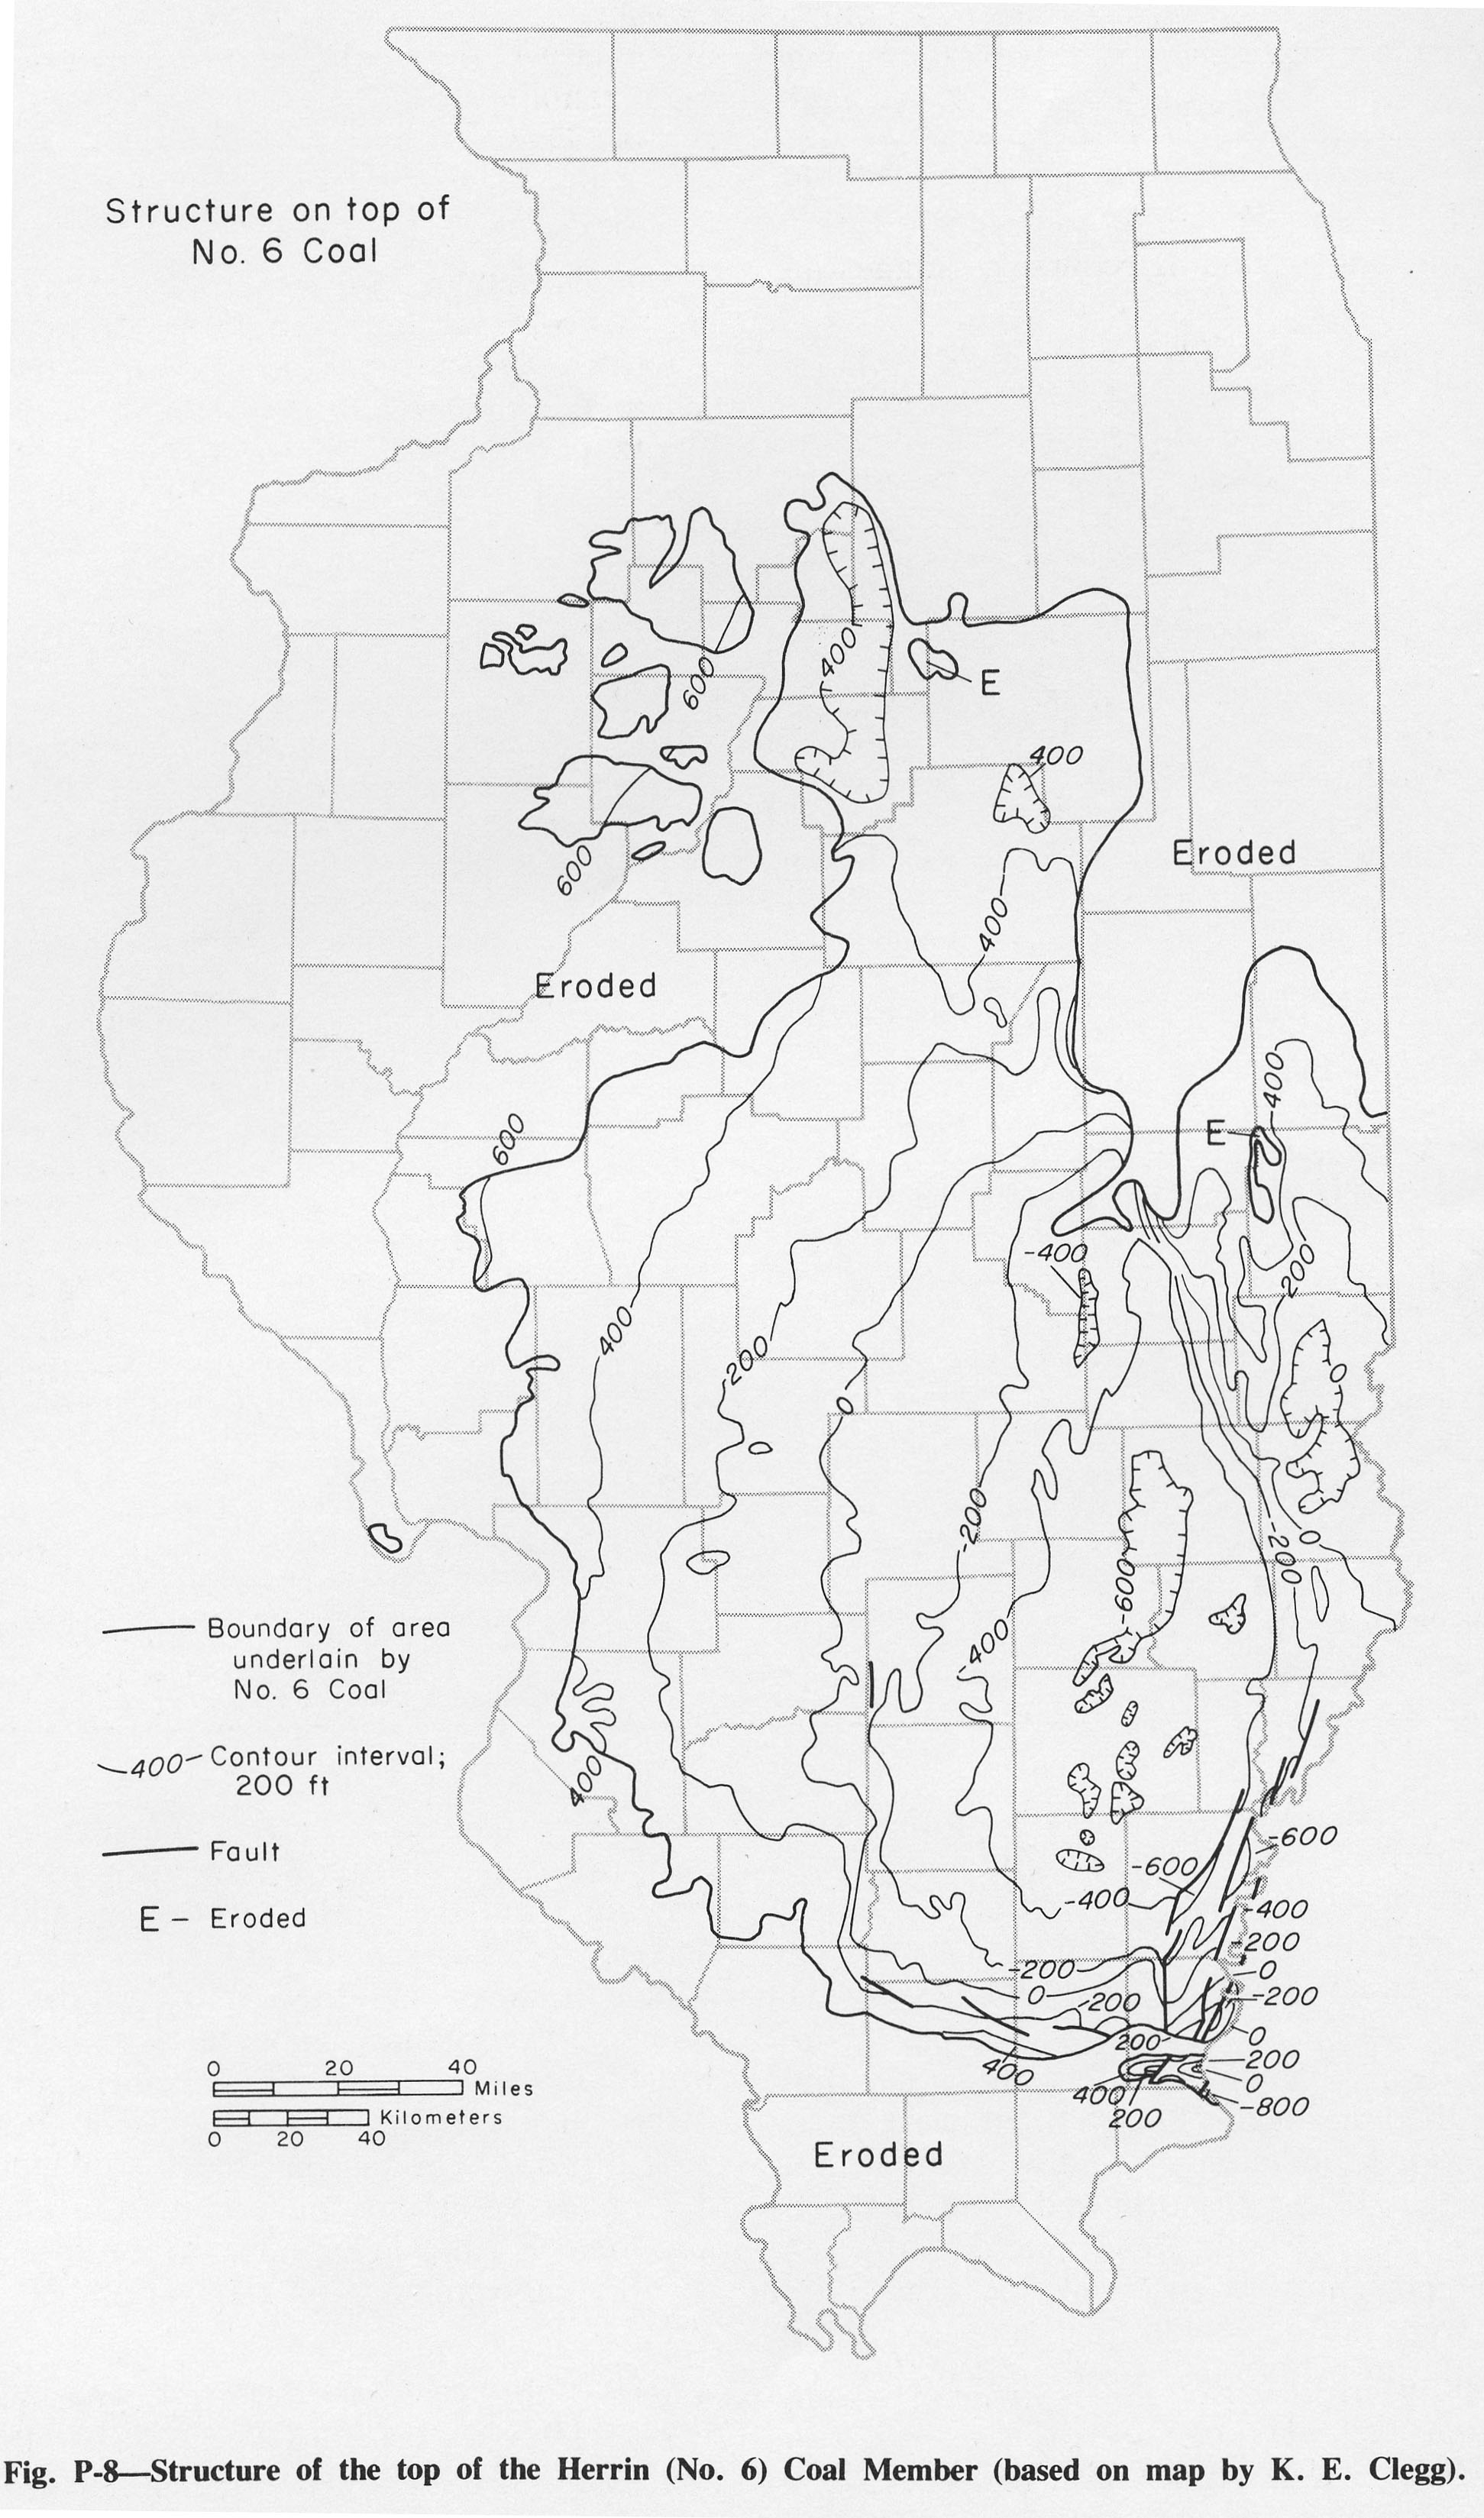
| 15:36, 1 April 2016 | Figure P-8.jpg (file) |  |
714 KB | Fig. P-8 -- Structure of the top of the Herrin (No. 6) Coal Member (based on map by K. E. Clegg). | 1 |
| 15:31, 1 April 2016 | Figure P-7.jpg (file) |  |
276 KB | Fig. P-7 -- Arrangement of lithologic units in a cyclothem (after Willman and Payne, 1942). | 1 |
| 14:50, 1 April 2016 | Figure P-3A.jpg (file) |  |
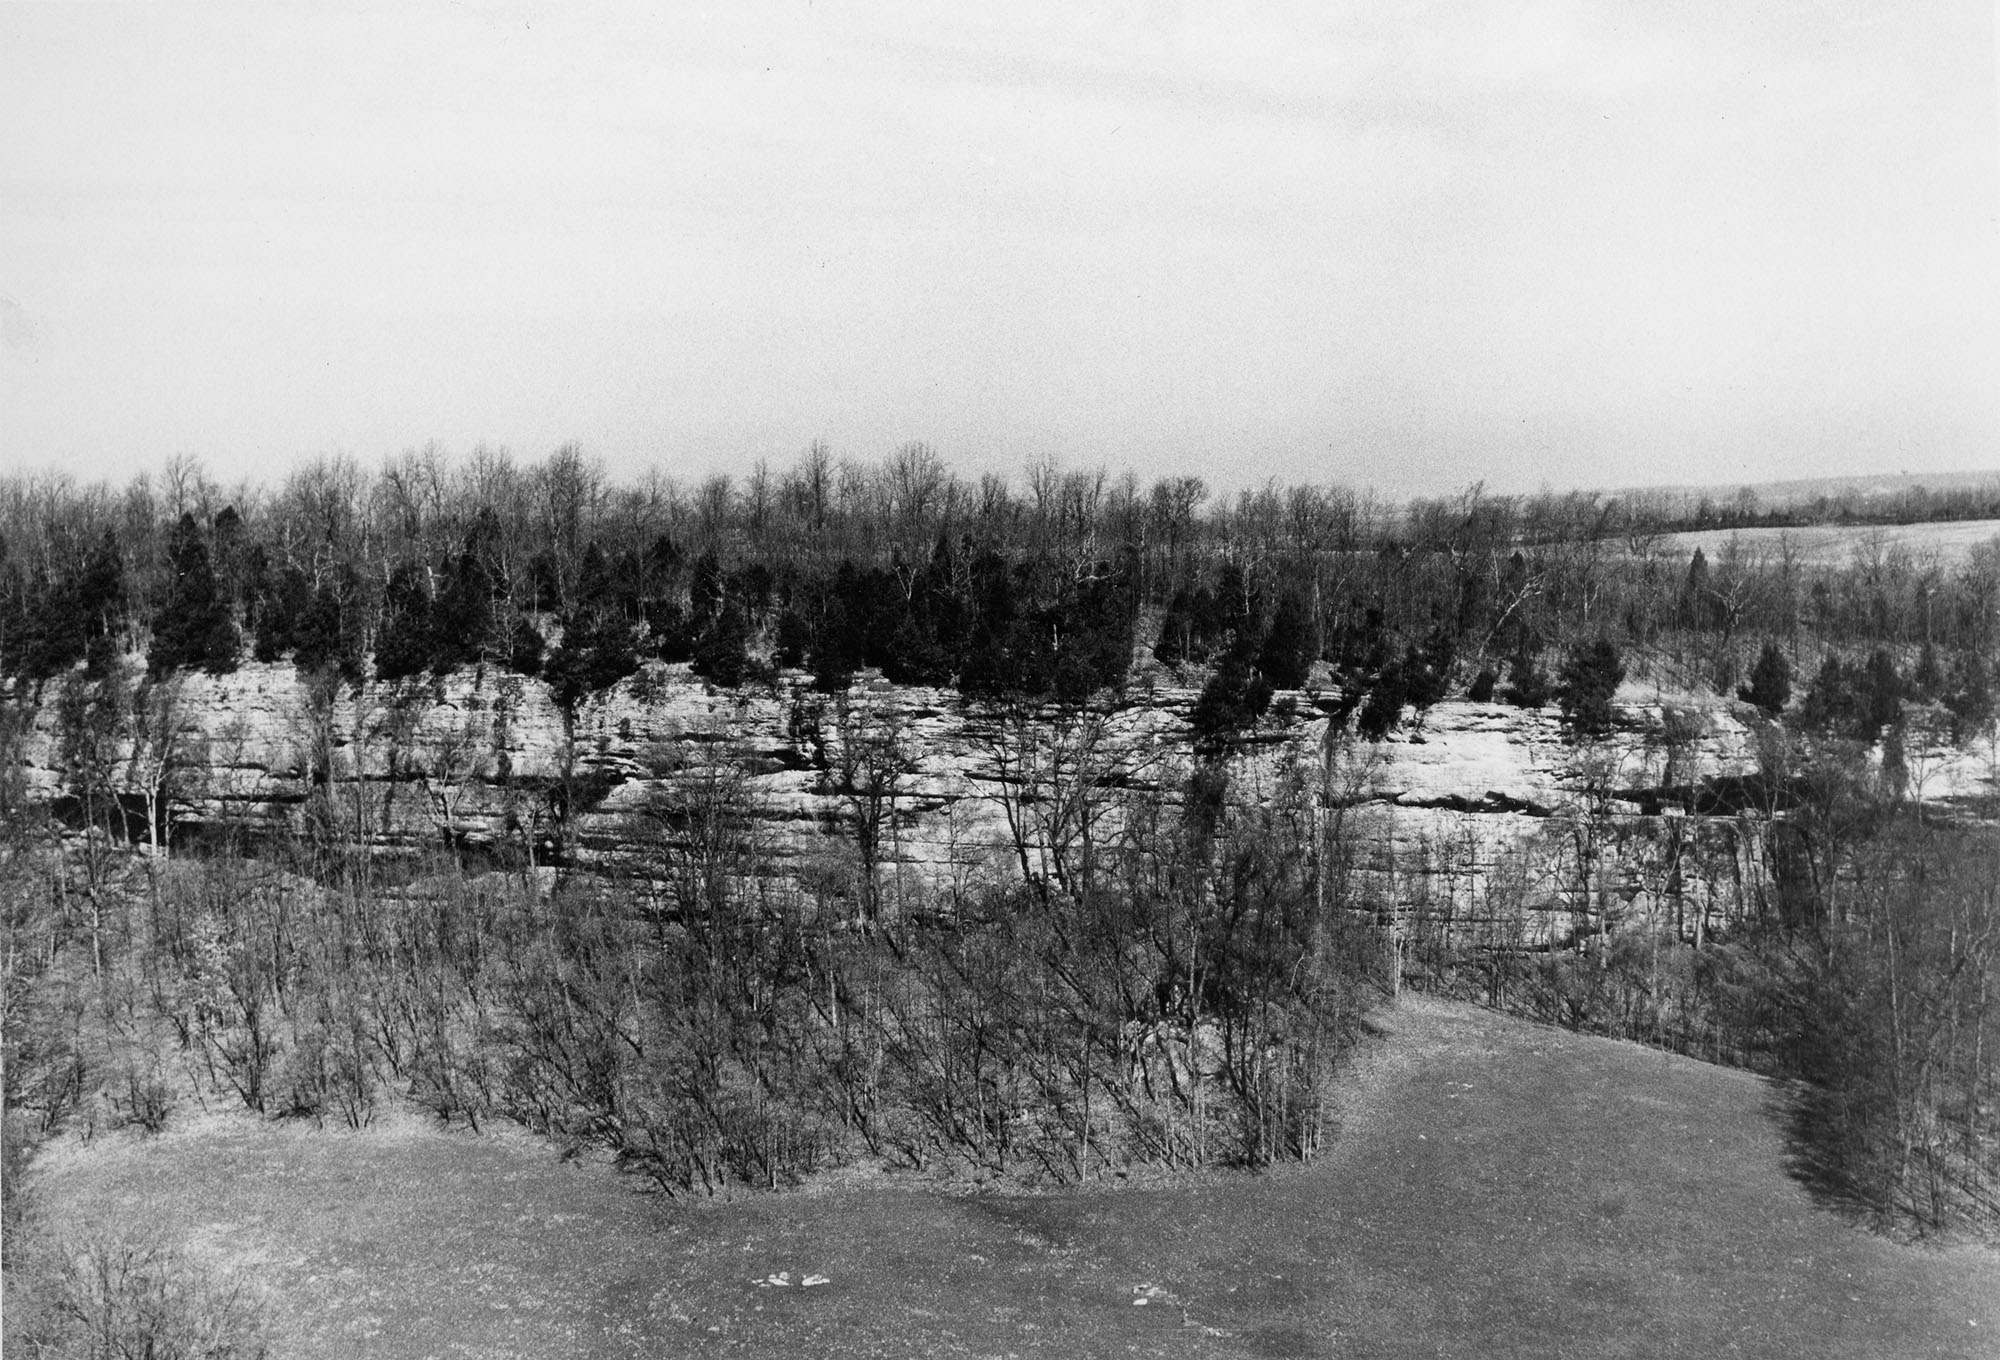
566 KB | Fig. P-3A -- Battery Rock Sandstone Member of the Caseyville Formation capping an escarpment 8 miles north of Cave in Rock, Hardin County. | 2 |
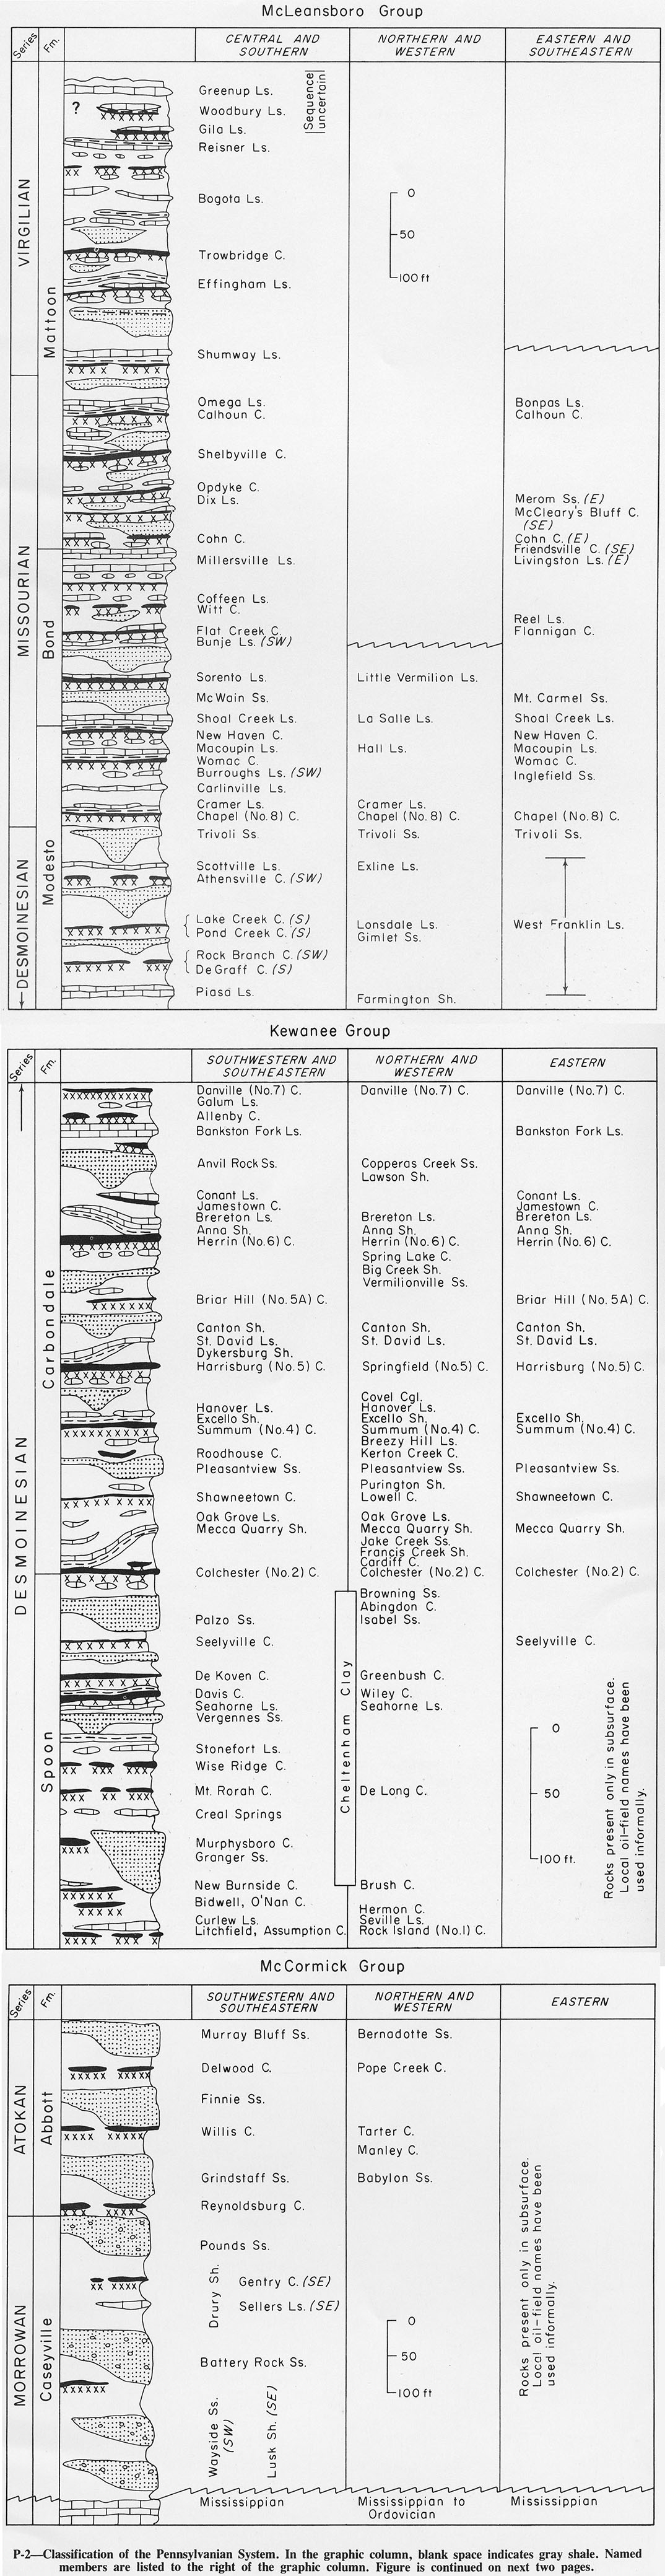
| 15:09, 1 April 2016 | Figure P-2.jpg (file) |  |
765 KB | Reverted to version as of 14:45, 5 August 2015 | 3 |
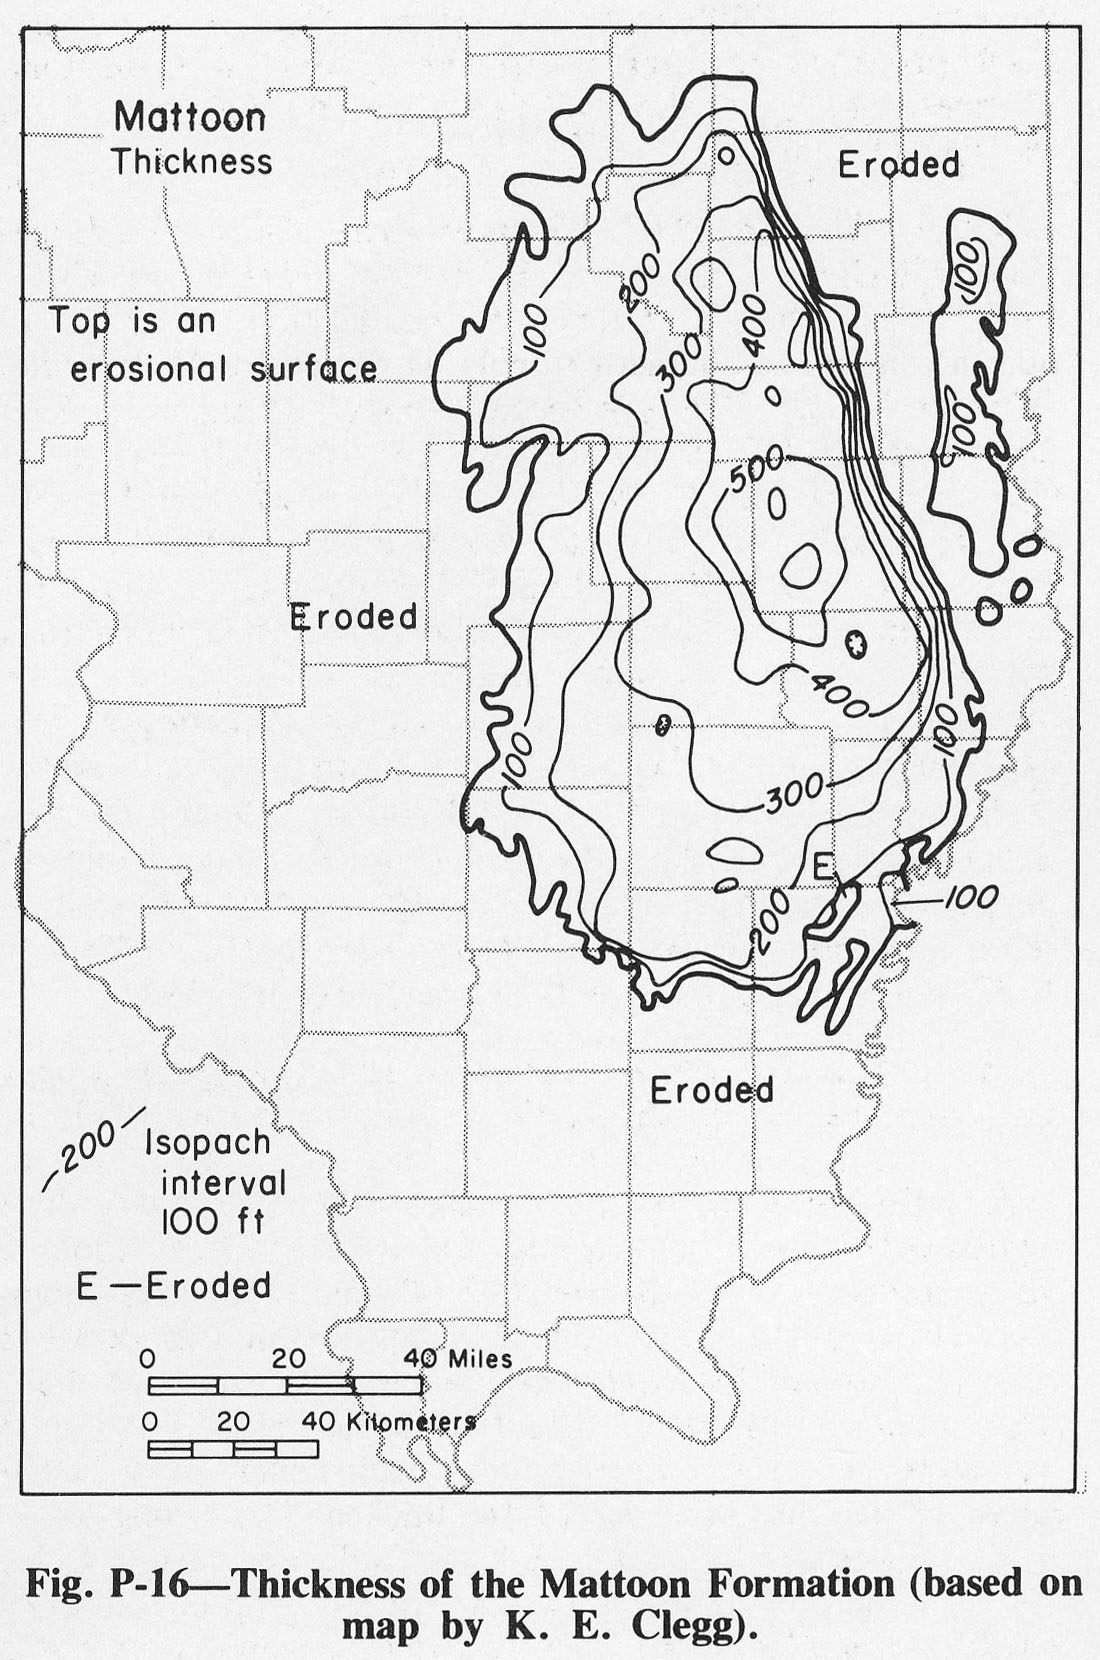
| 15:42, 1 April 2016 | Figure P-16.jpg (file) |  |
320 KB | Fig. P-16 -- Thickness of the Mattoon Formation (based on map by K. E. Clegg). | 1 |
| 15:41, 1 April 2016 | Figure P-15.jpg (file) |  |
457 KB | Fig. P-15 -- Thickness of the Bond Formation (based on map by K. E. Clegg). | 1 |
| 15:39, 1 April 2016 | Figure P-14.jpg (file) |  |
535 KB | Fig. P-14 -- Thickness of the Modesto Formation (based on map by K. E. Clegg). | 1 |
| 15:38, 1 April 2016 | Figure P-10.jpg (file) |  |
507 KB | Fig. P-10 -- Combined thickness of the Caseyville, Abbott, and Spoon Formations (after Walness, 1955) | 1 |
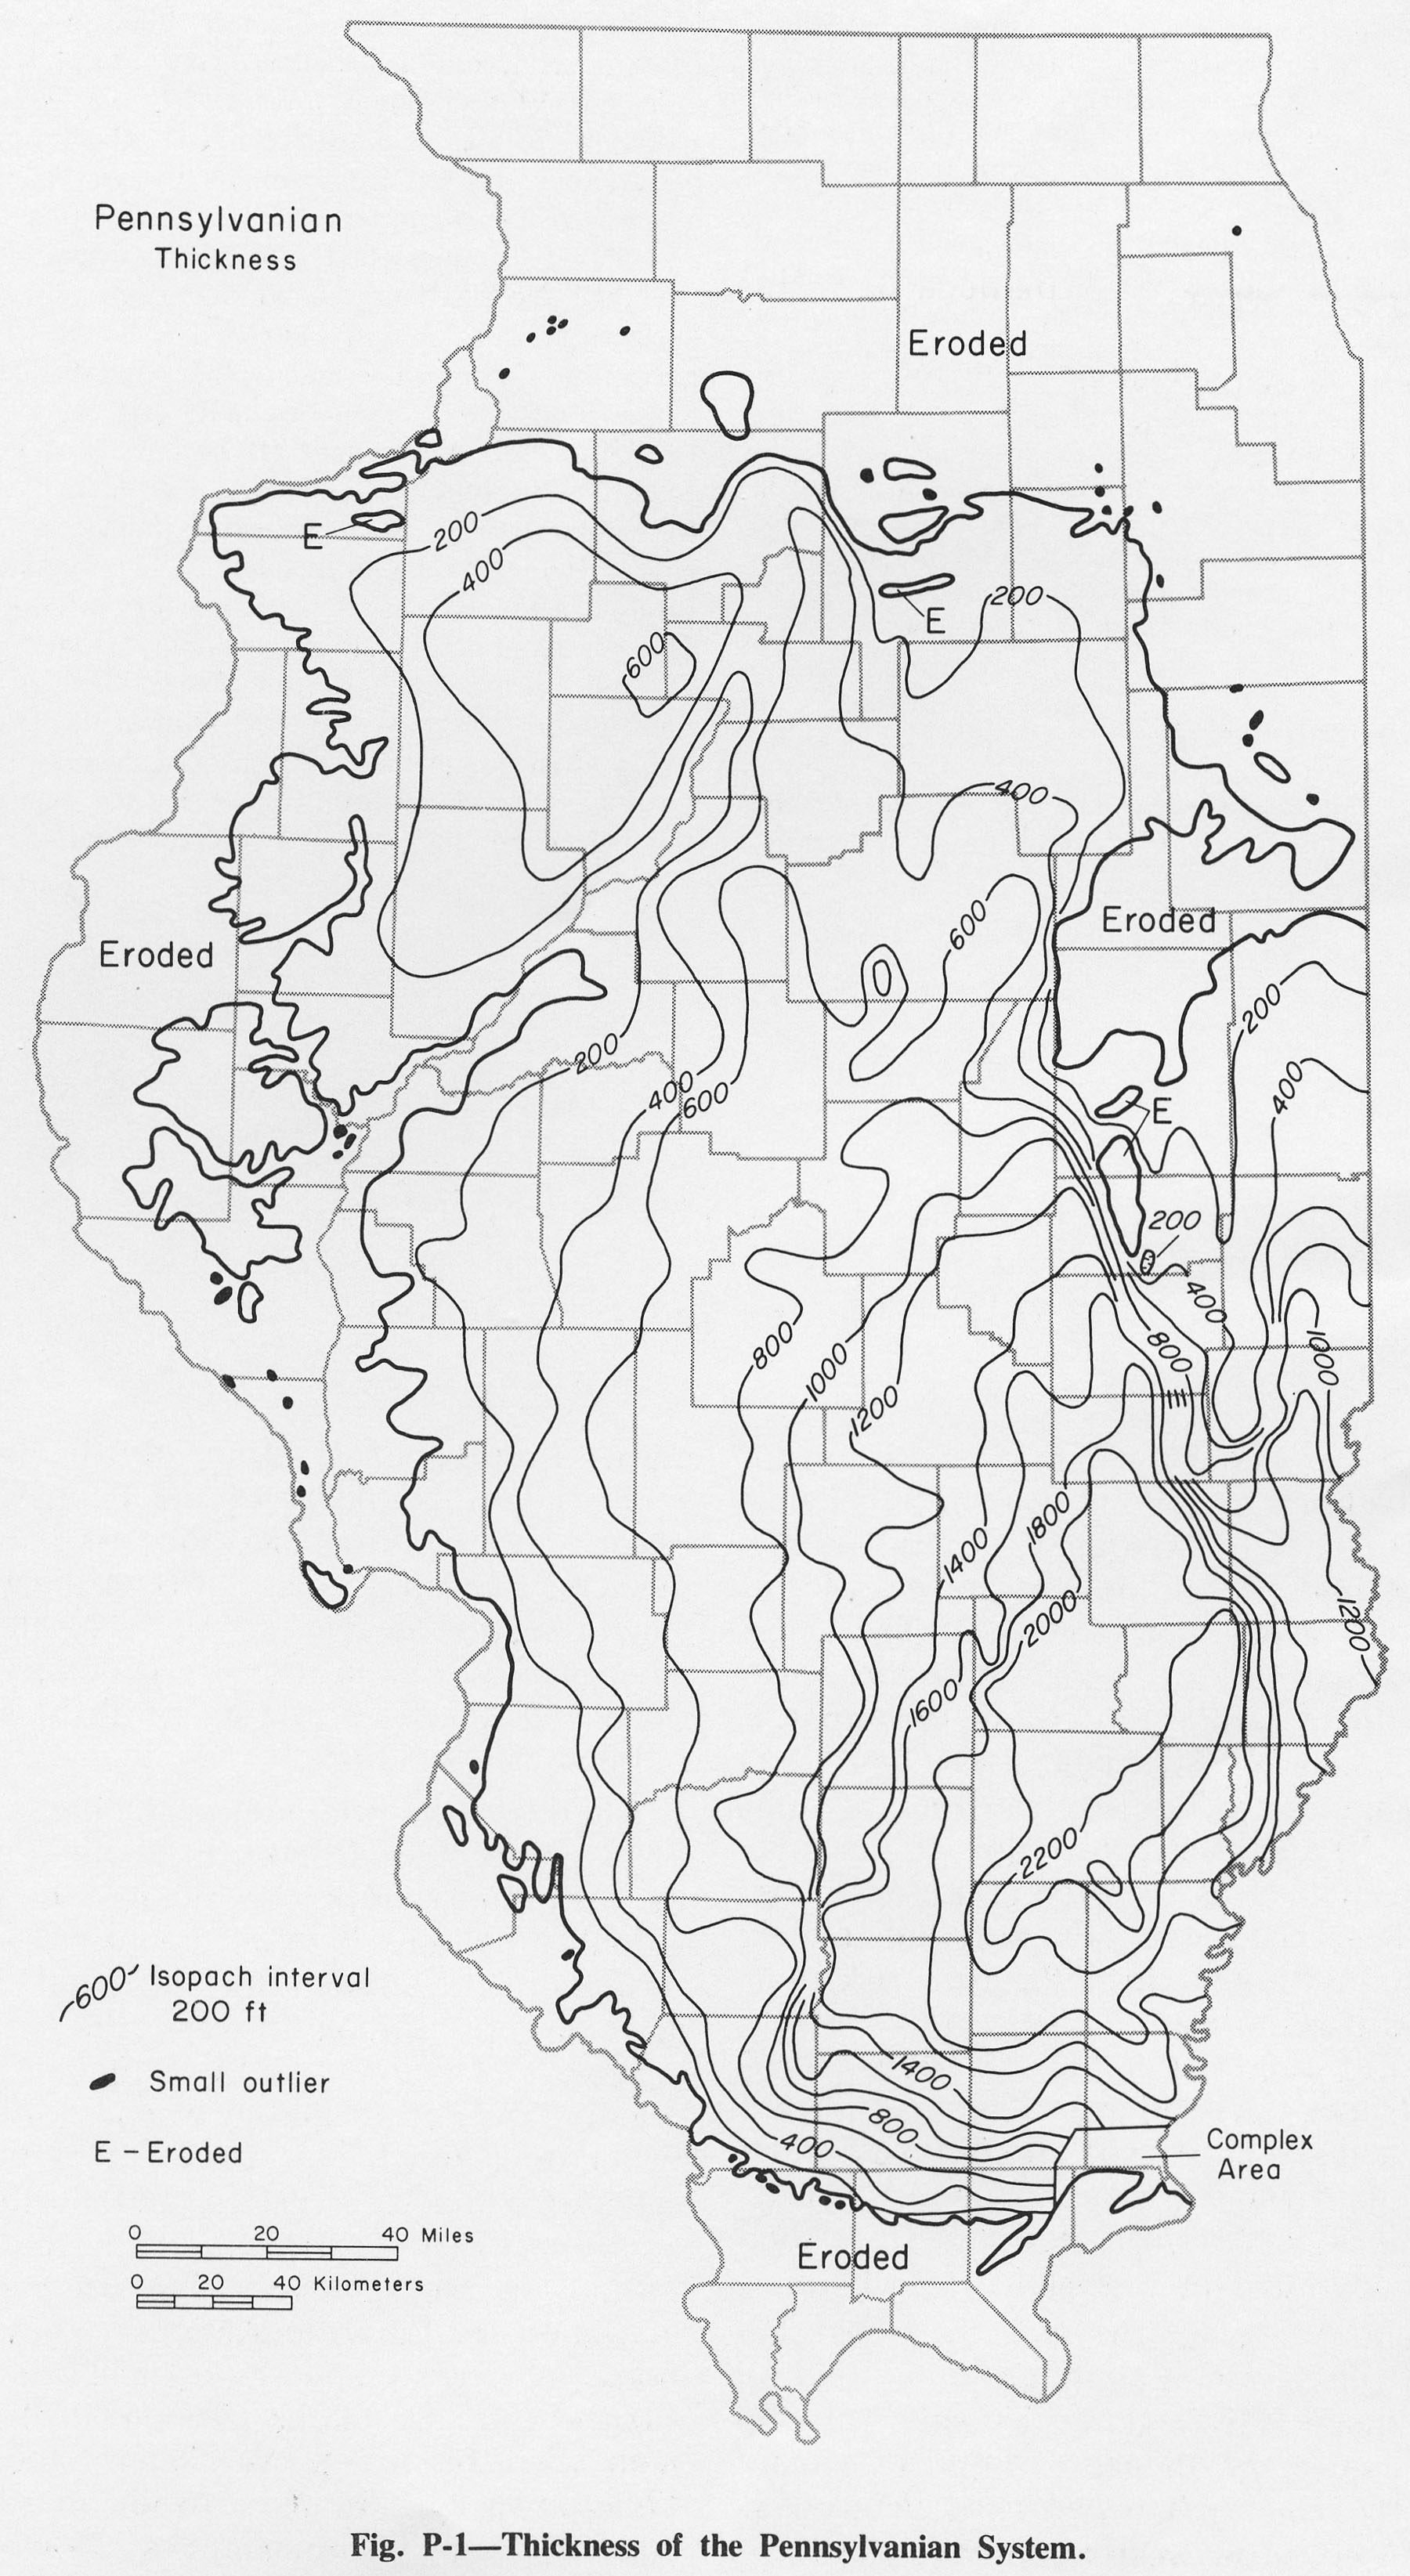
| 15:27, 1 April 2016 | Figure P-1.jpg (file) |  |
753 KB | Fig. P-1 -- Thickness of the Pennsylvanian System. | 1 |
| 14:29, 1 April 2016 | Figure 12.jpg (file) |  |
808 KB | Fig. 12 -- Principal geologic structures of Illinois. | 1 |
| 17:27, 18 April 2016 | 94-tb 7-g.jpg (file) |  |
525 KB | 1 | |
| 17:27, 18 April 2016 | 94-tb 7-f.jpg (file) |  |
678 KB | 1 | |
| 17:26, 18 April 2016 | 94-tb 7-e.jpg (file) |  |
657 KB | 1 | |
| 17:25, 18 April 2016 | 94-tb 7-d.jpg (file) |  |
671 KB | 1 | |
| 17:25, 18 April 2016 | 94-tb 7-c.jpg (file) |  |
663 KB | 1 | |
| 17:24, 18 April 2016 | 94-tb 7-b.jpg (file) |  |
666 KB | 1 | |
| 17:24, 18 April 2016 | 94-tb 7-a.jpg (file) |  |
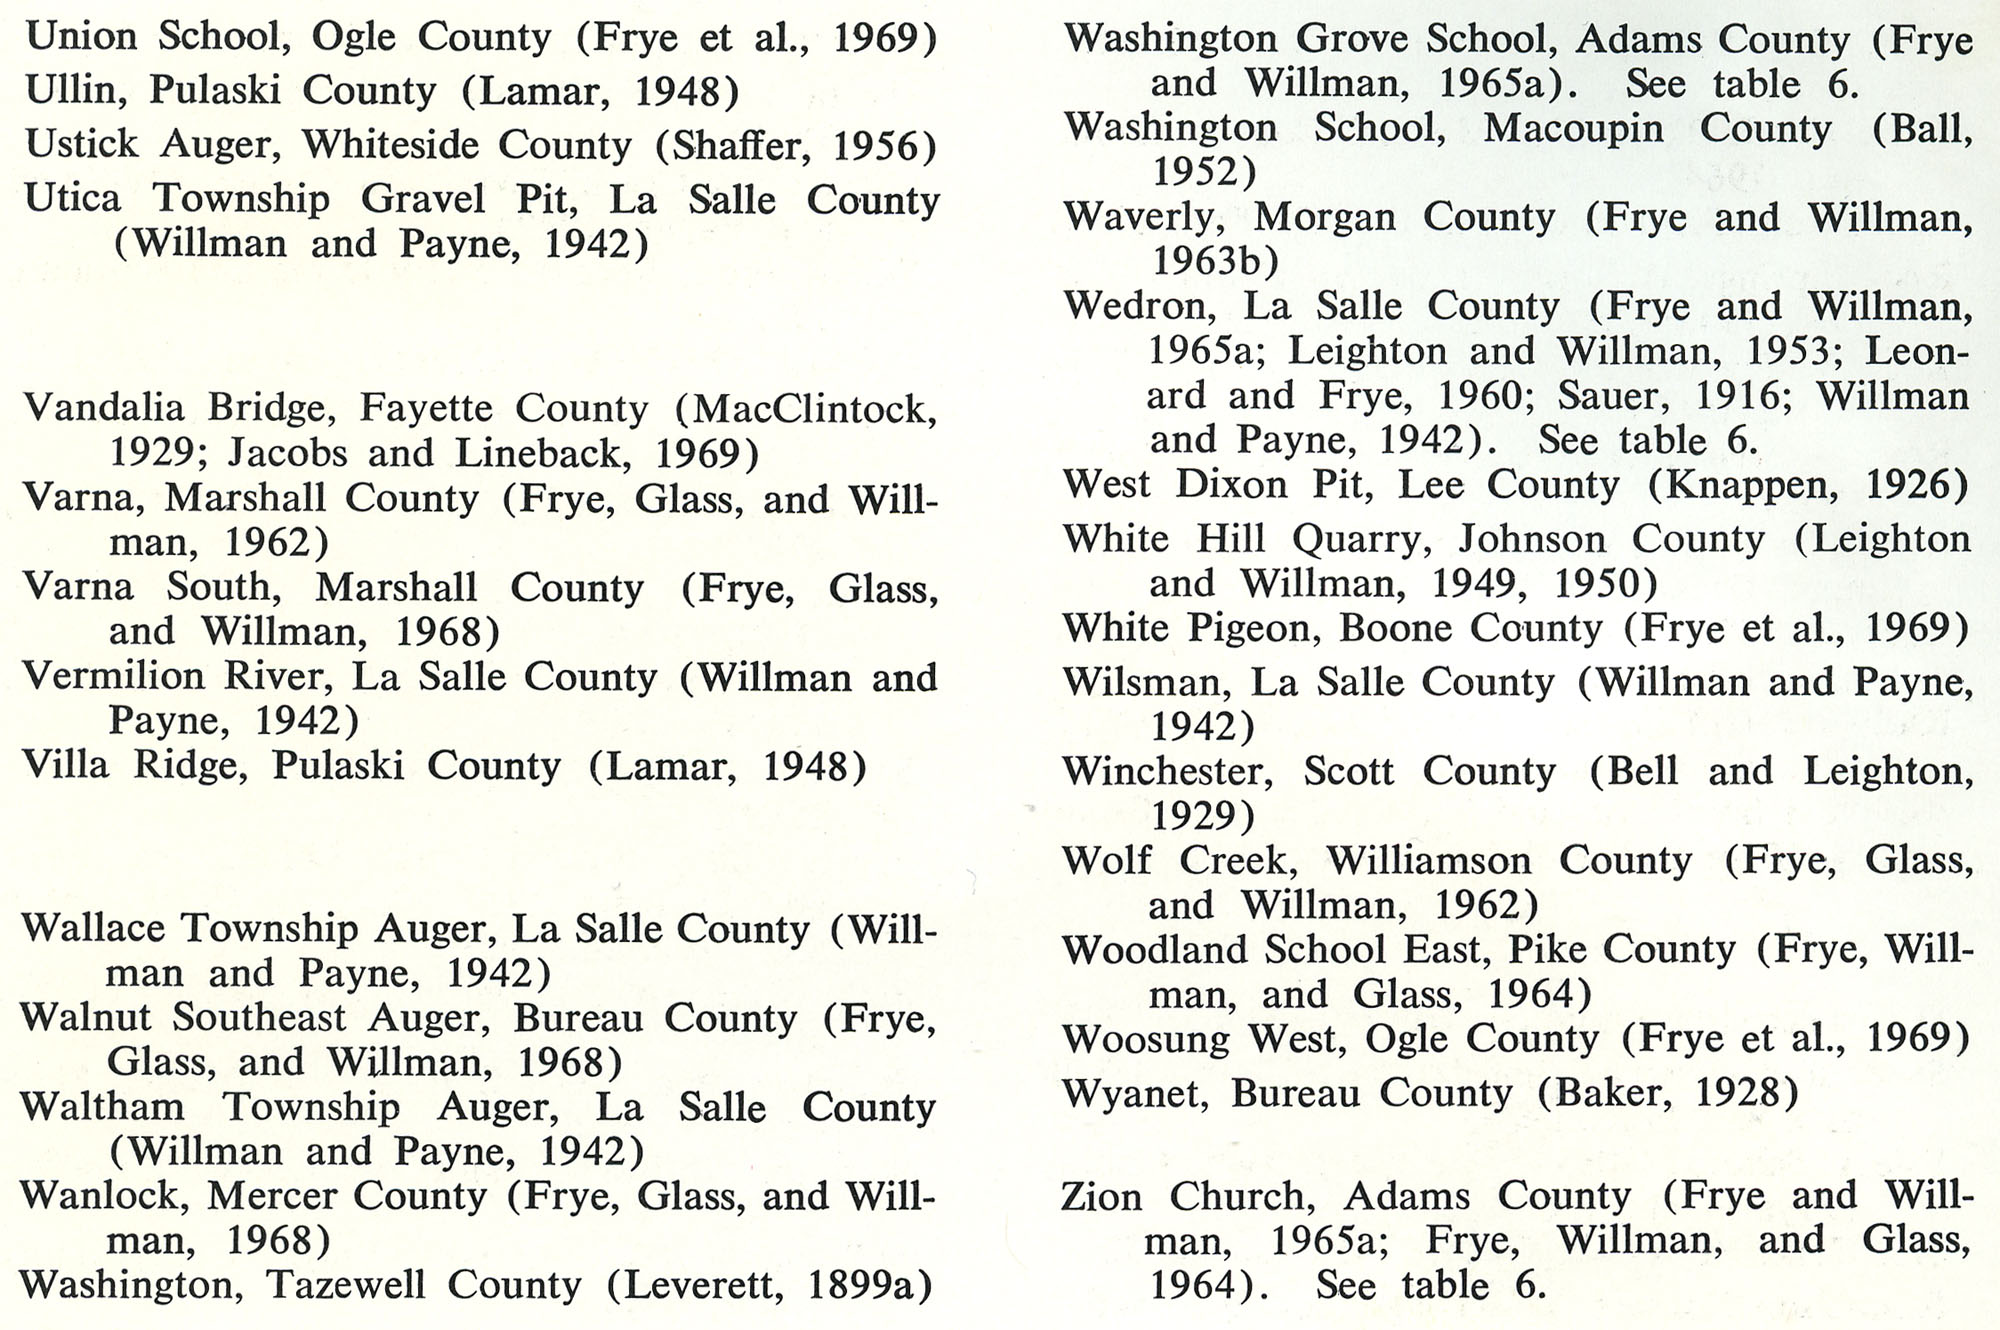
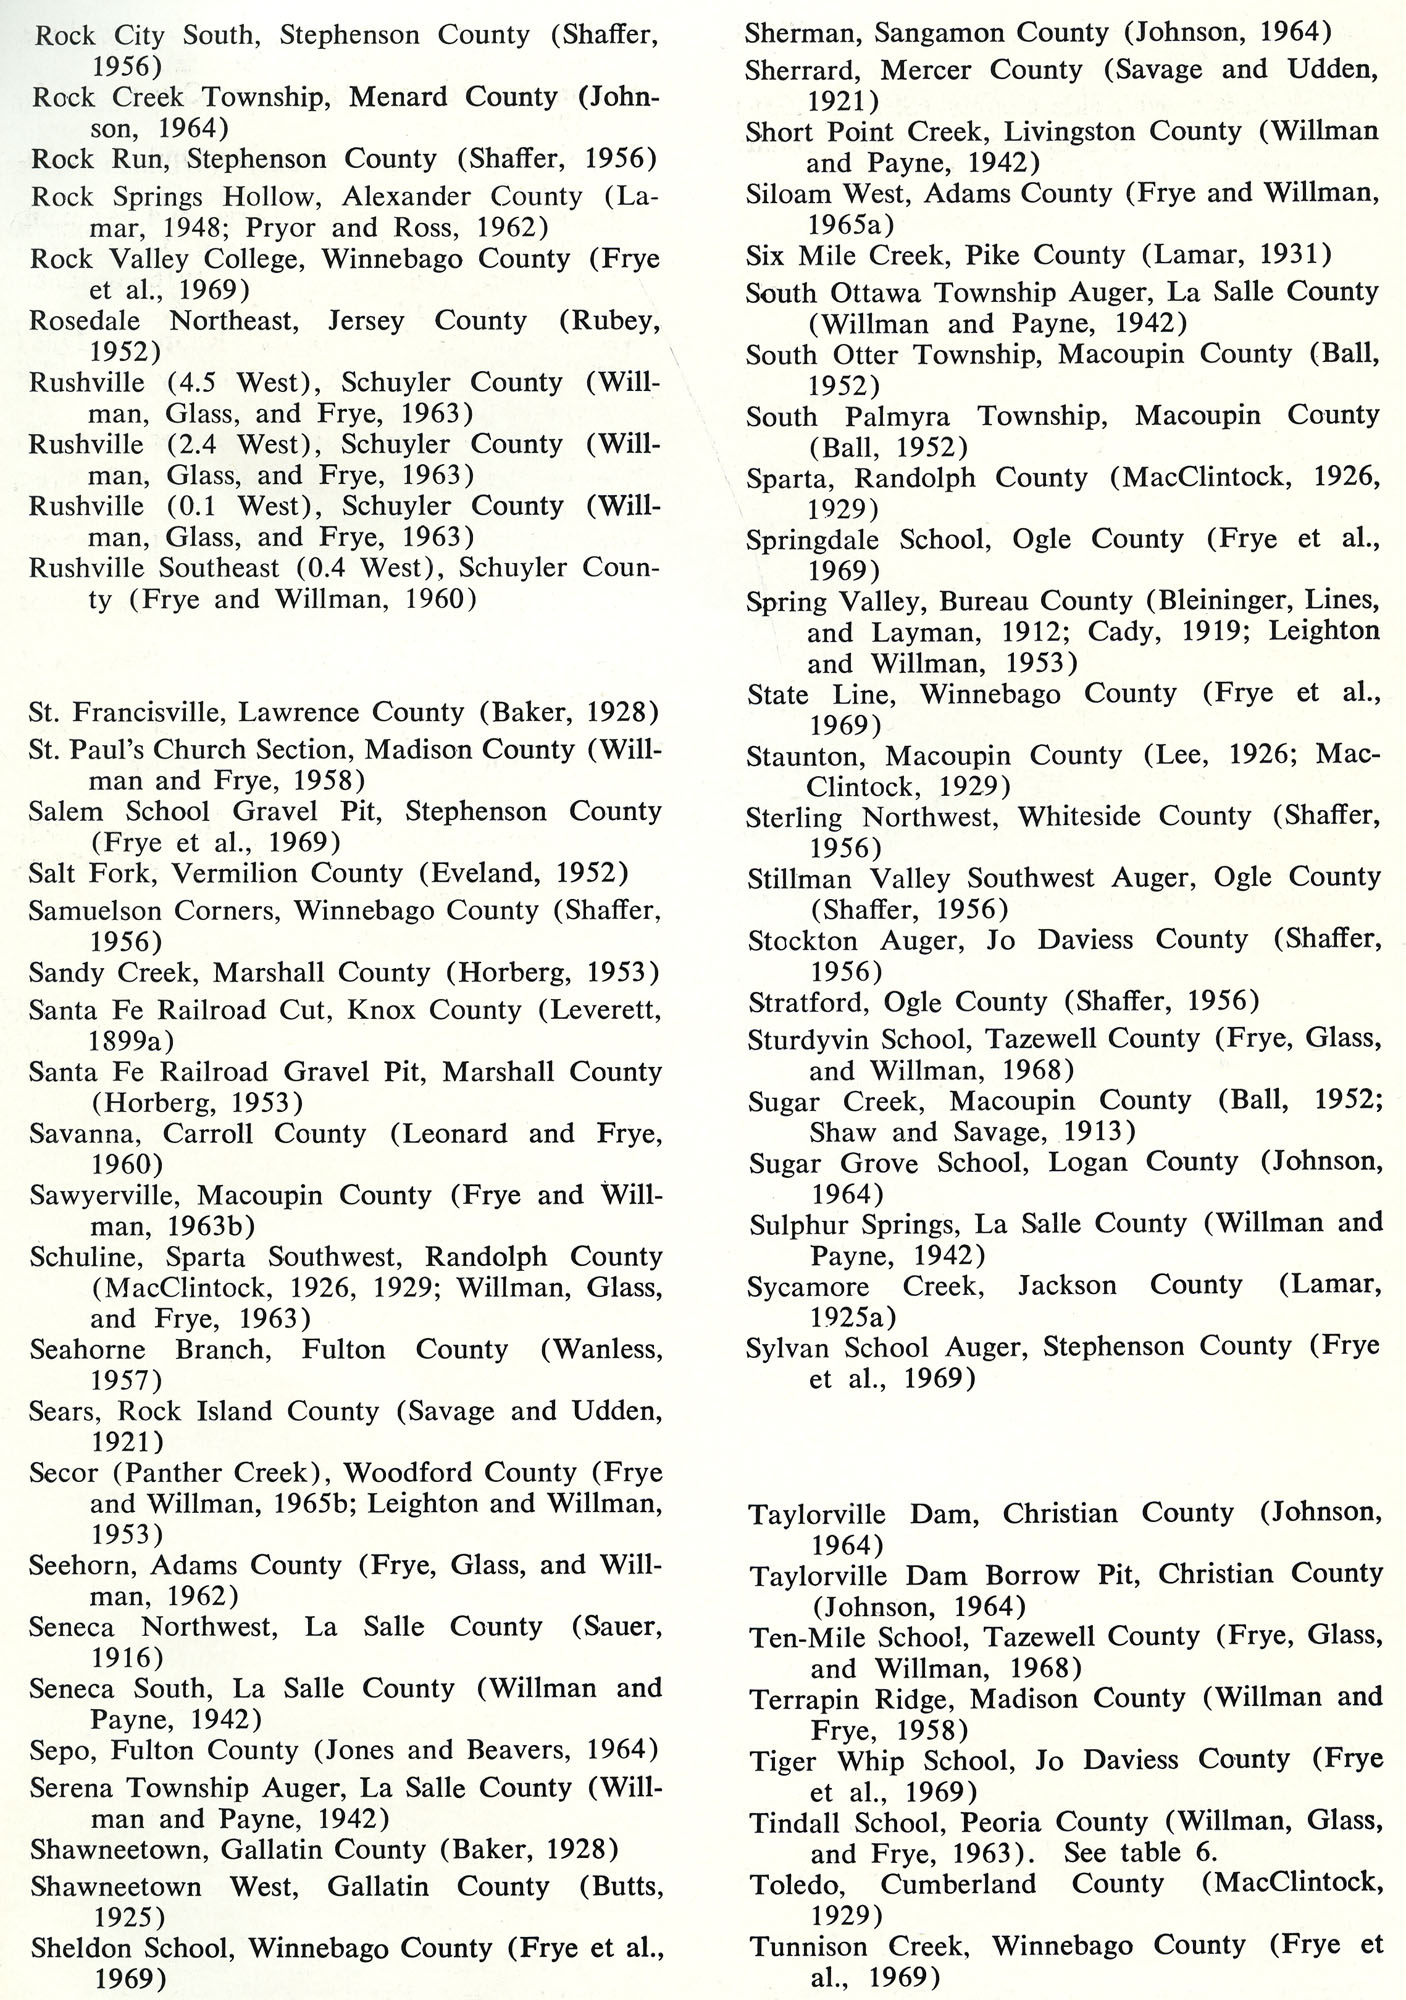
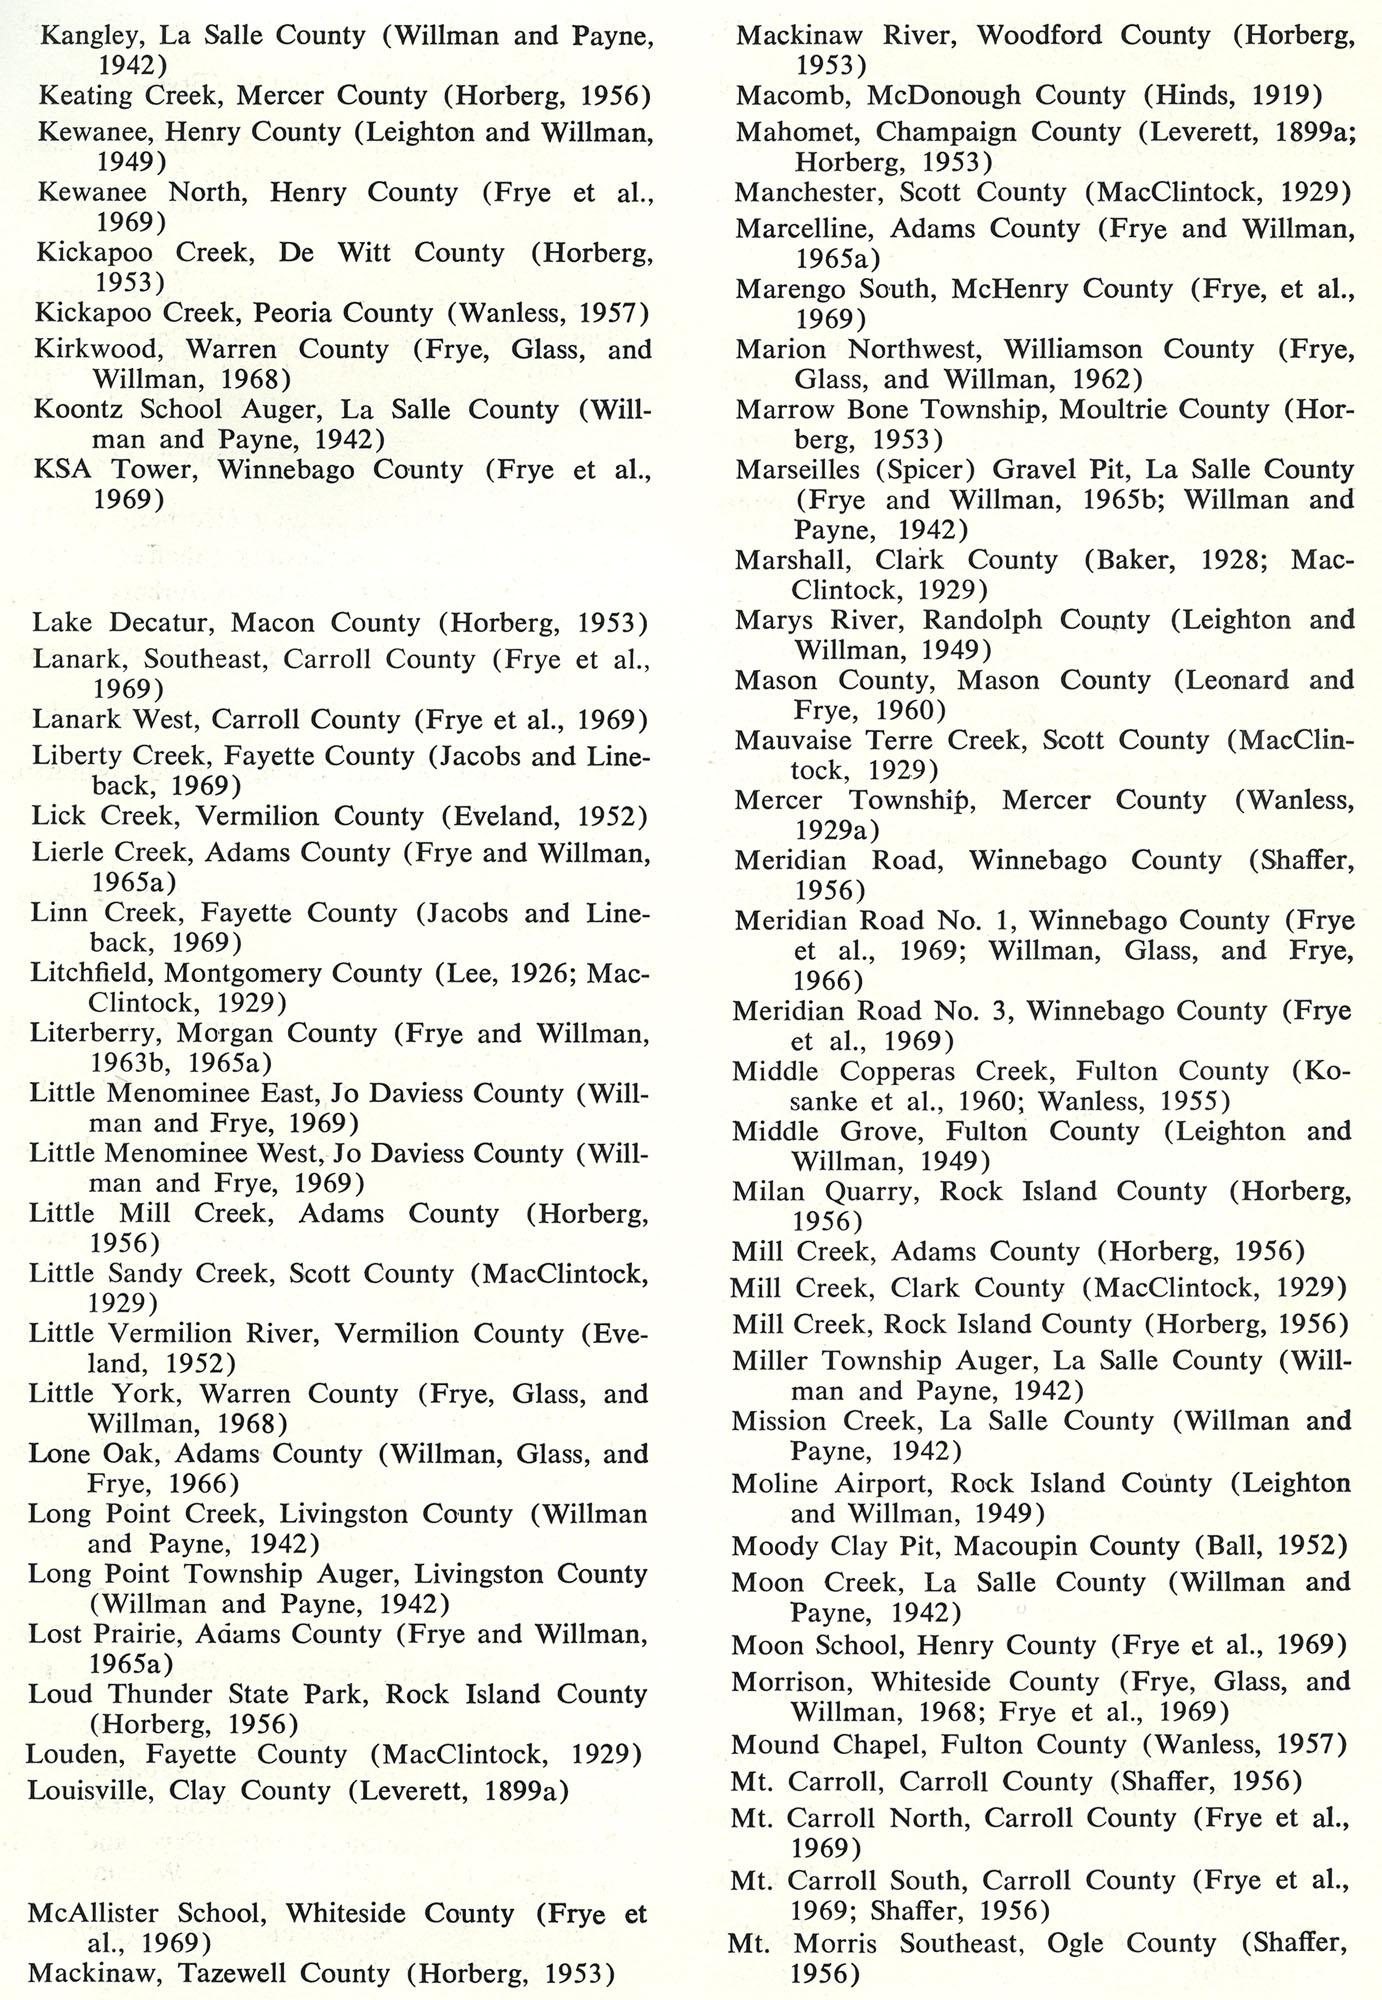
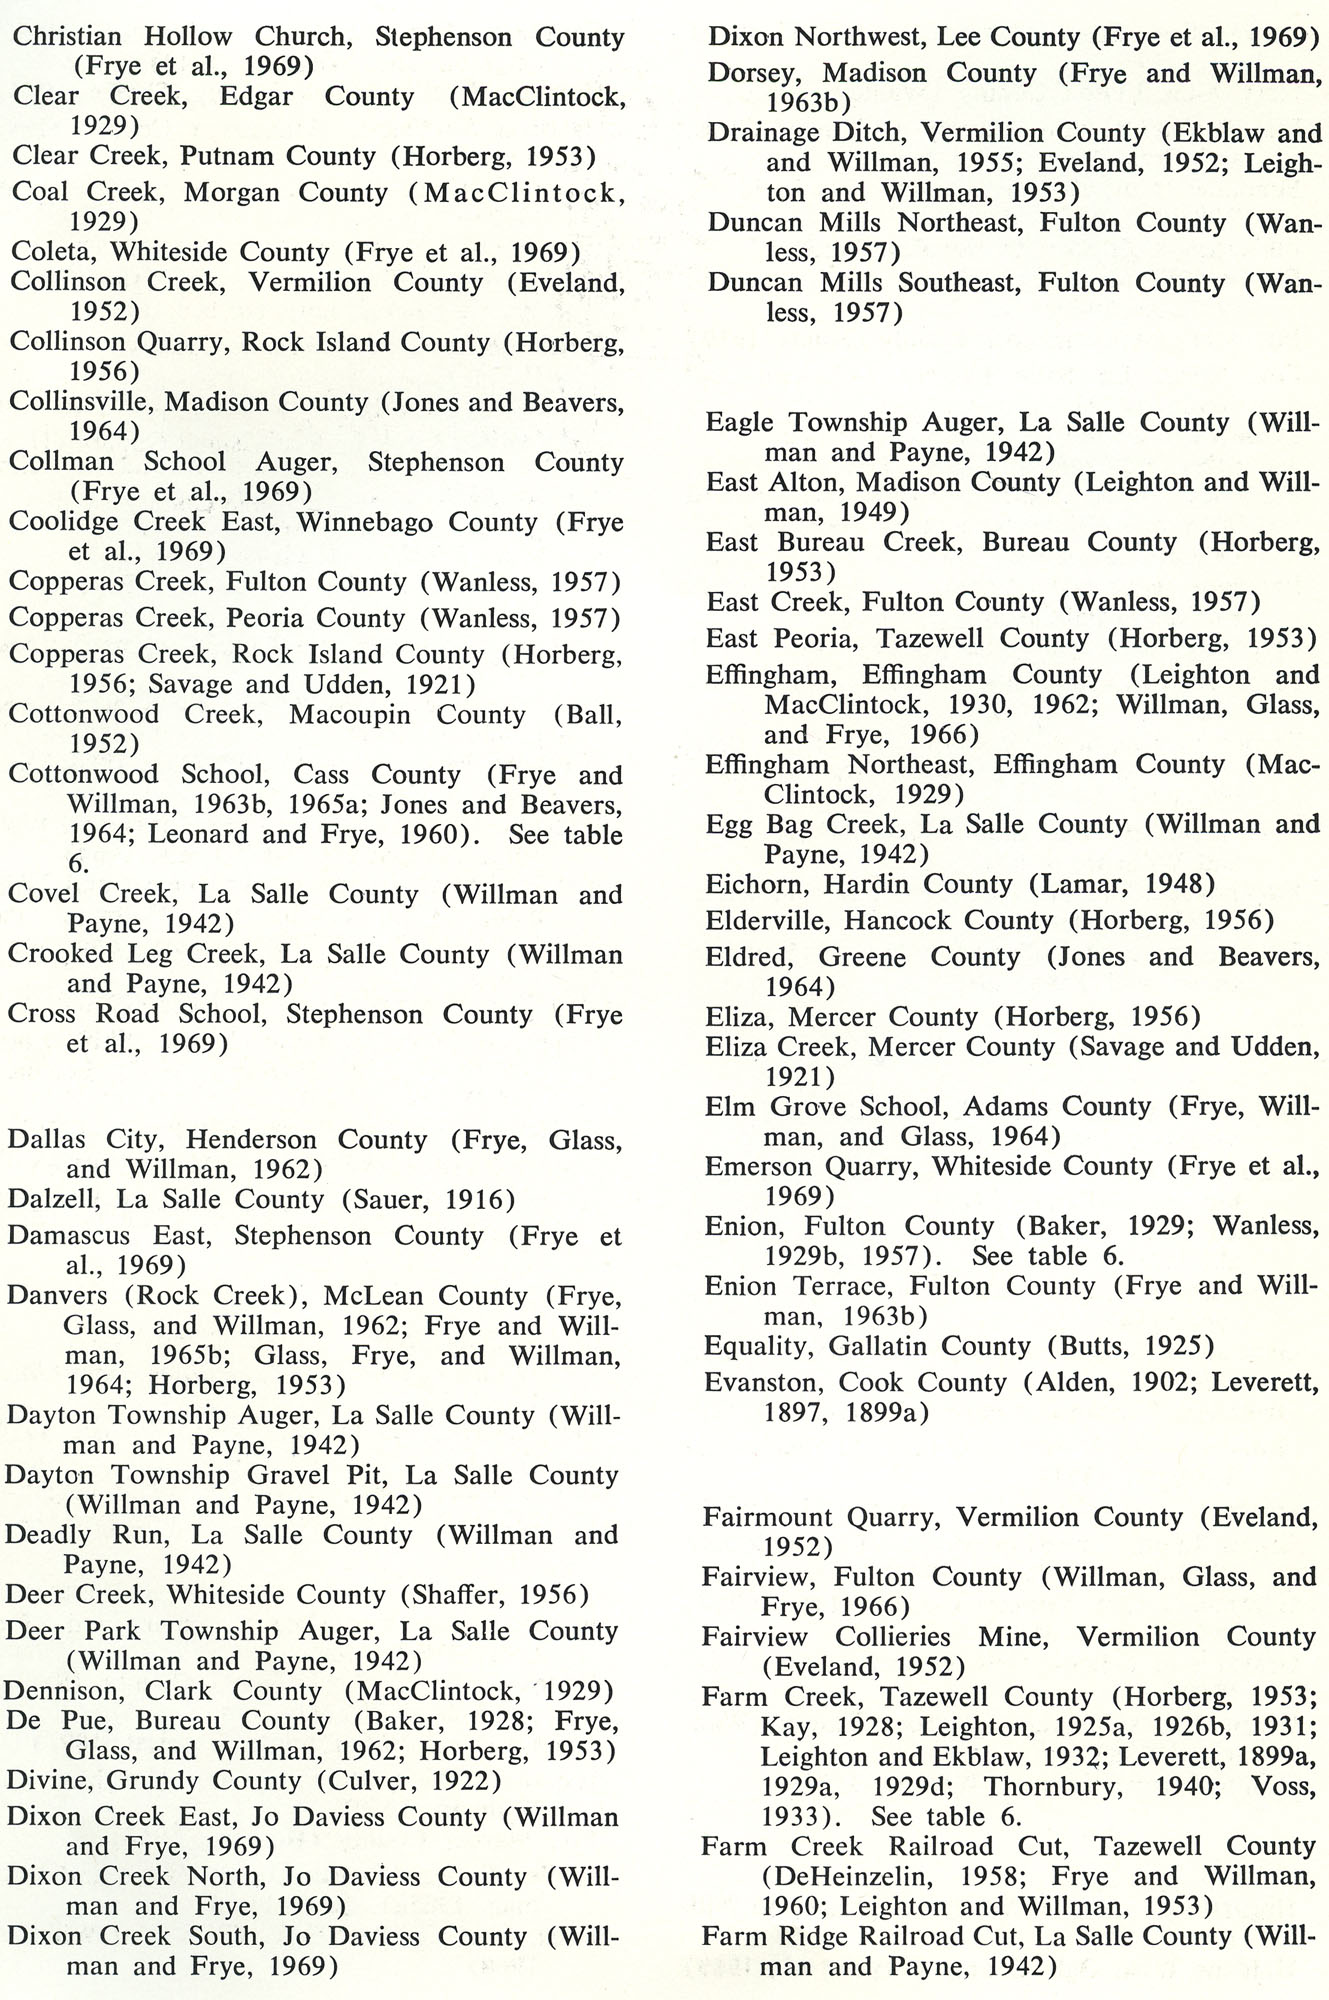
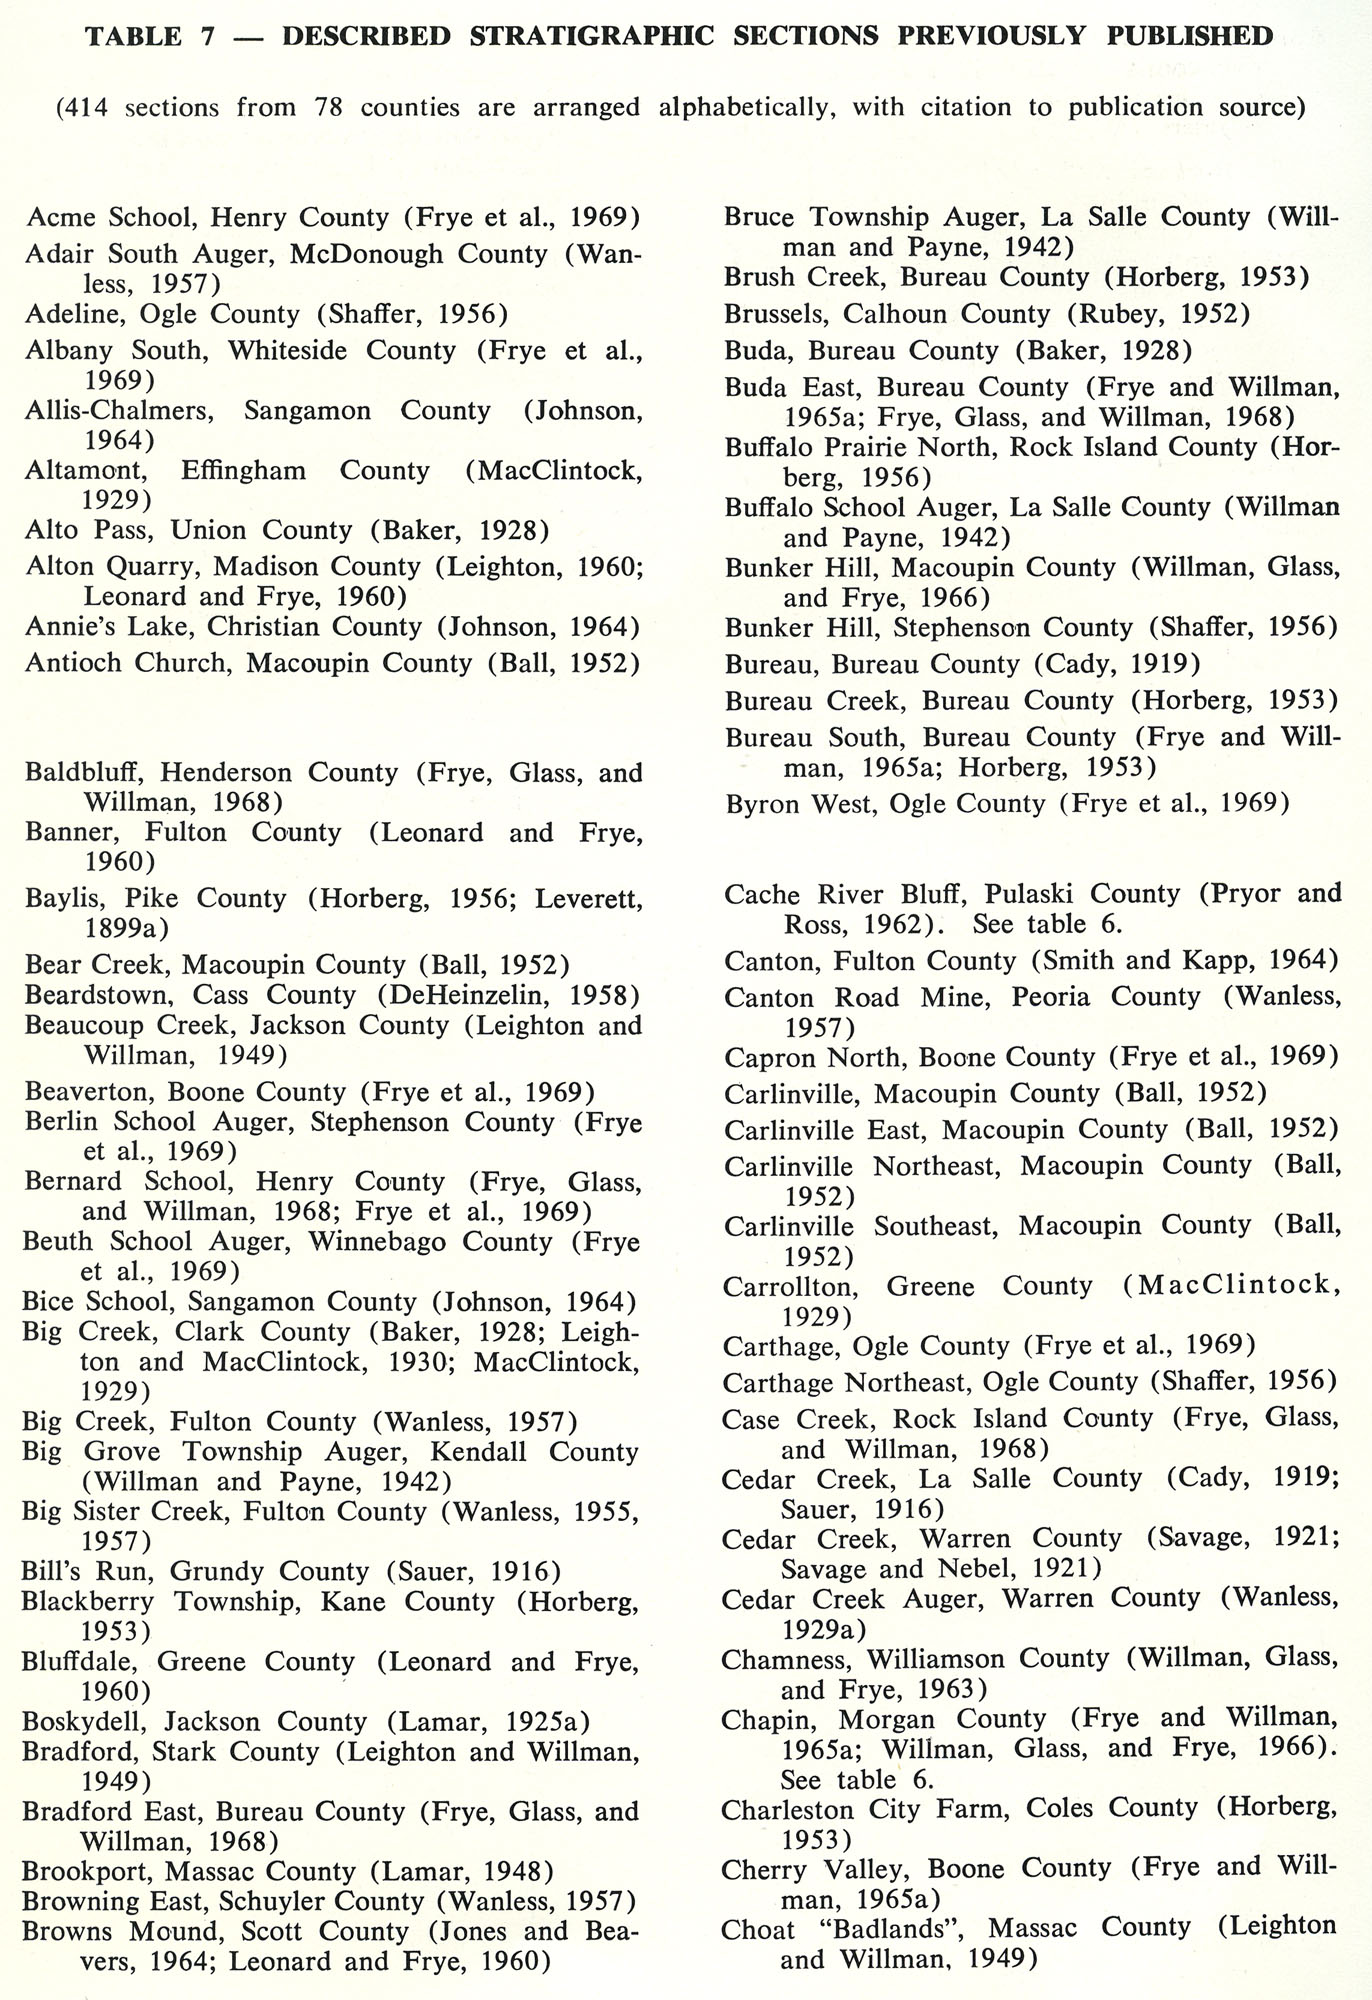
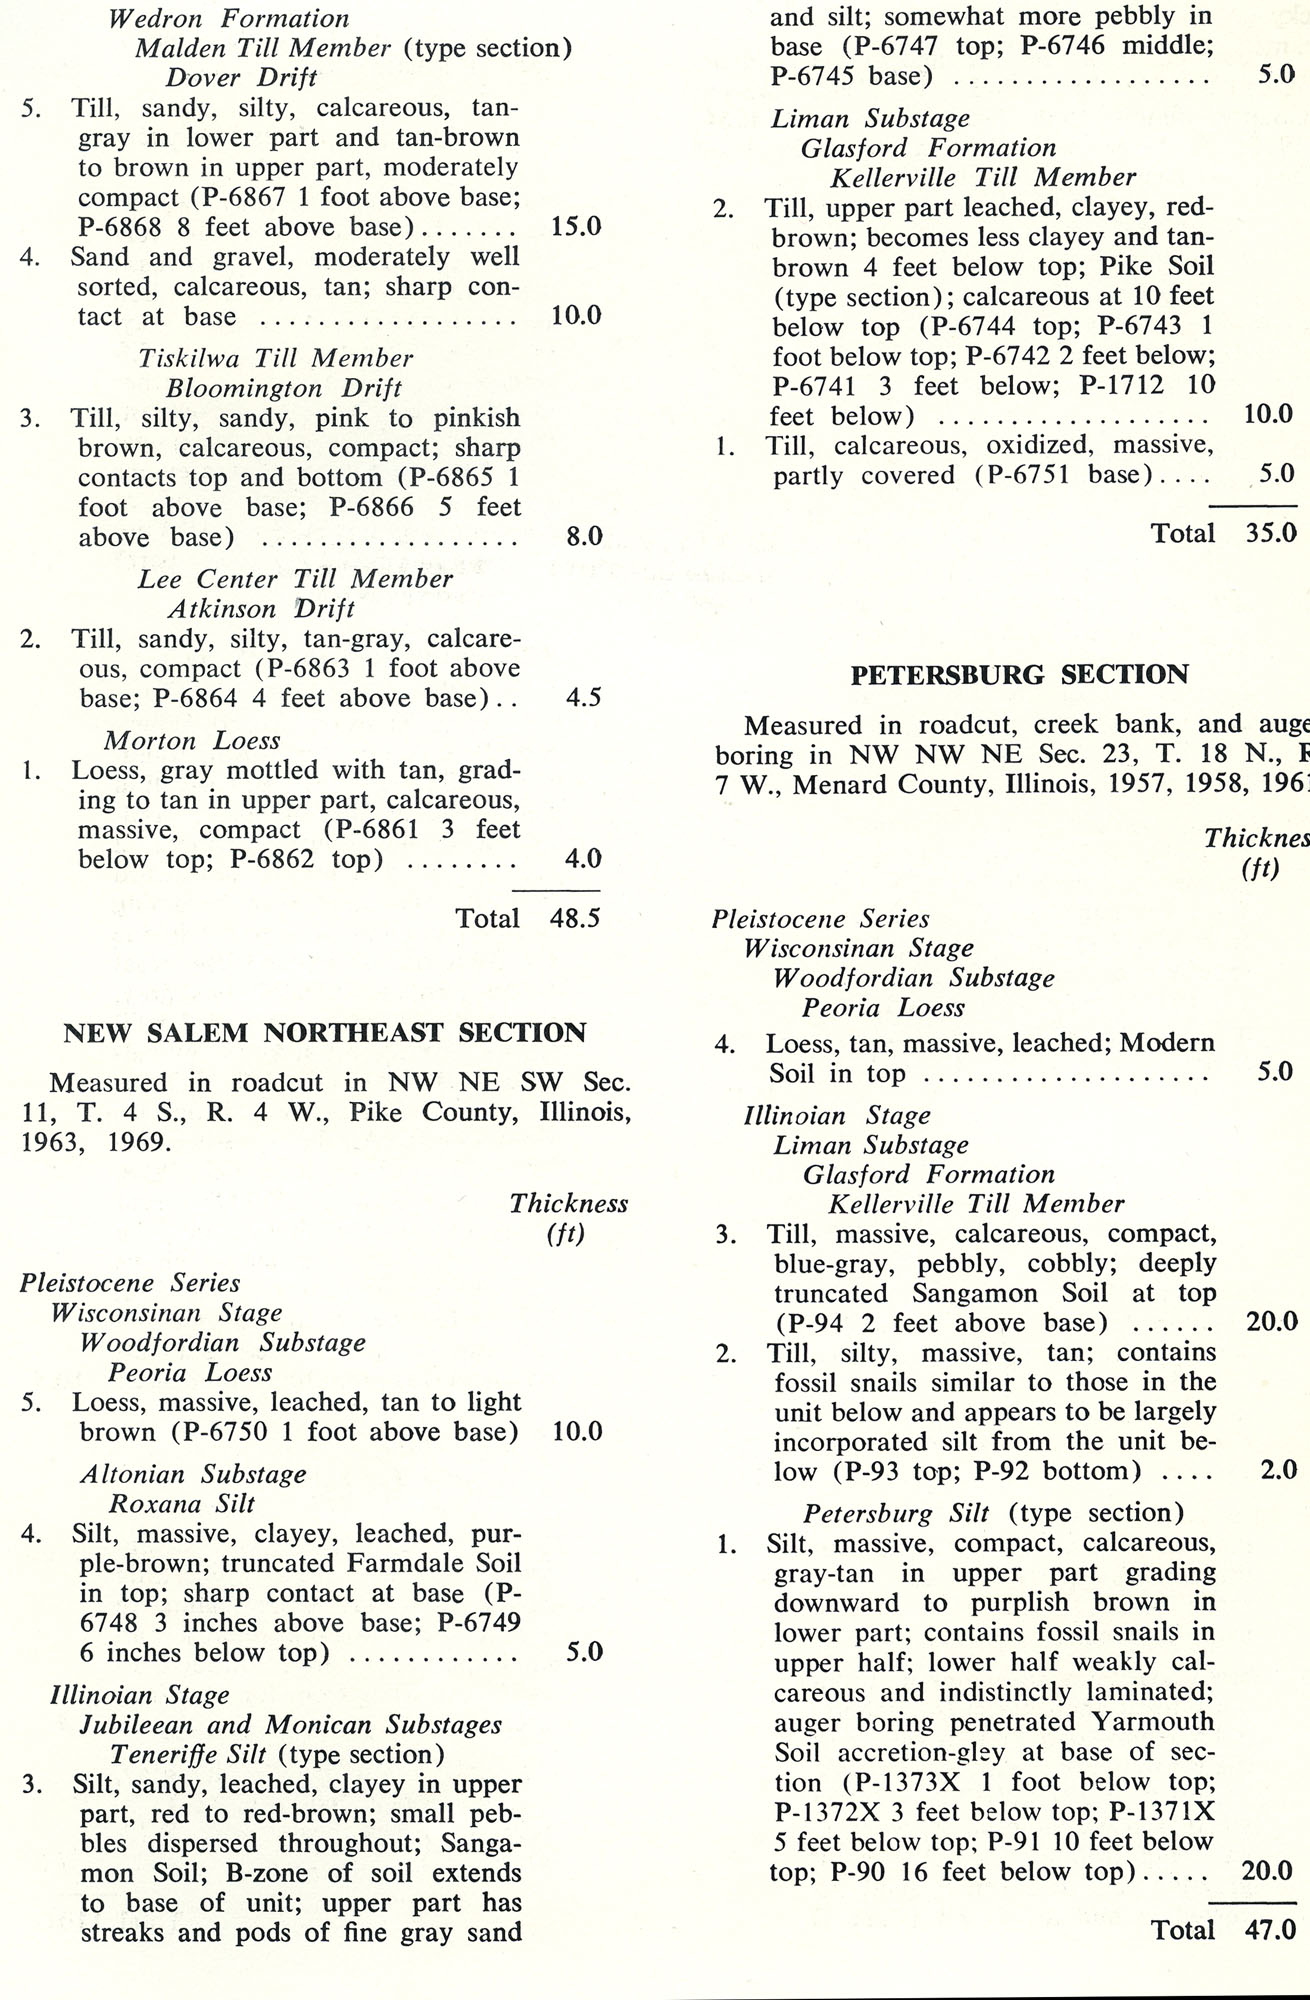
663 KB | Table 7 -- Described Stratigraphic Sections Previously Published (414 sections from 78 counties are arranged alphabetically, with citation to publication source). | 1 |
| 17:22, 18 April 2016 | 94-tb 6-m.jpg (file) |  |
261 KB | 1 | |
| 17:22, 18 April 2016 | 94-tb 6-l.jpg (file) |  |
615 KB | 1 | |
| 17:21, 18 April 2016 | 94-tb 6-k.jpg (file) |  |
533 KB | 1 | |
| 17:21, 18 April 2016 | 94-tb 6-j.jpg (file) |  |
610 KB | 1 | |
| 17:20, 18 April 2016 | 94-tb 6-i.jpg (file) |  |
570 KB | 1 | |
| 17:19, 18 April 2016 | 94-tb 6-h.jpg (file) |  |
623 KB | 1 | |
| 17:19, 18 April 2016 | 94-tb 6-g.jpg (file) |  |
555 KB | 1 | |
| 17:18, 18 April 2016 | 94-tb 6-f.jpg (file) |  |
560 KB | 1 | |
| 17:17, 18 April 2016 | 94-tb 6-e.jpg (file) |  |
555 KB | 1 | |
| 17:17, 18 April 2016 | 94-tb 6-d.jpg (file) |  |
564 KB | 1 | |
| 17:16, 18 April 2016 | 94-tb 6-c.jpg (file) |  |
598 KB | 1 | |
| 17:16, 18 April 2016 | 94-tb 6-b.jpg (file) |  |
561 KB | 1 | |
| 17:15, 18 April 2016 | 94-tb 6-a.jpg (file) |  |
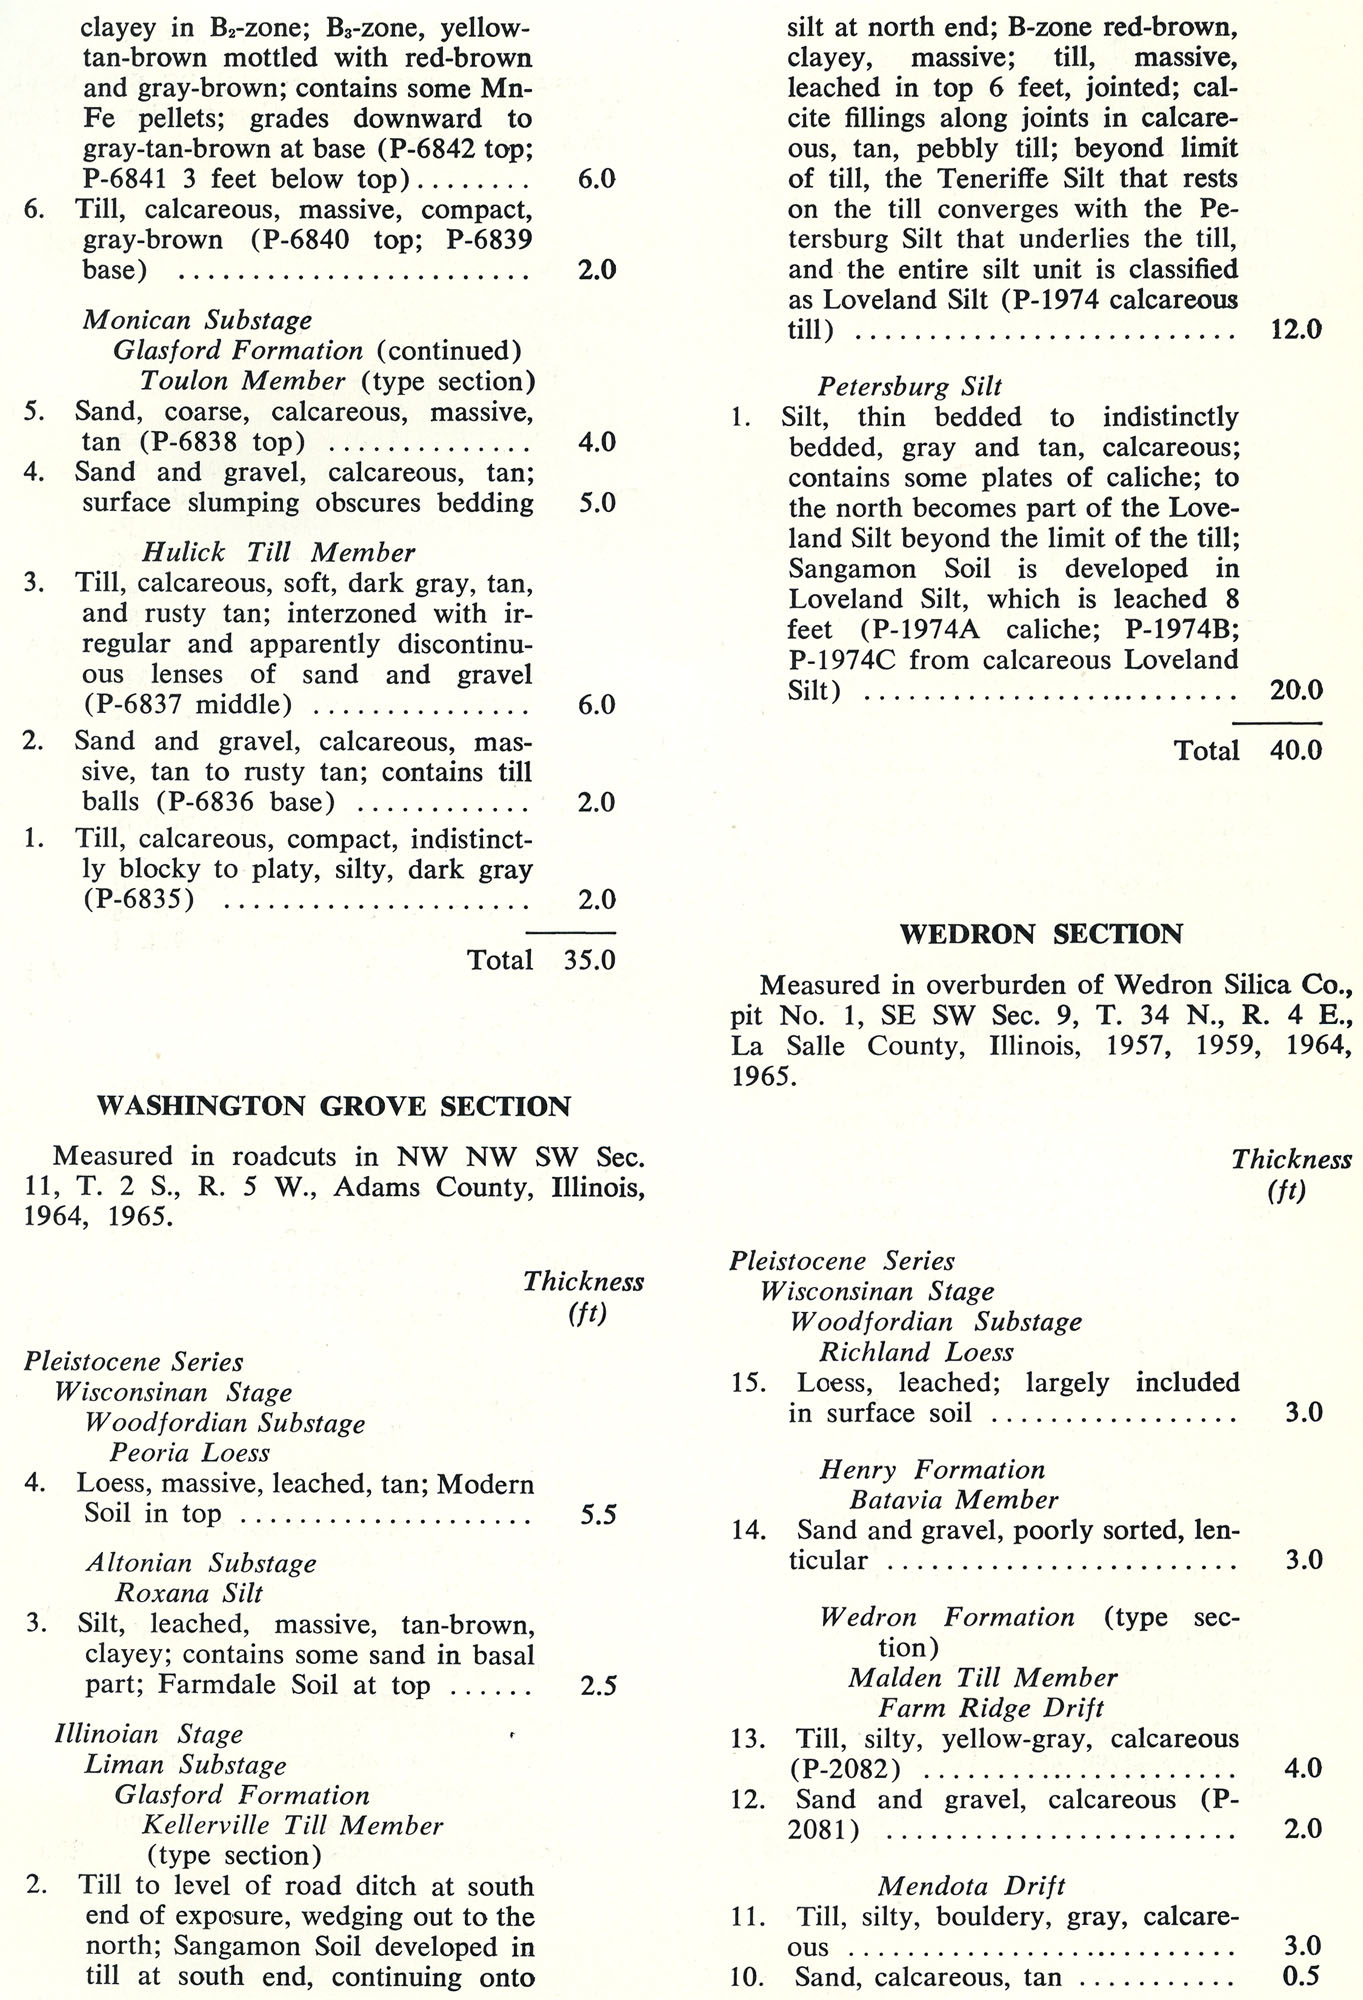
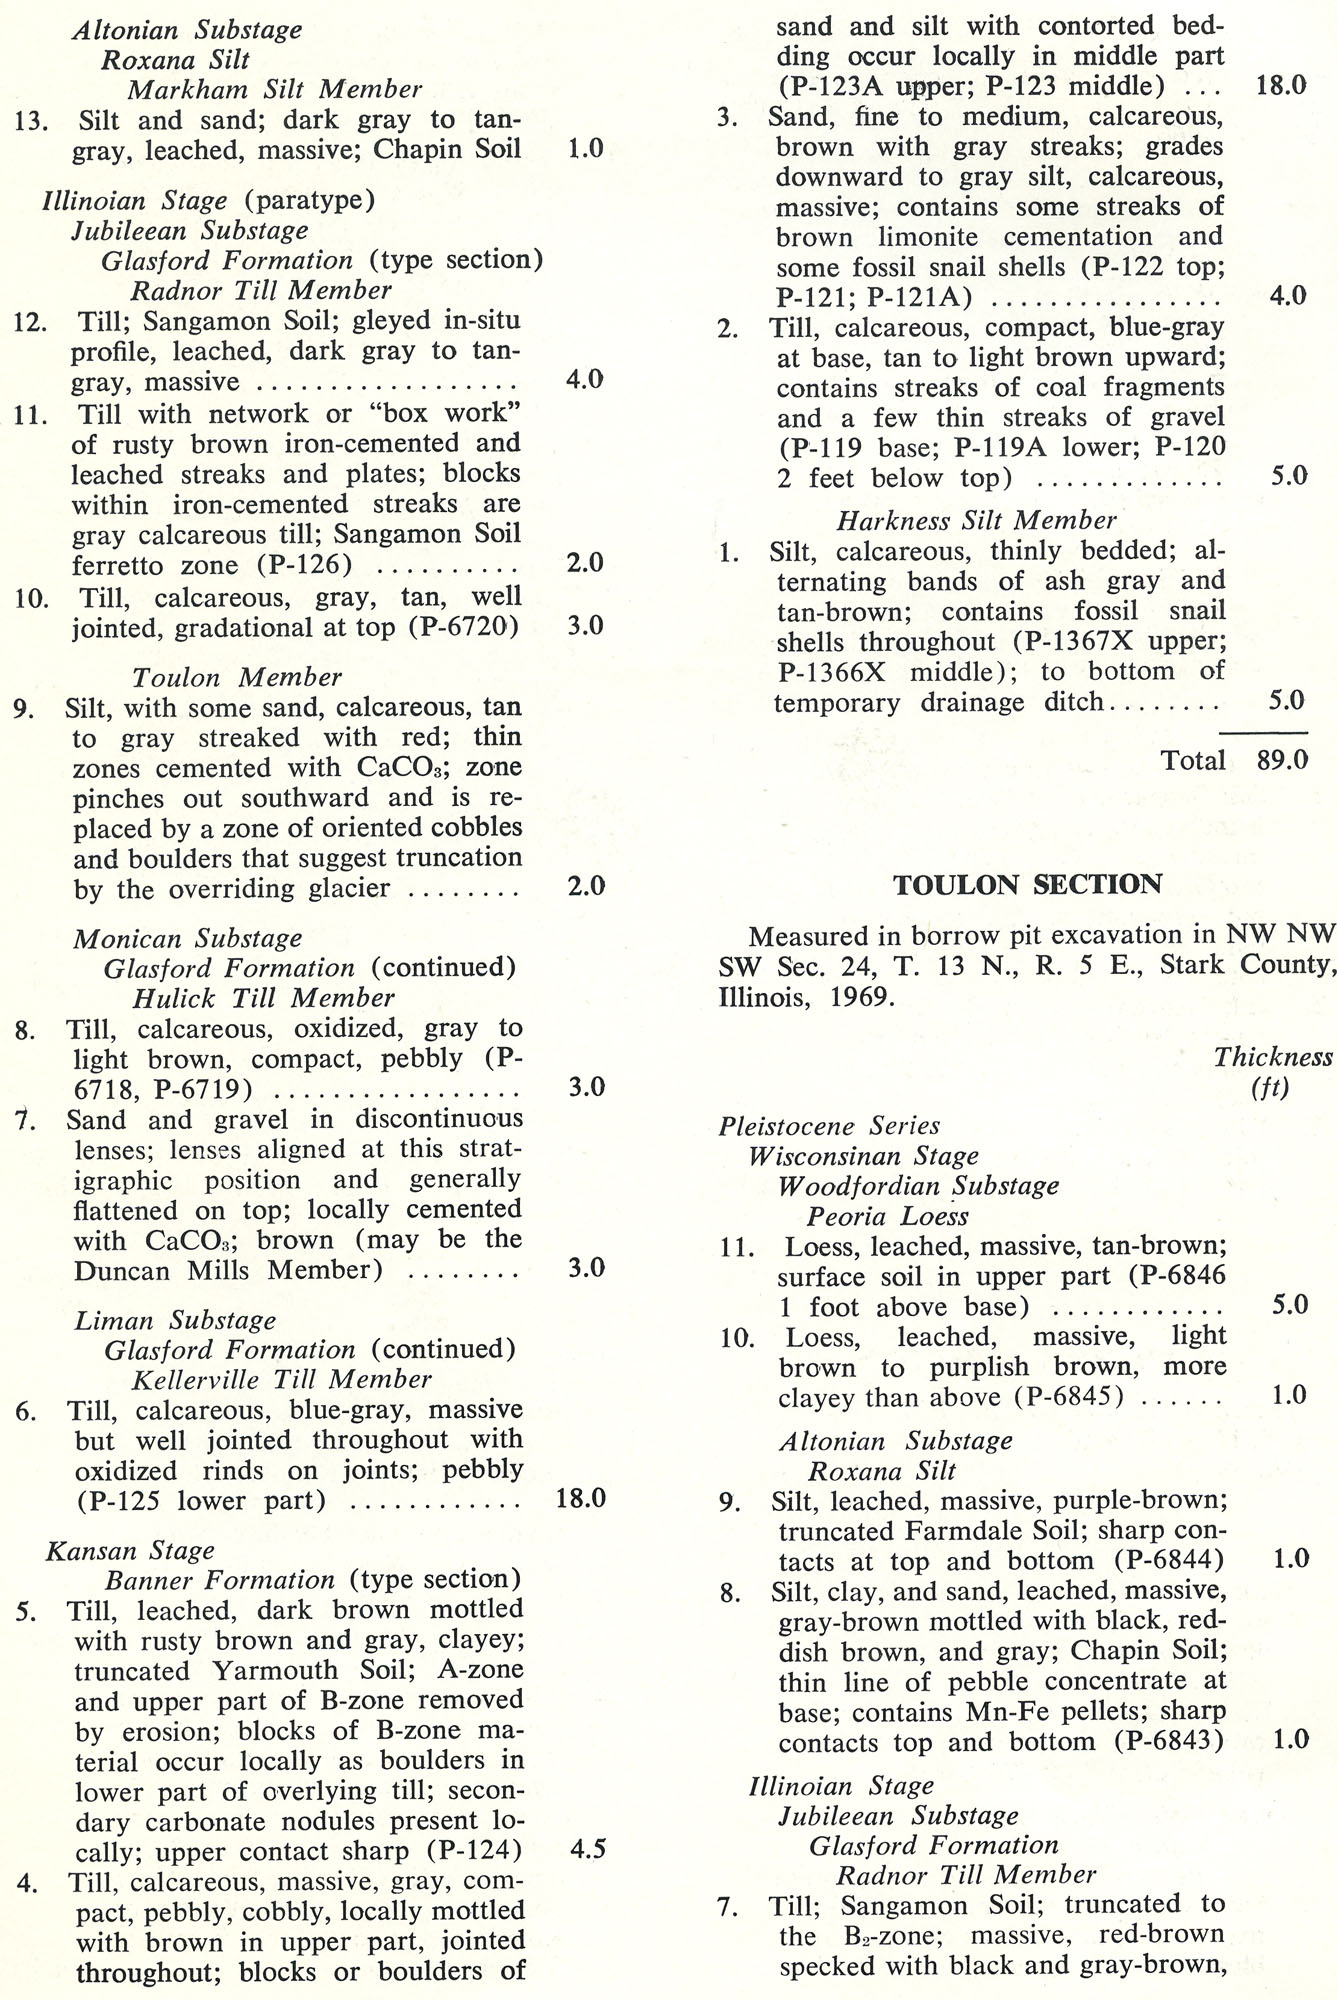
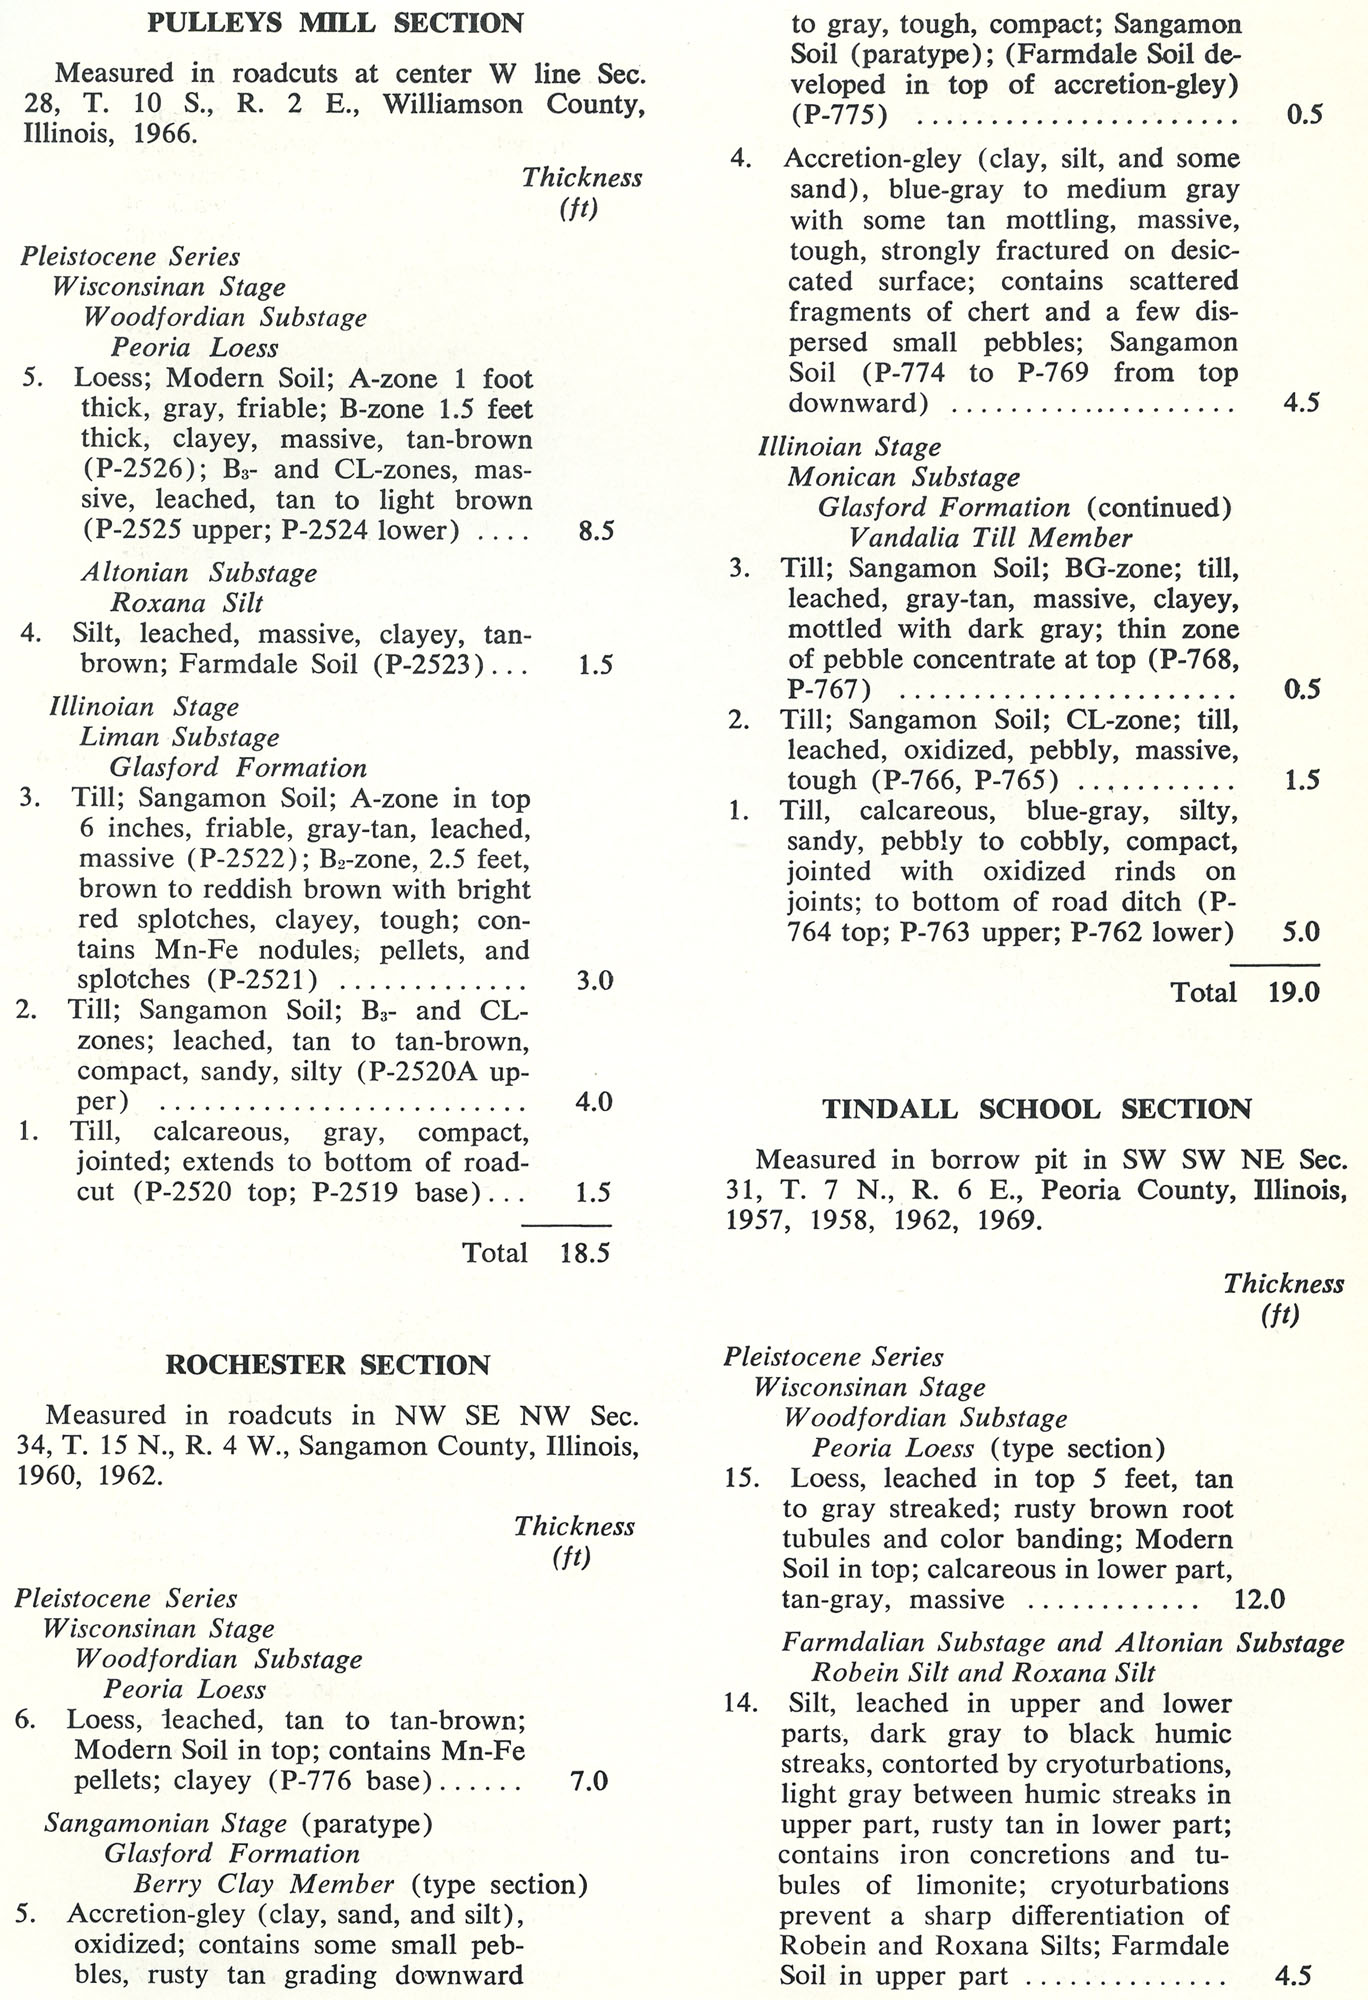
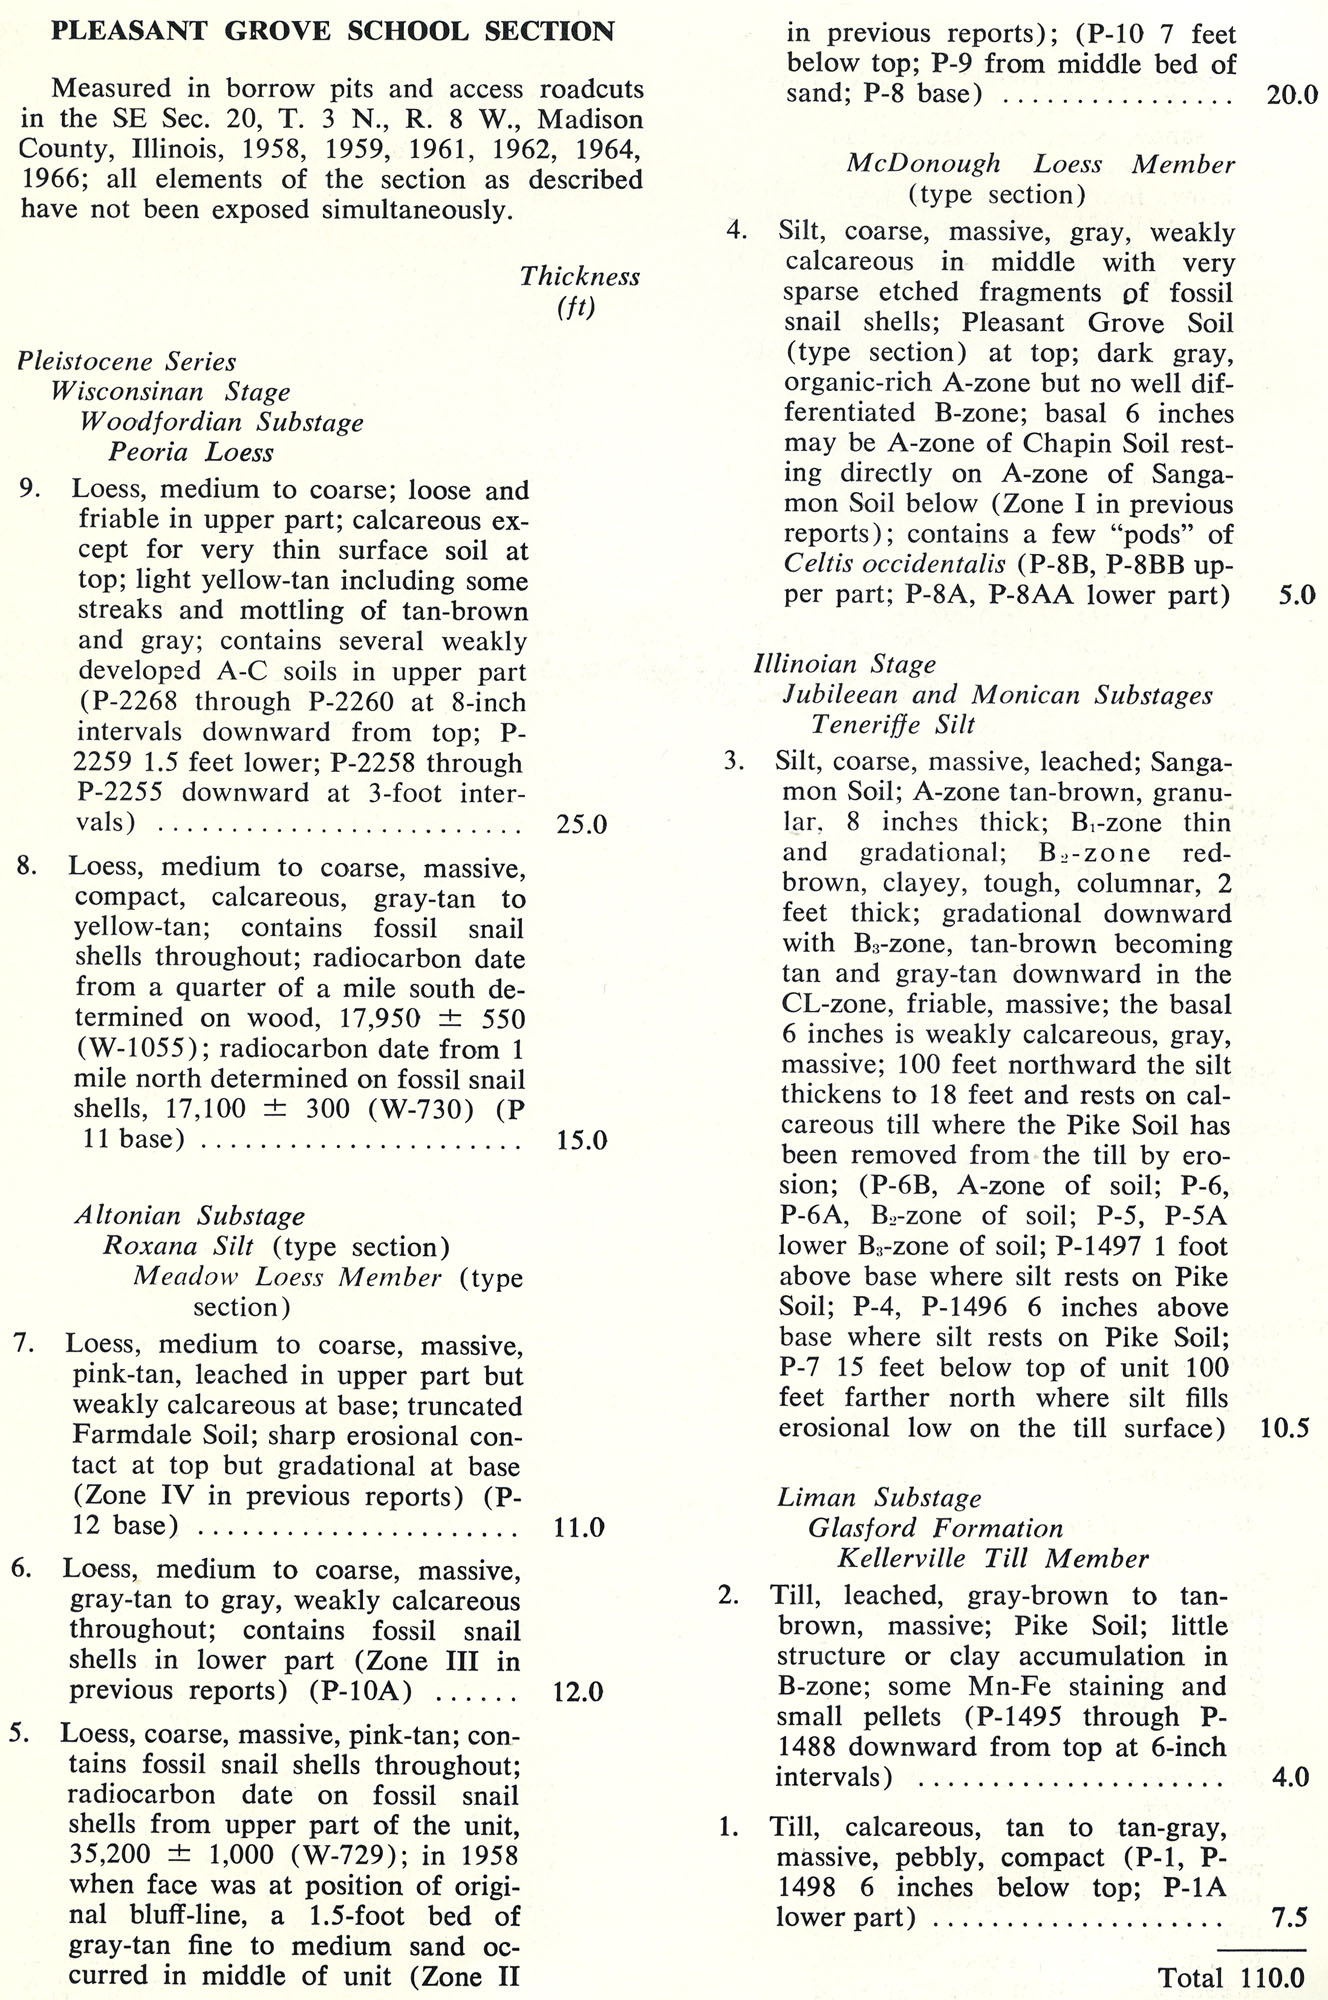
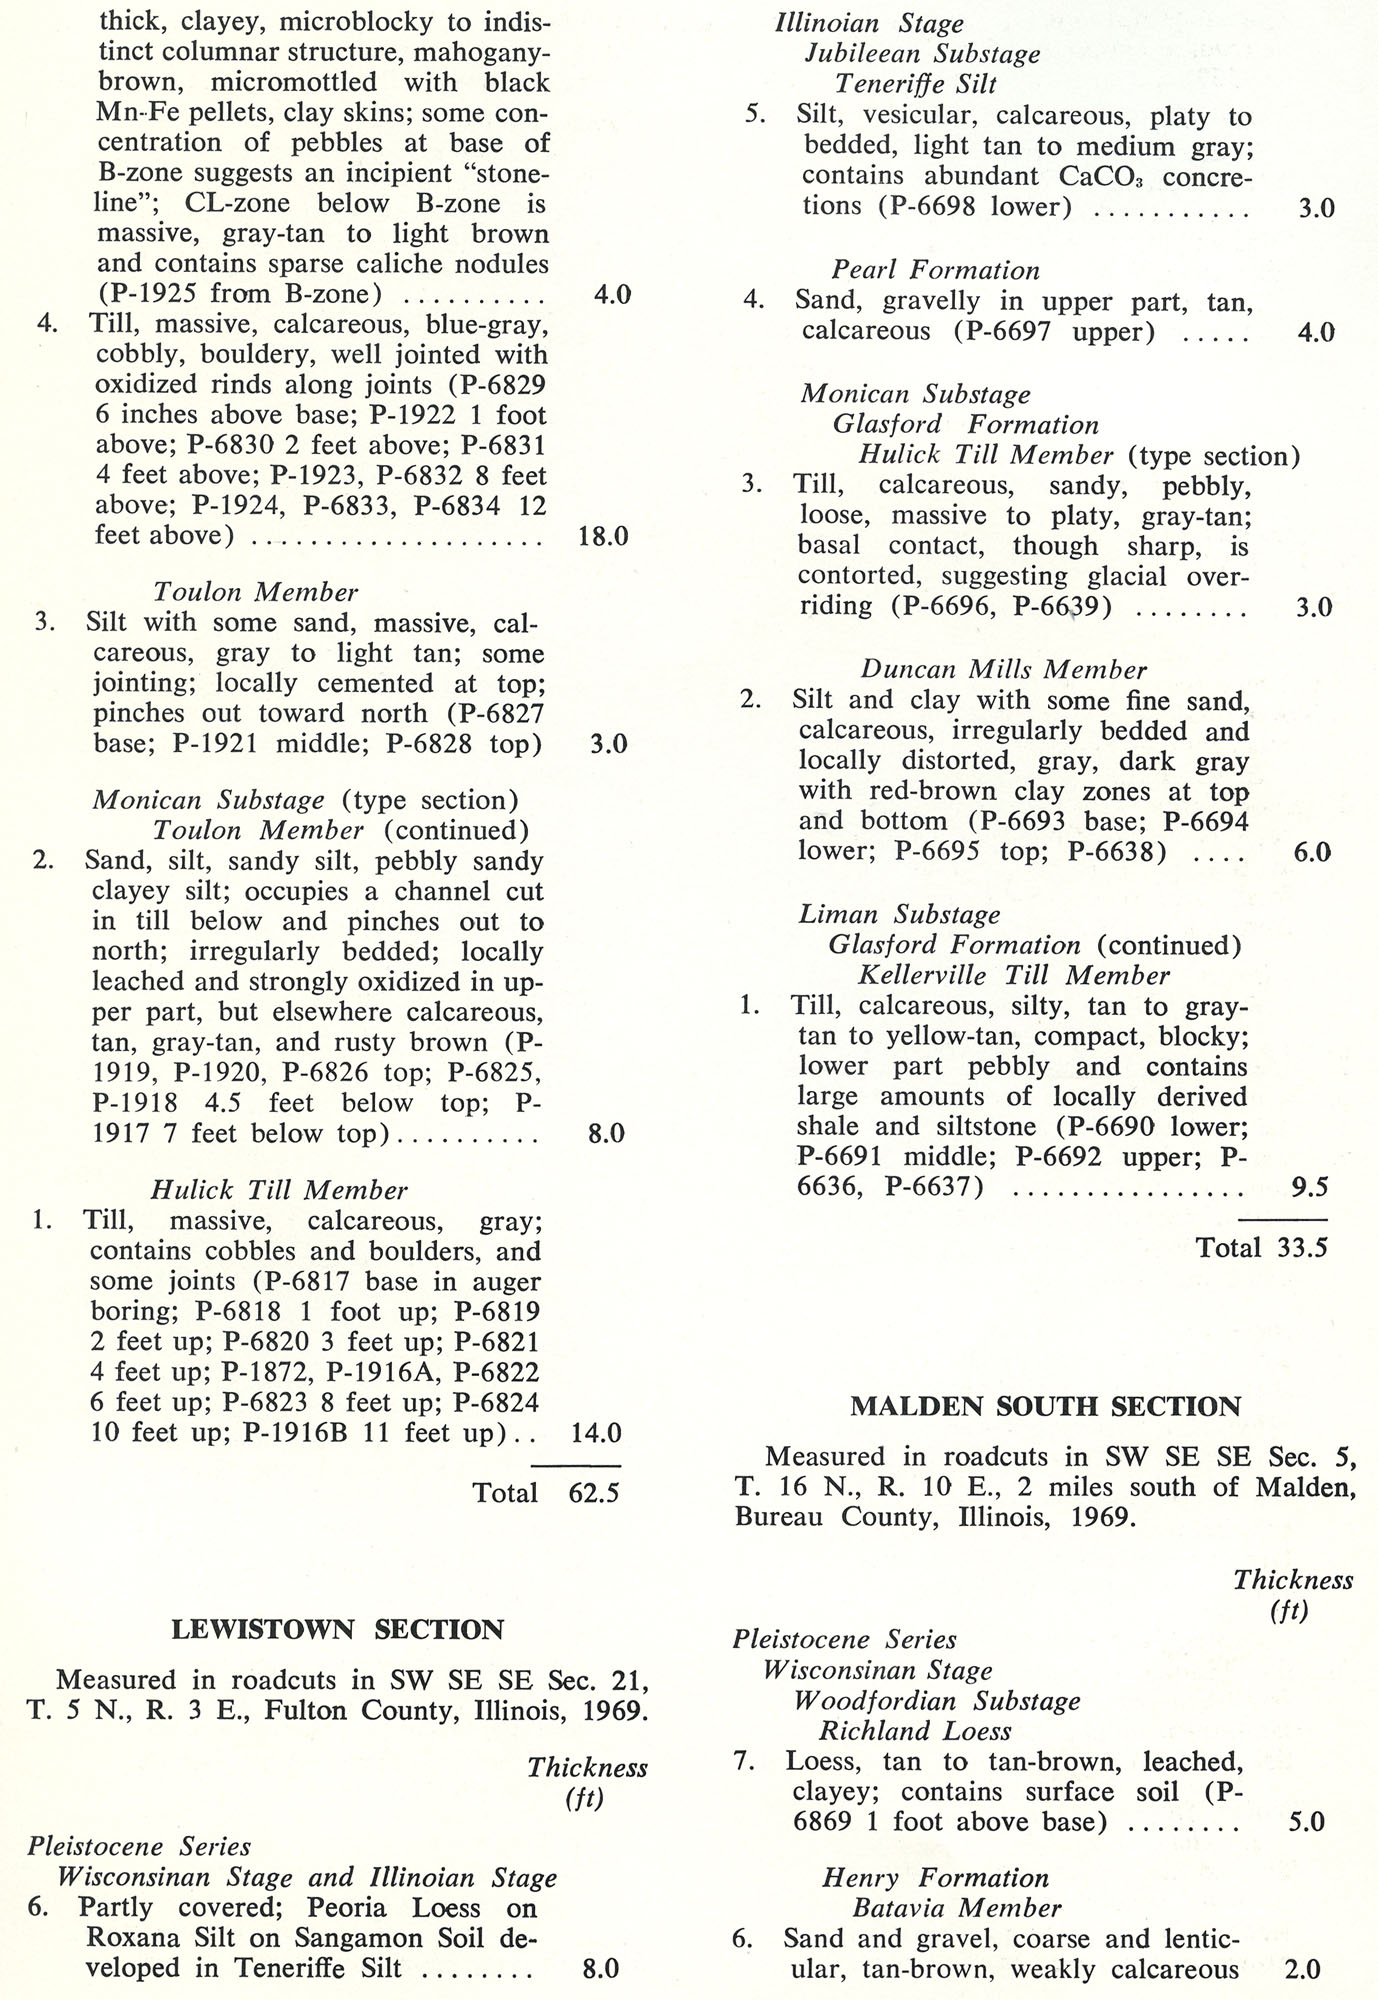
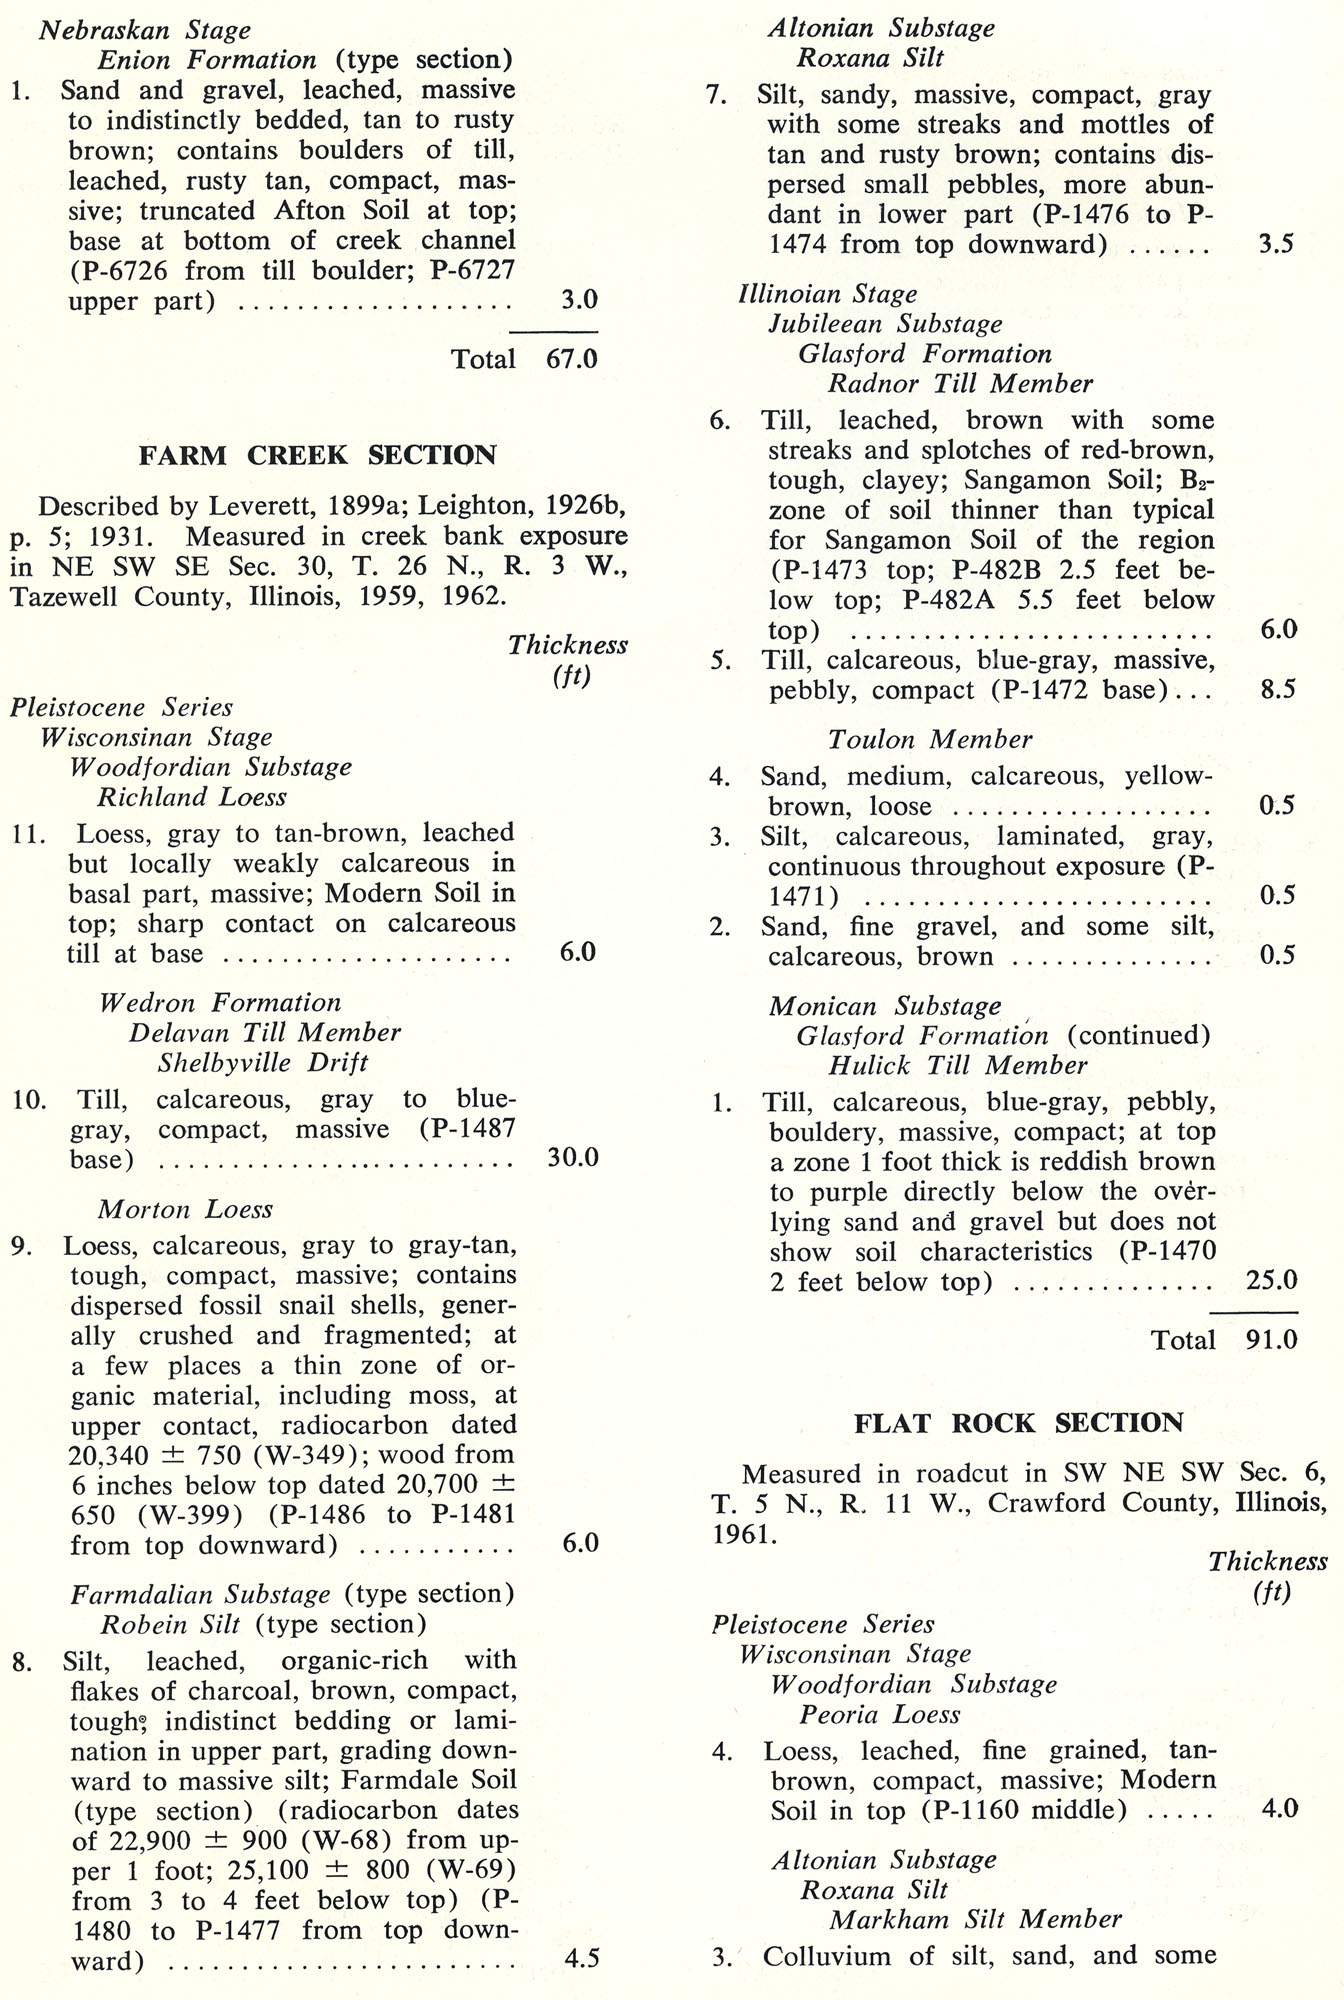
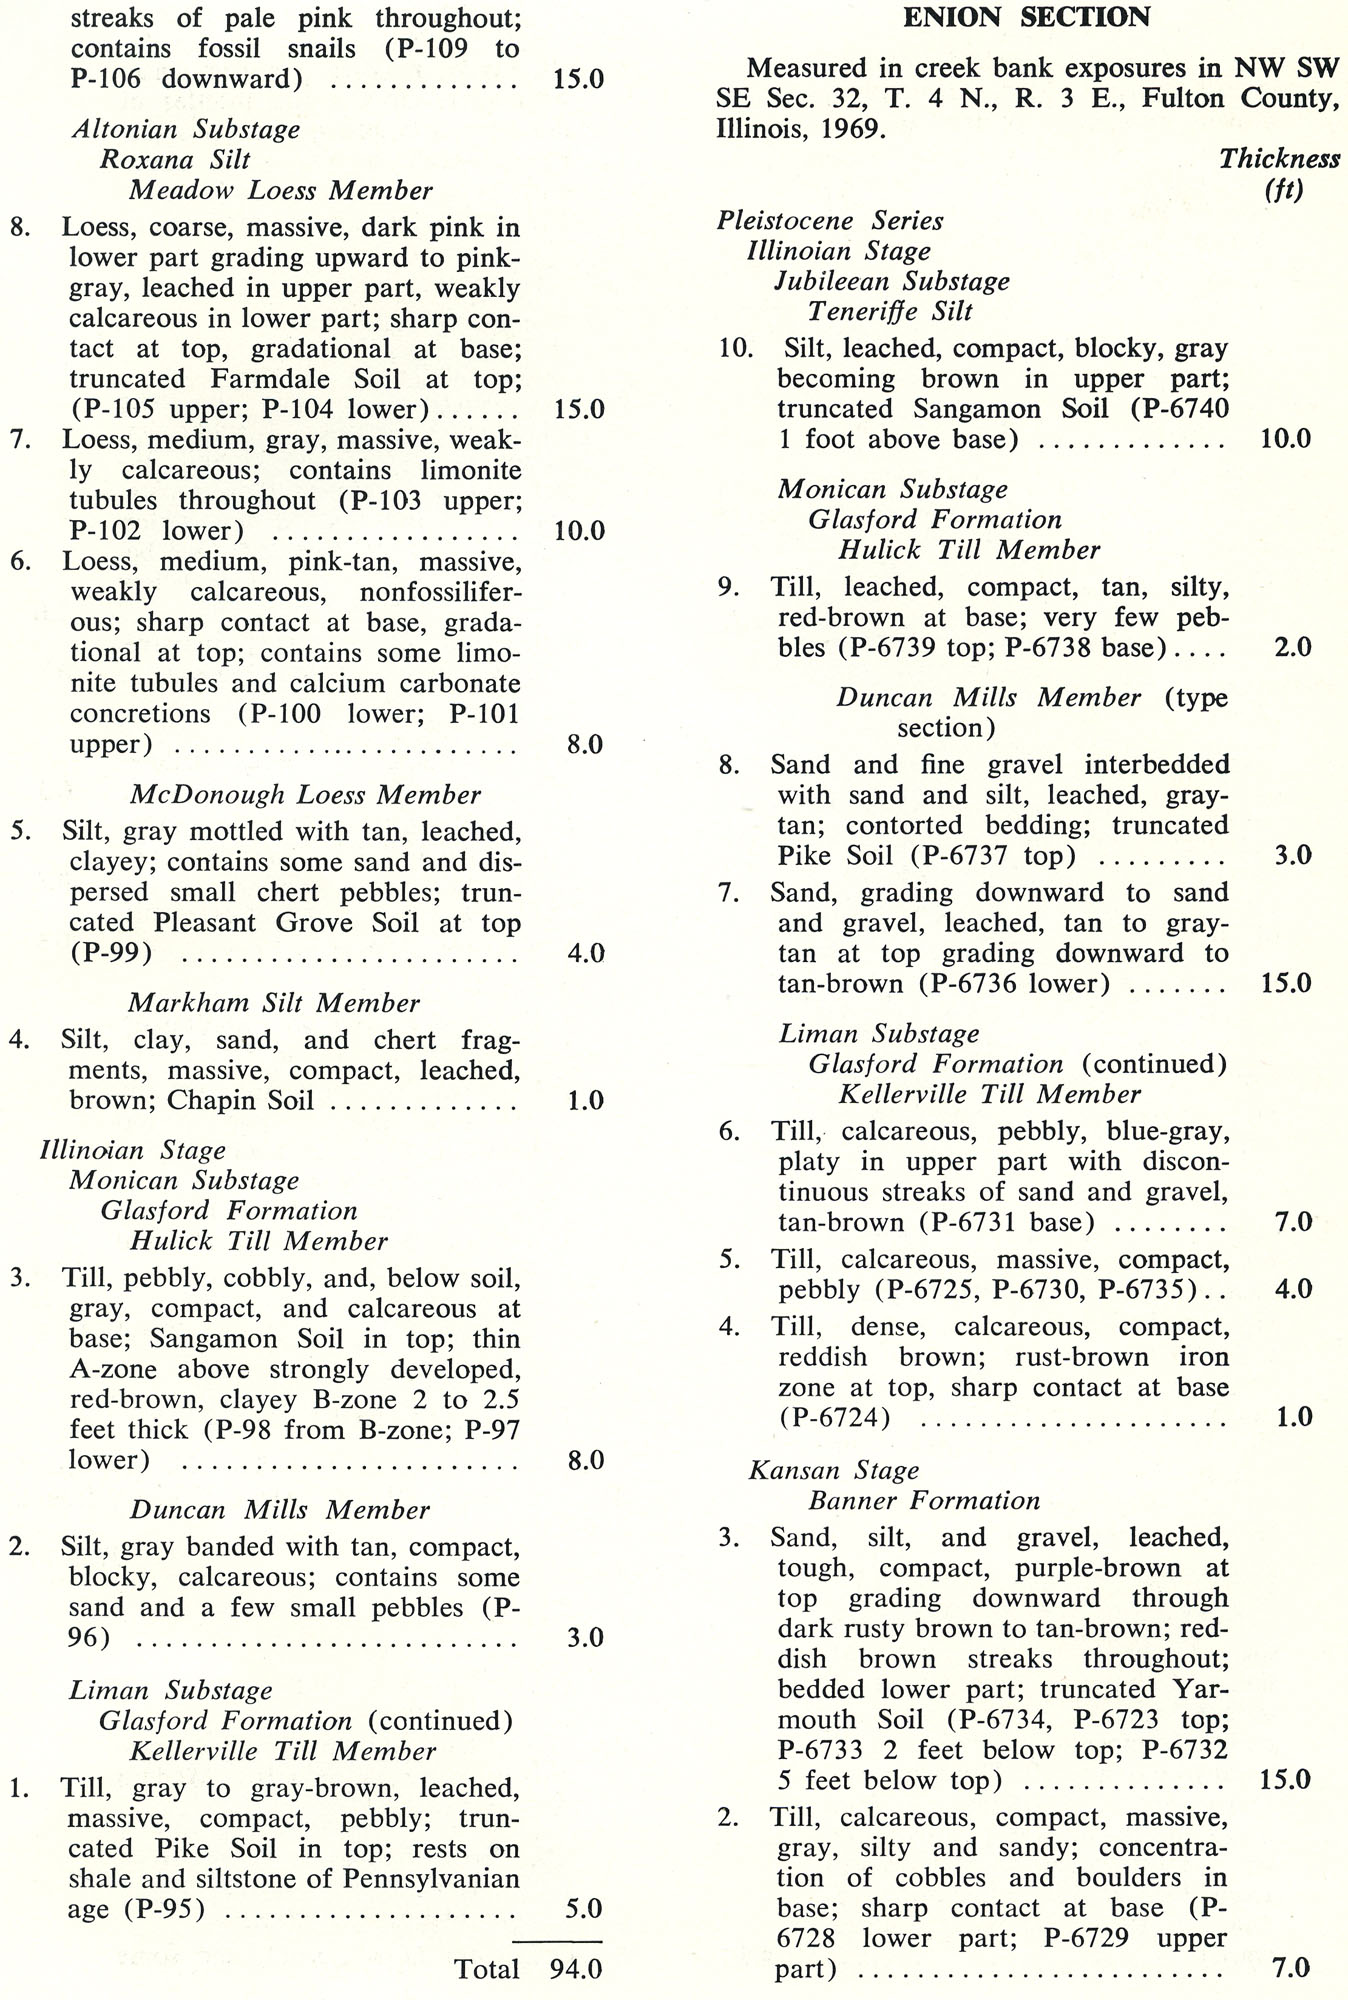
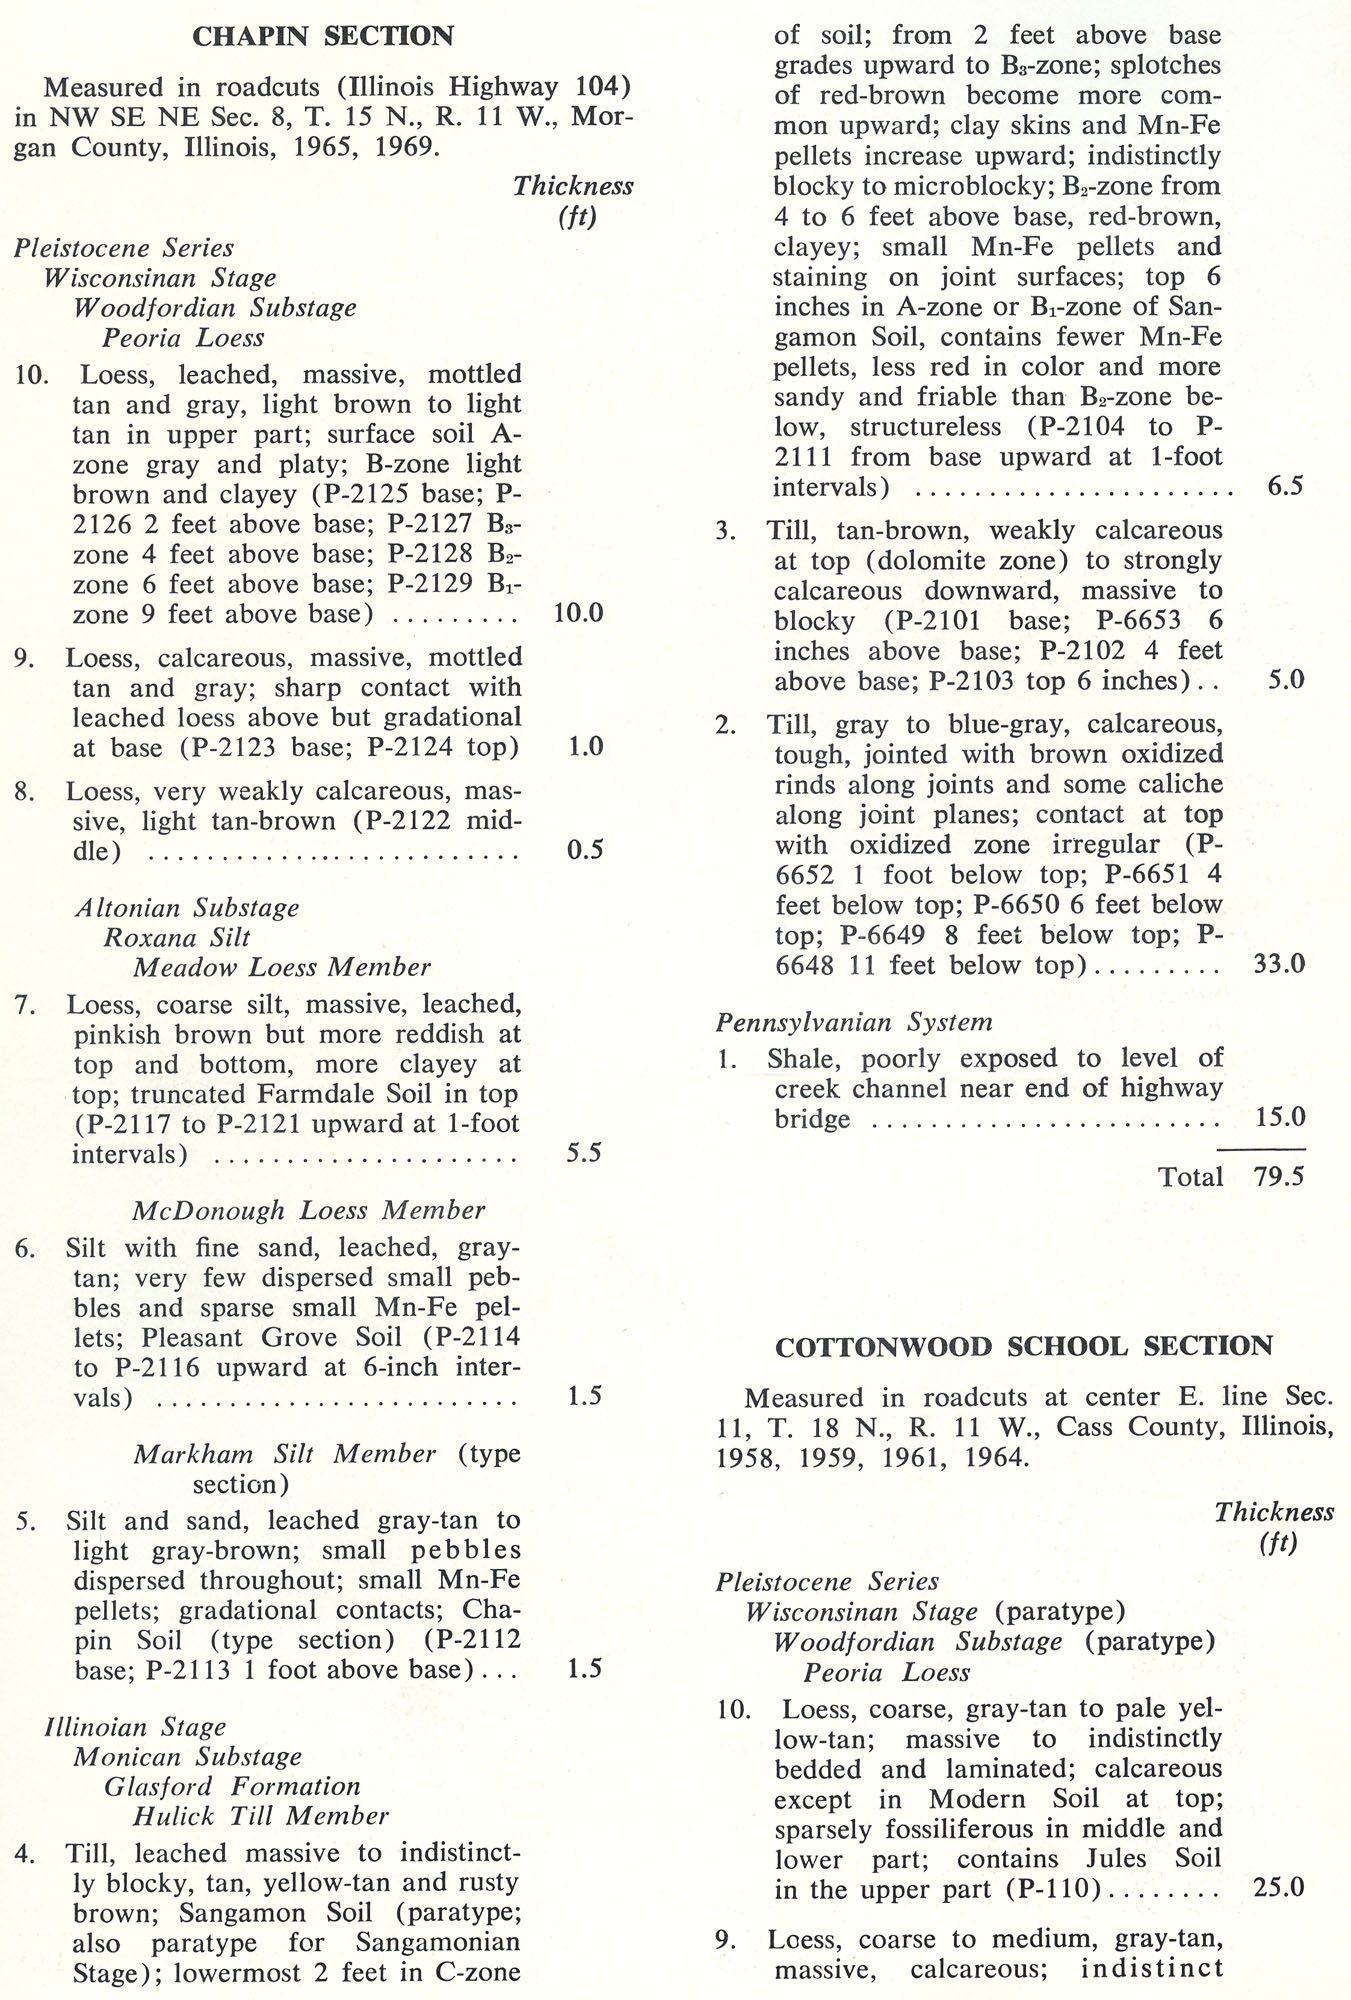
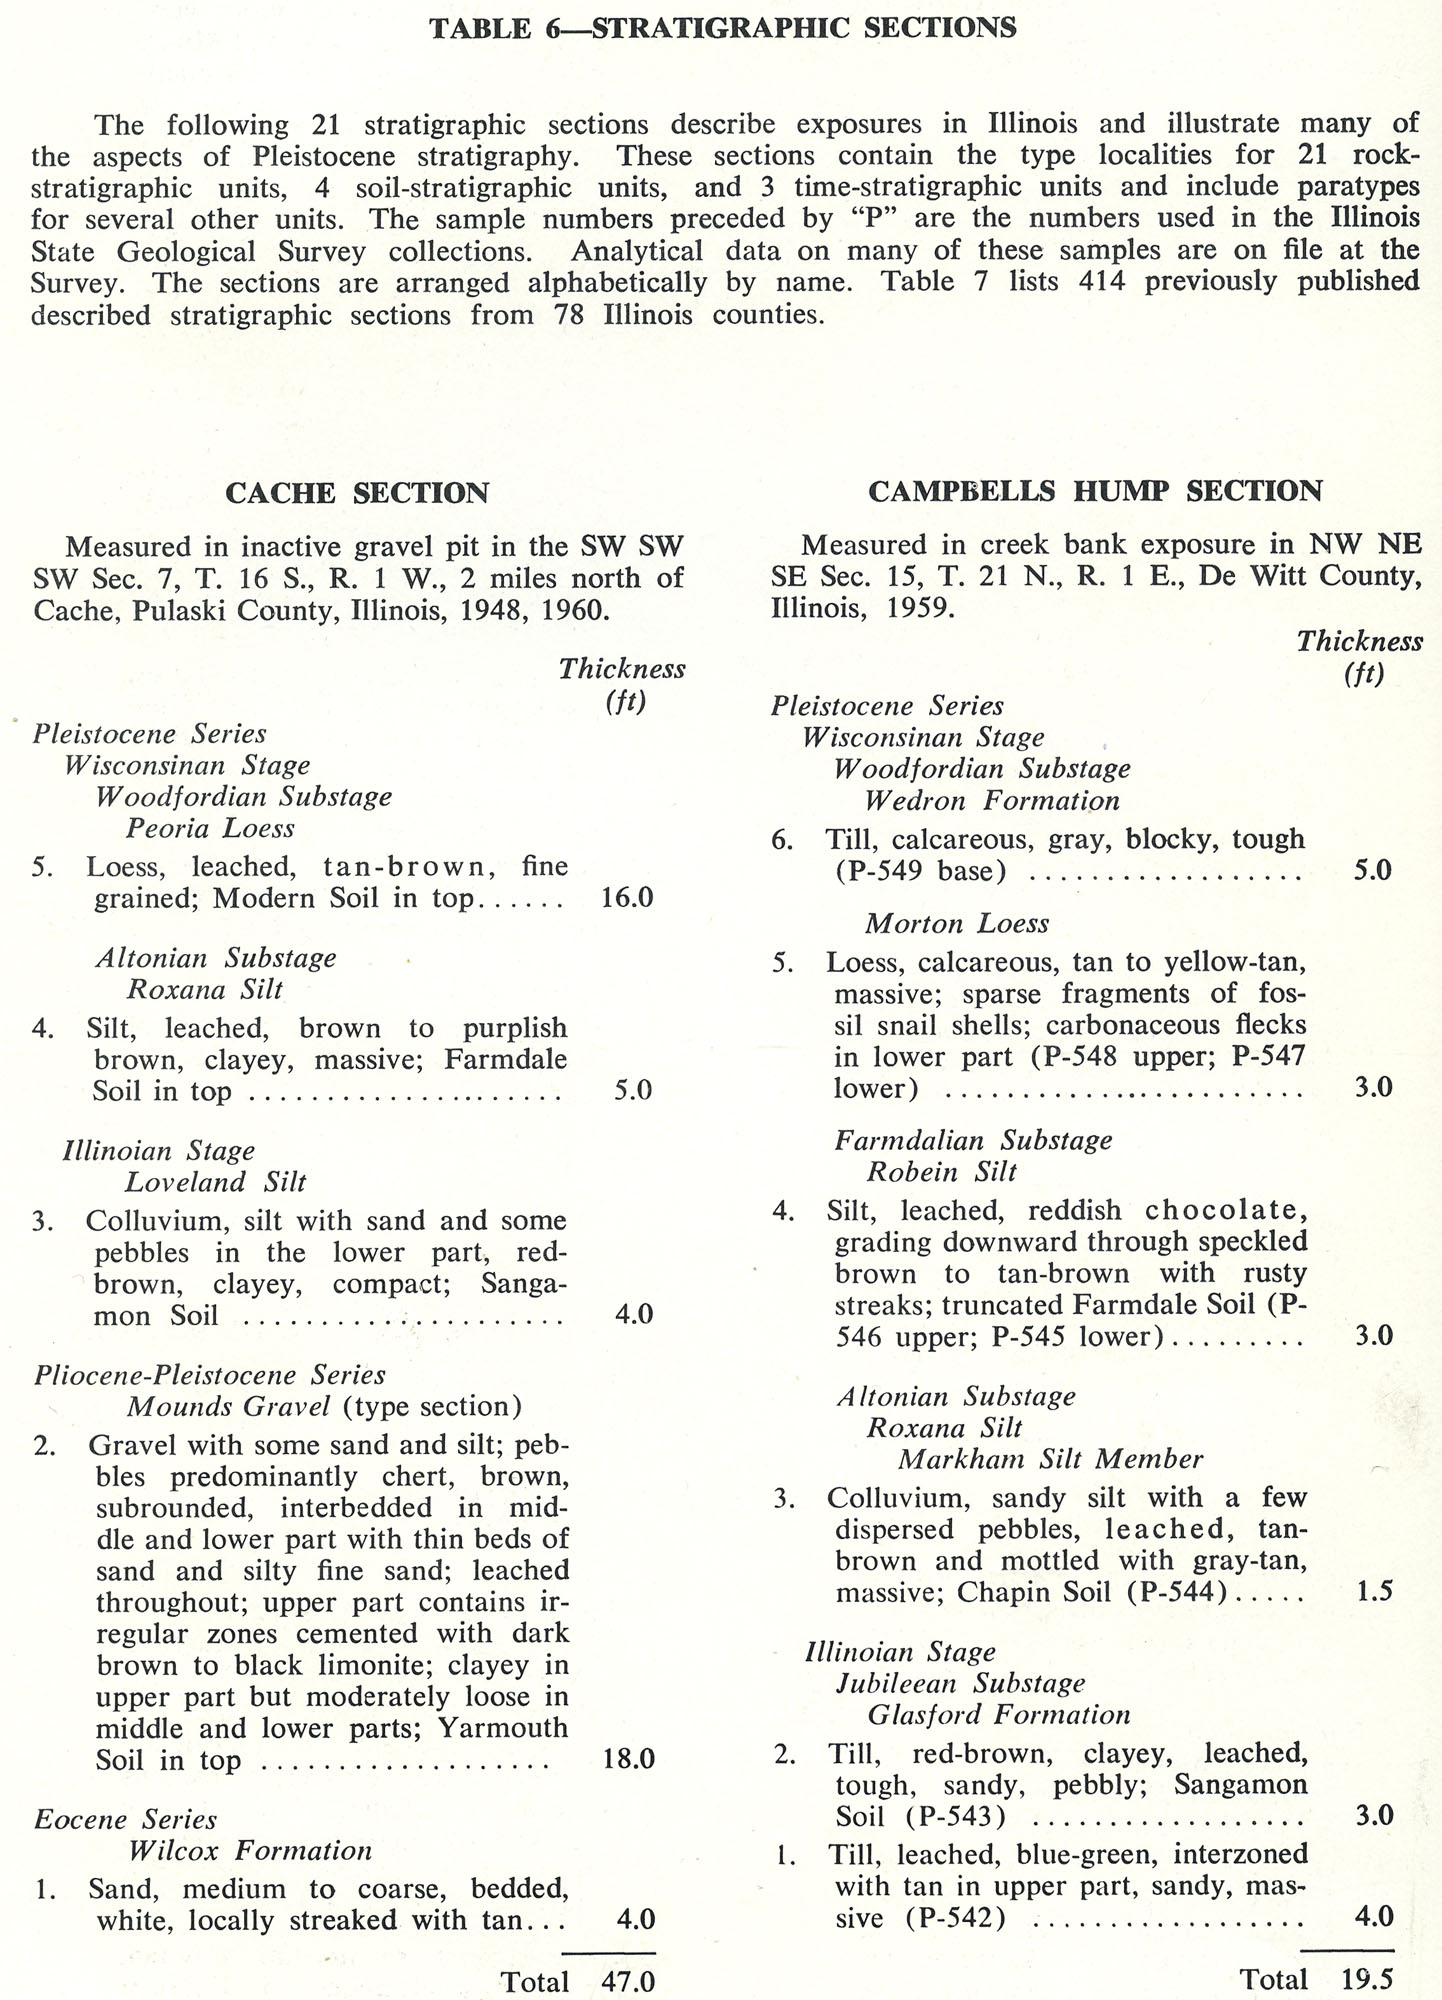
546 KB | Table 6 -- Stratigraphic Sections | 1 |
| 17:13, 18 April 2016 | 94-tb 5-e.jpg (file) |  |
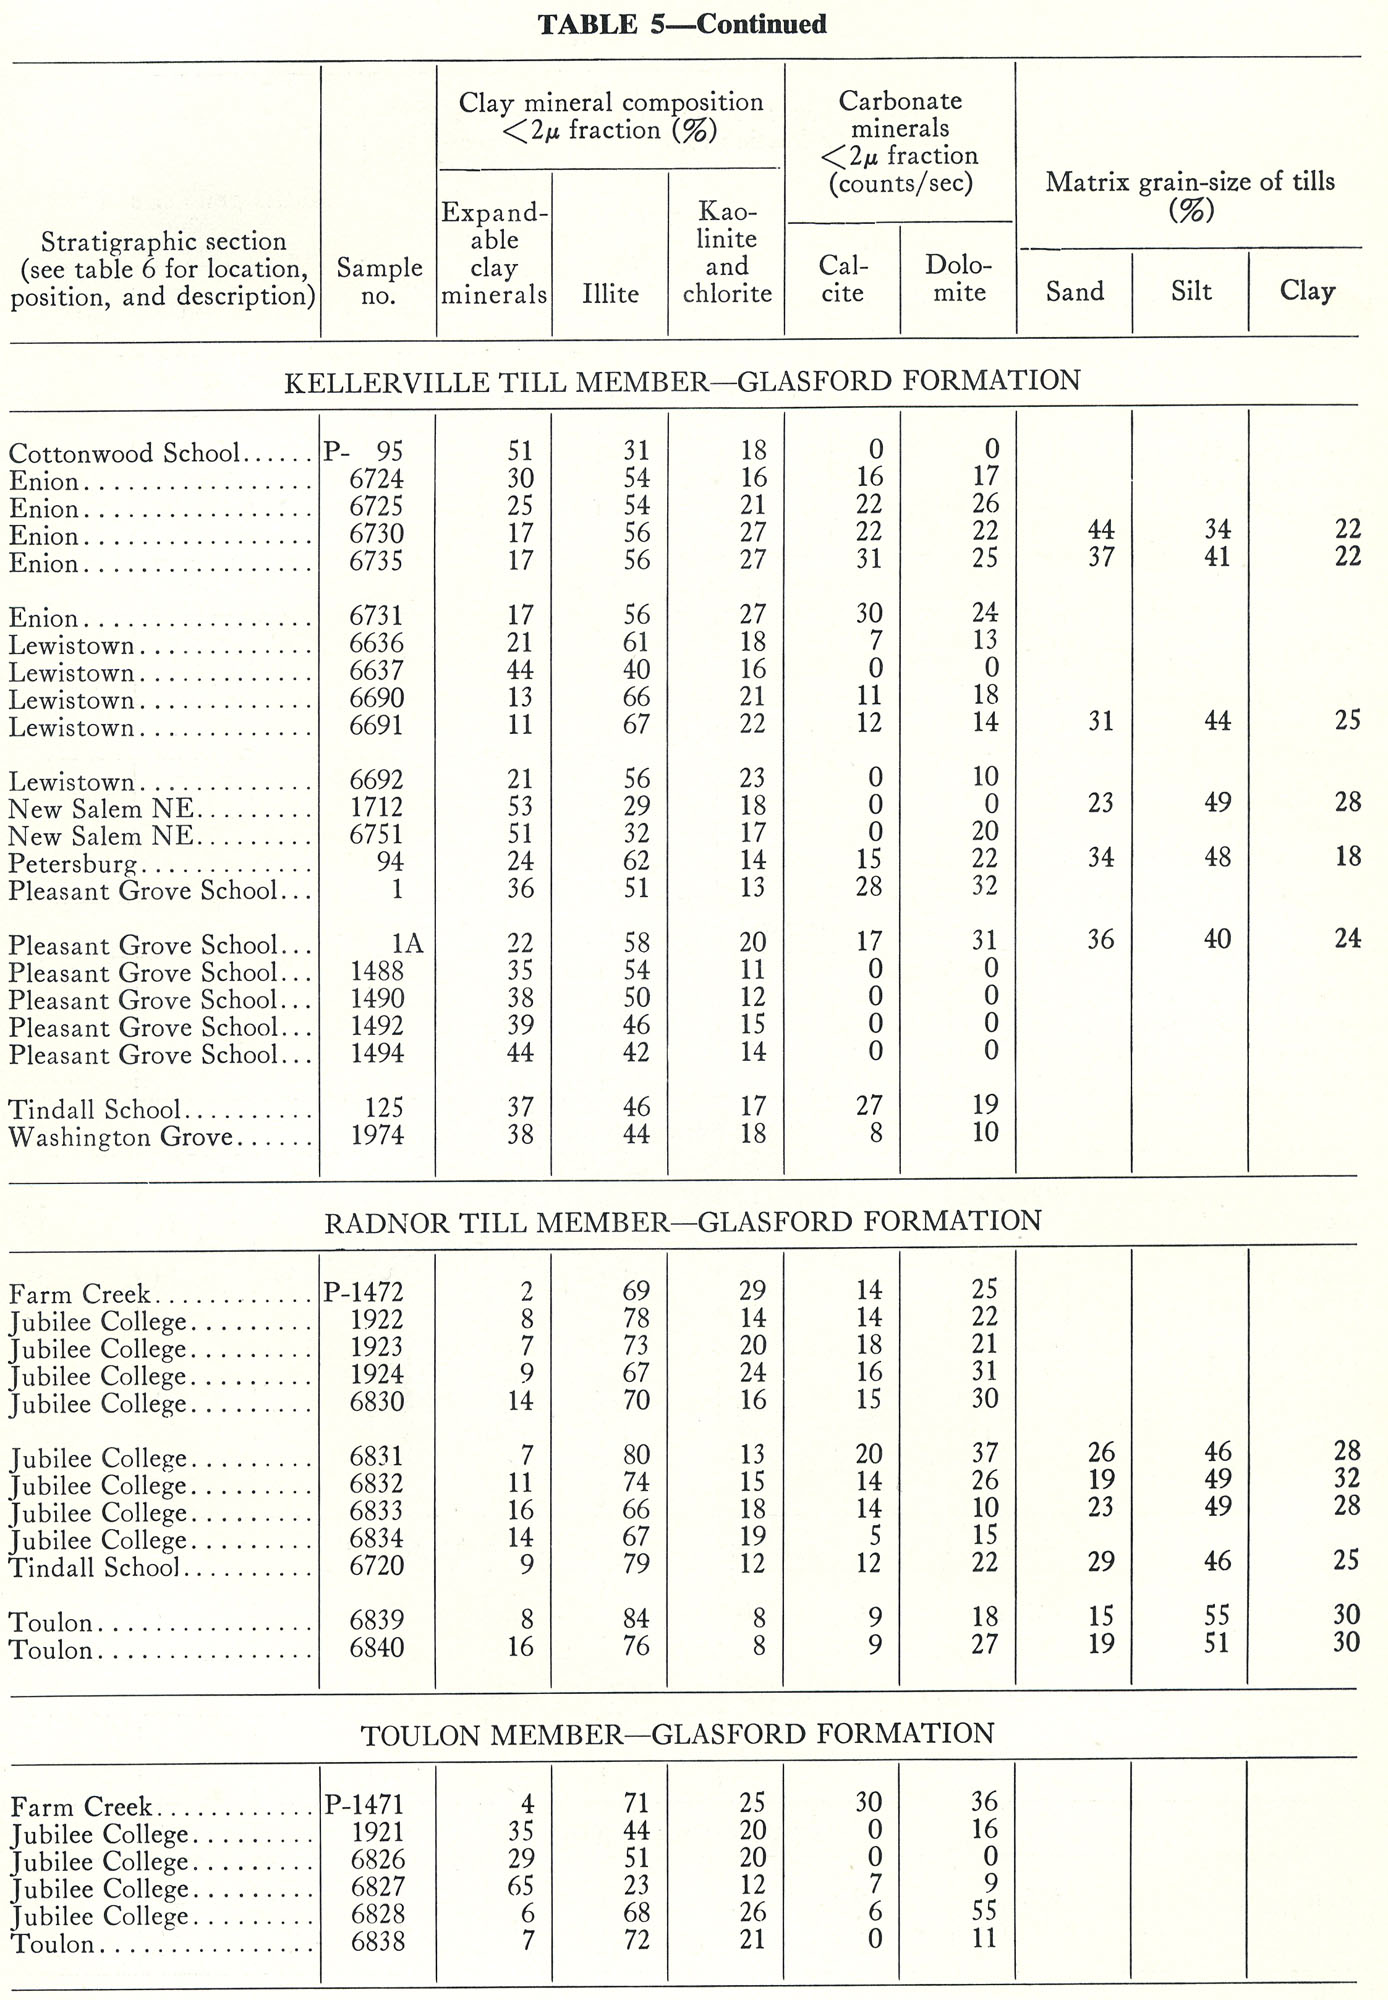
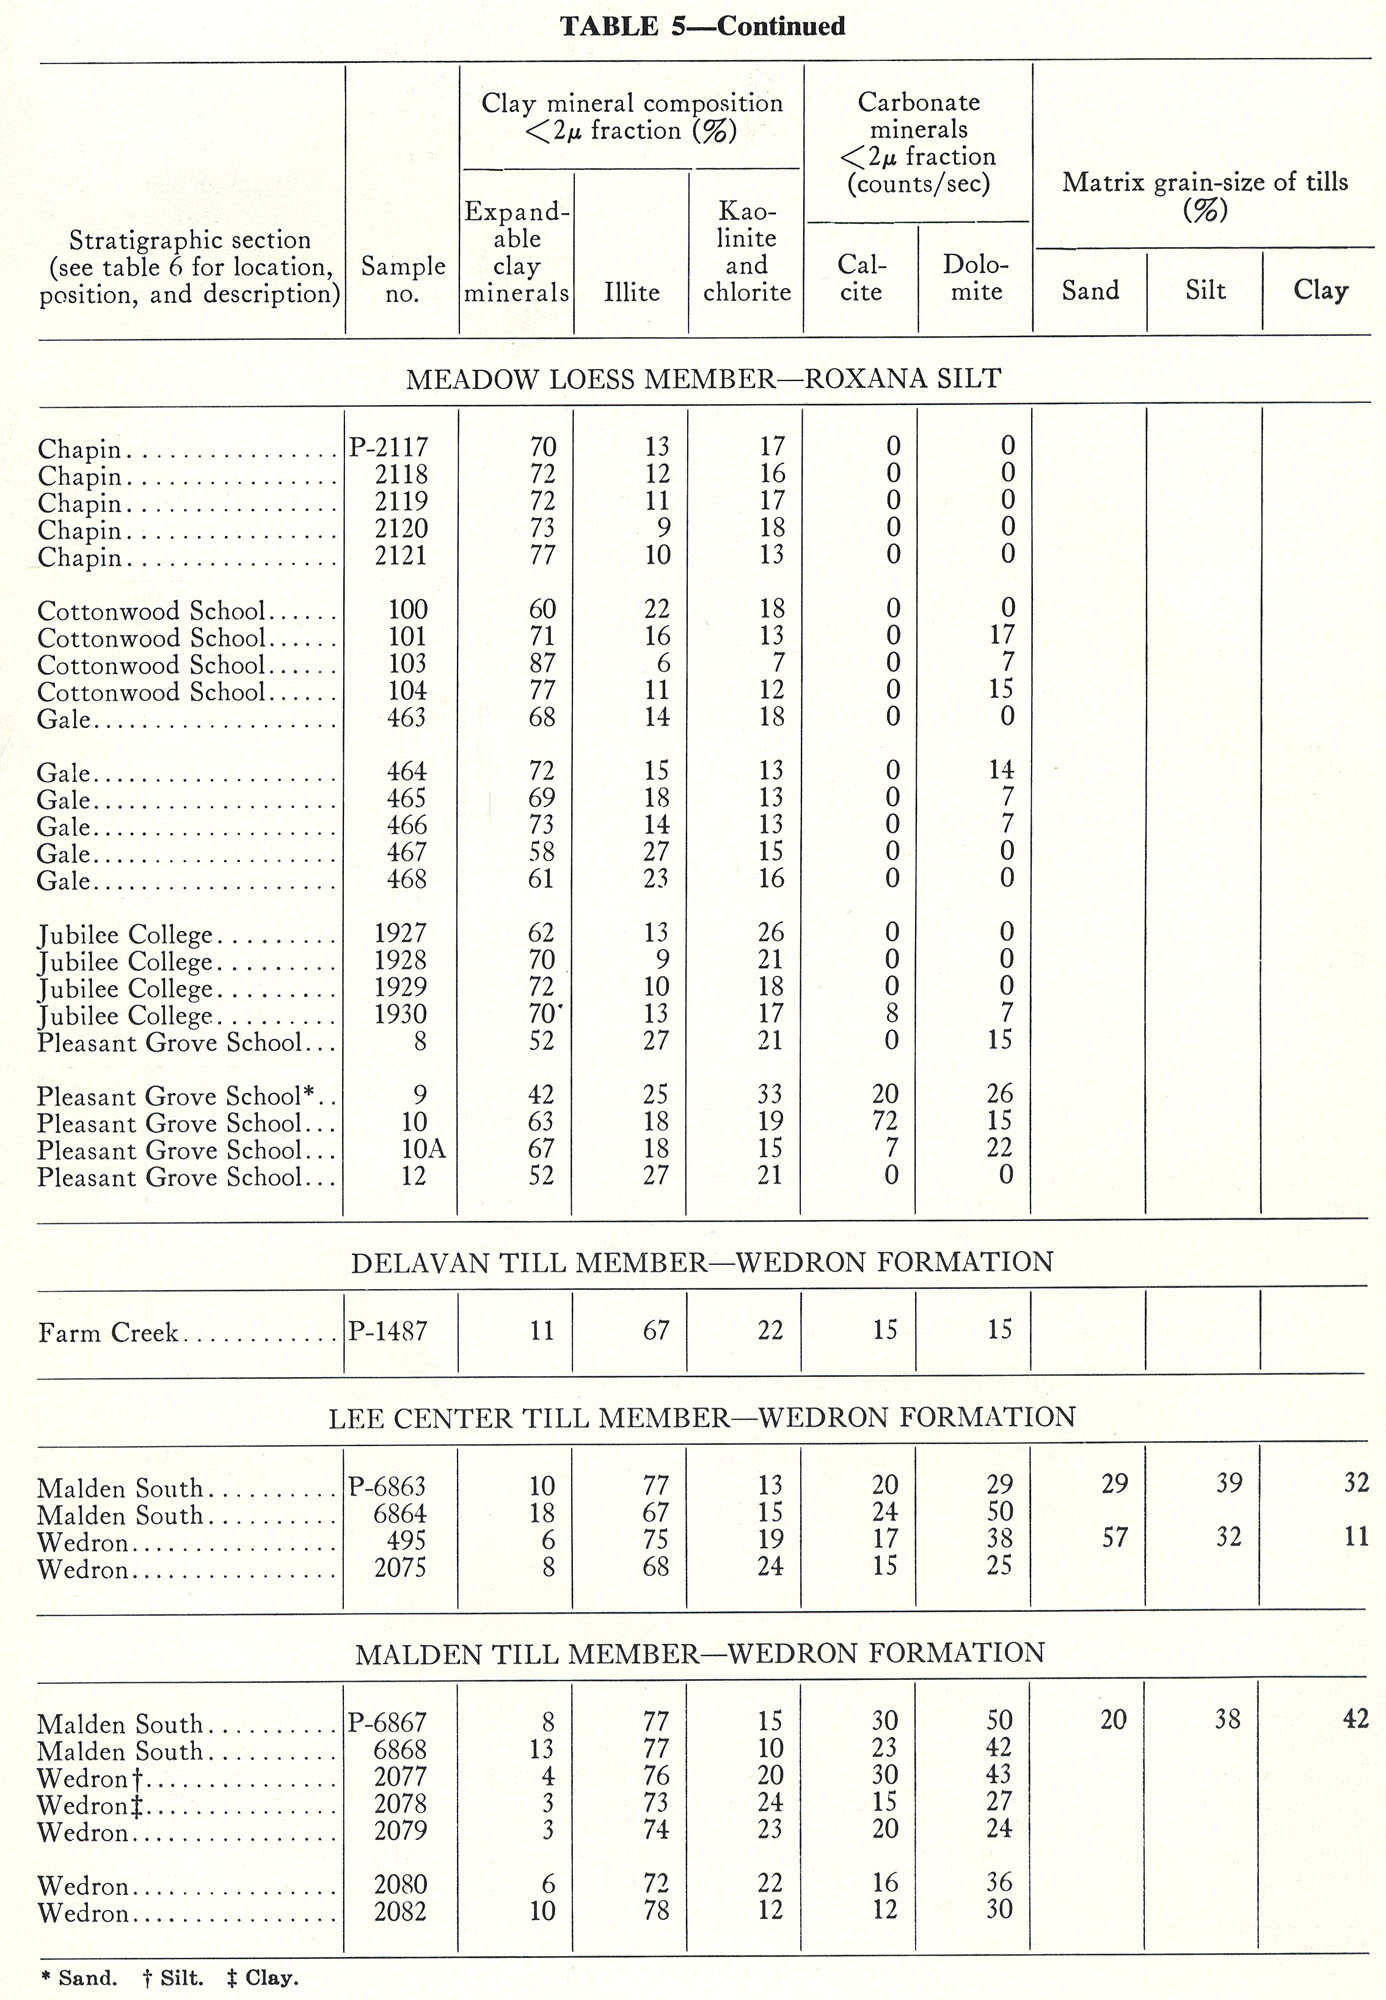
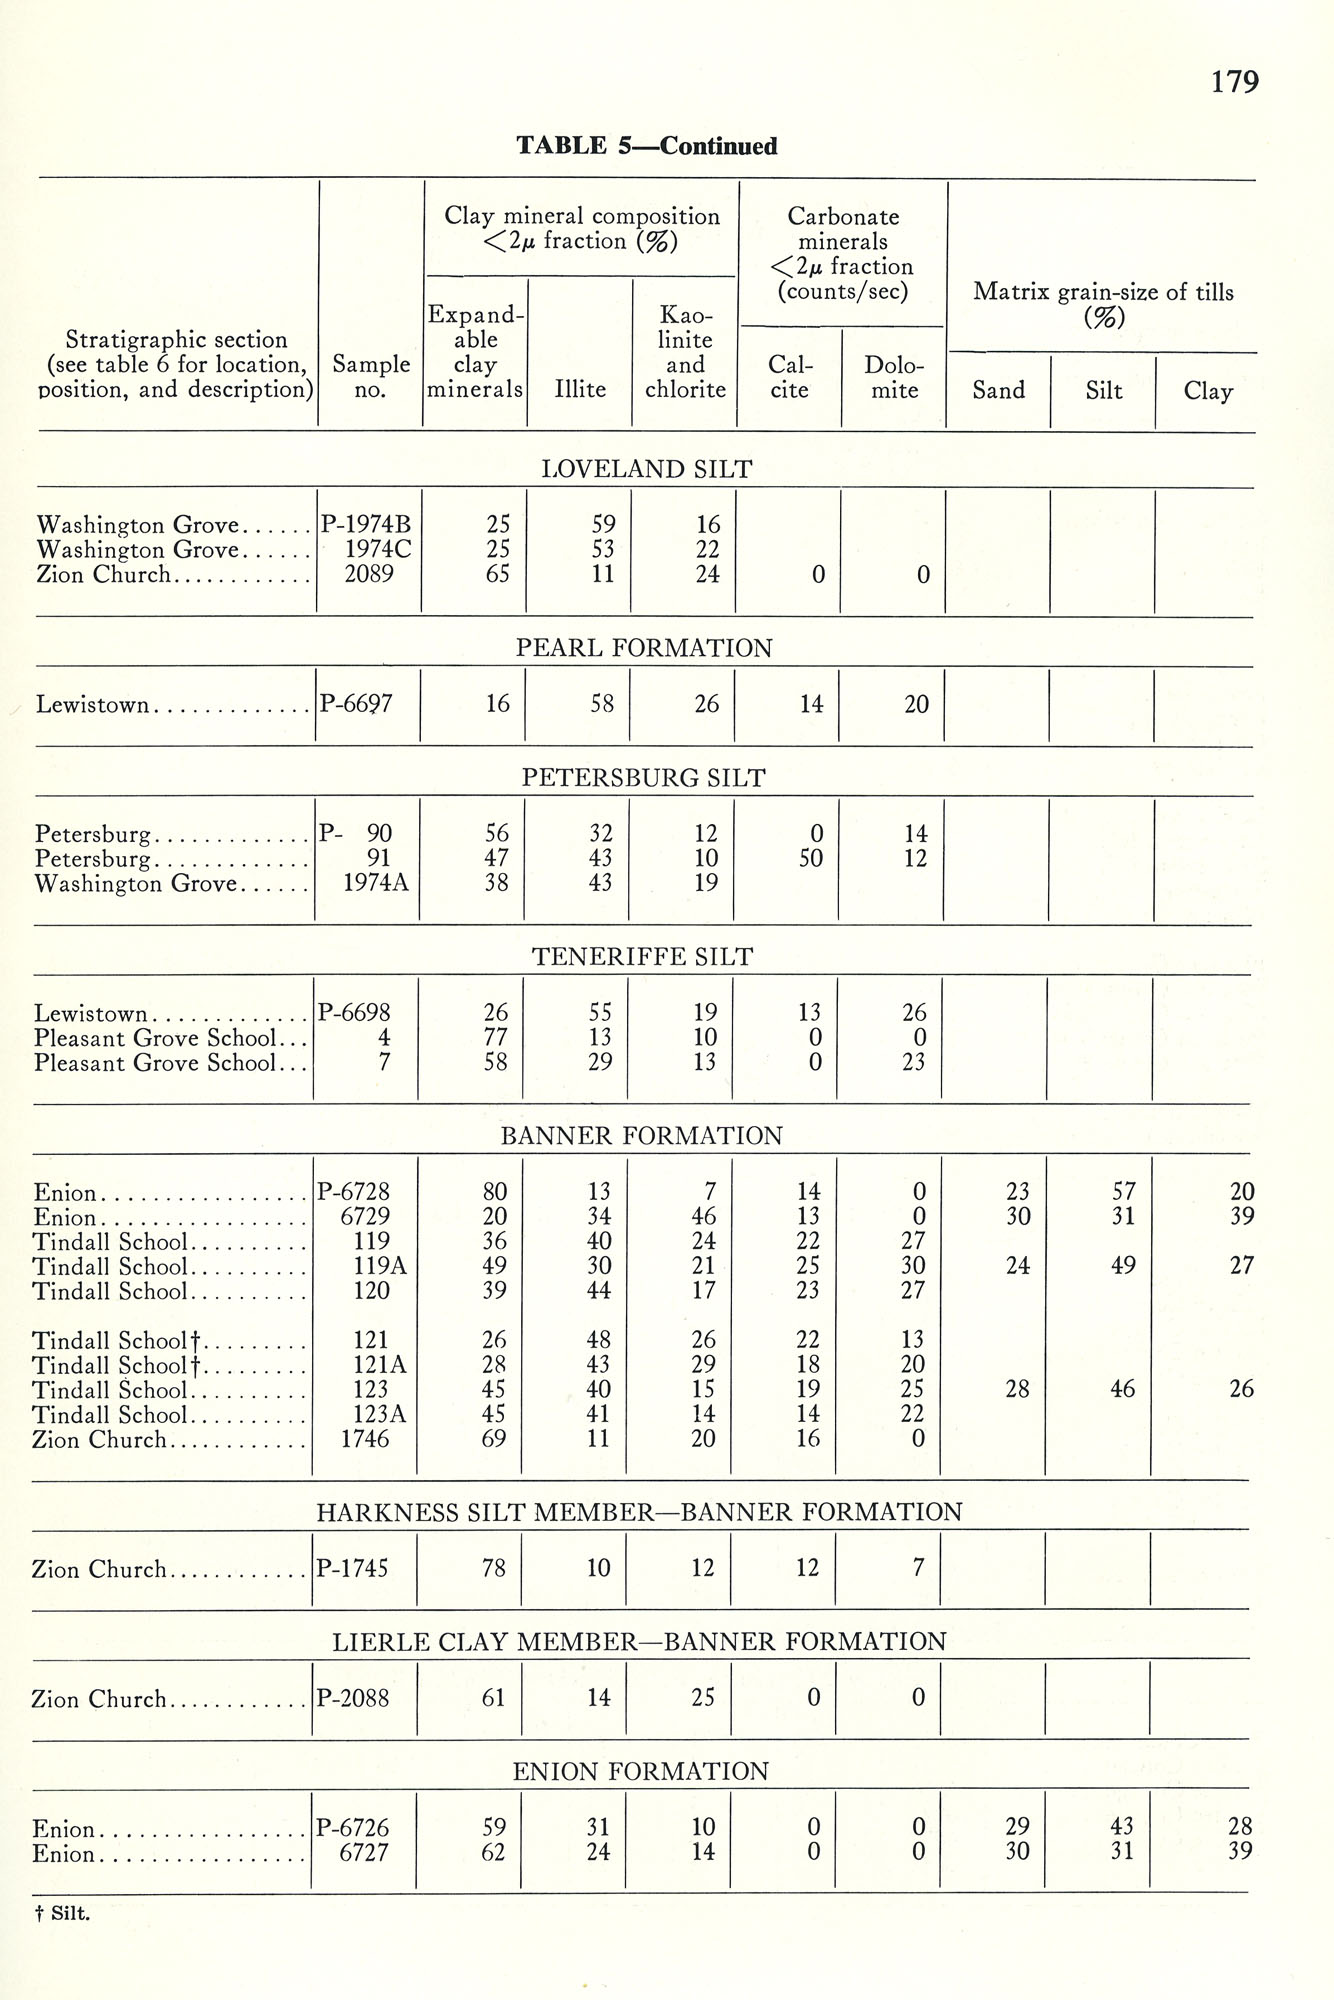
449 KB | Table 5 -- Continued. | 1 |
| 17:12, 18 April 2016 | 94-tb 5-d.jpg (file) |  |
414 KB | Table 5 -- Continued. | 1 |
| 17:11, 18 April 2016 | 94-tb 5-c.jpg (file) |  |
414 KB | Table 5 -- Continued. | 1 |
| 17:11, 18 April 2016 | 94-tb 5-b.jpg (file) |  |
404 KB | Table 5 - Continued. | 1 |
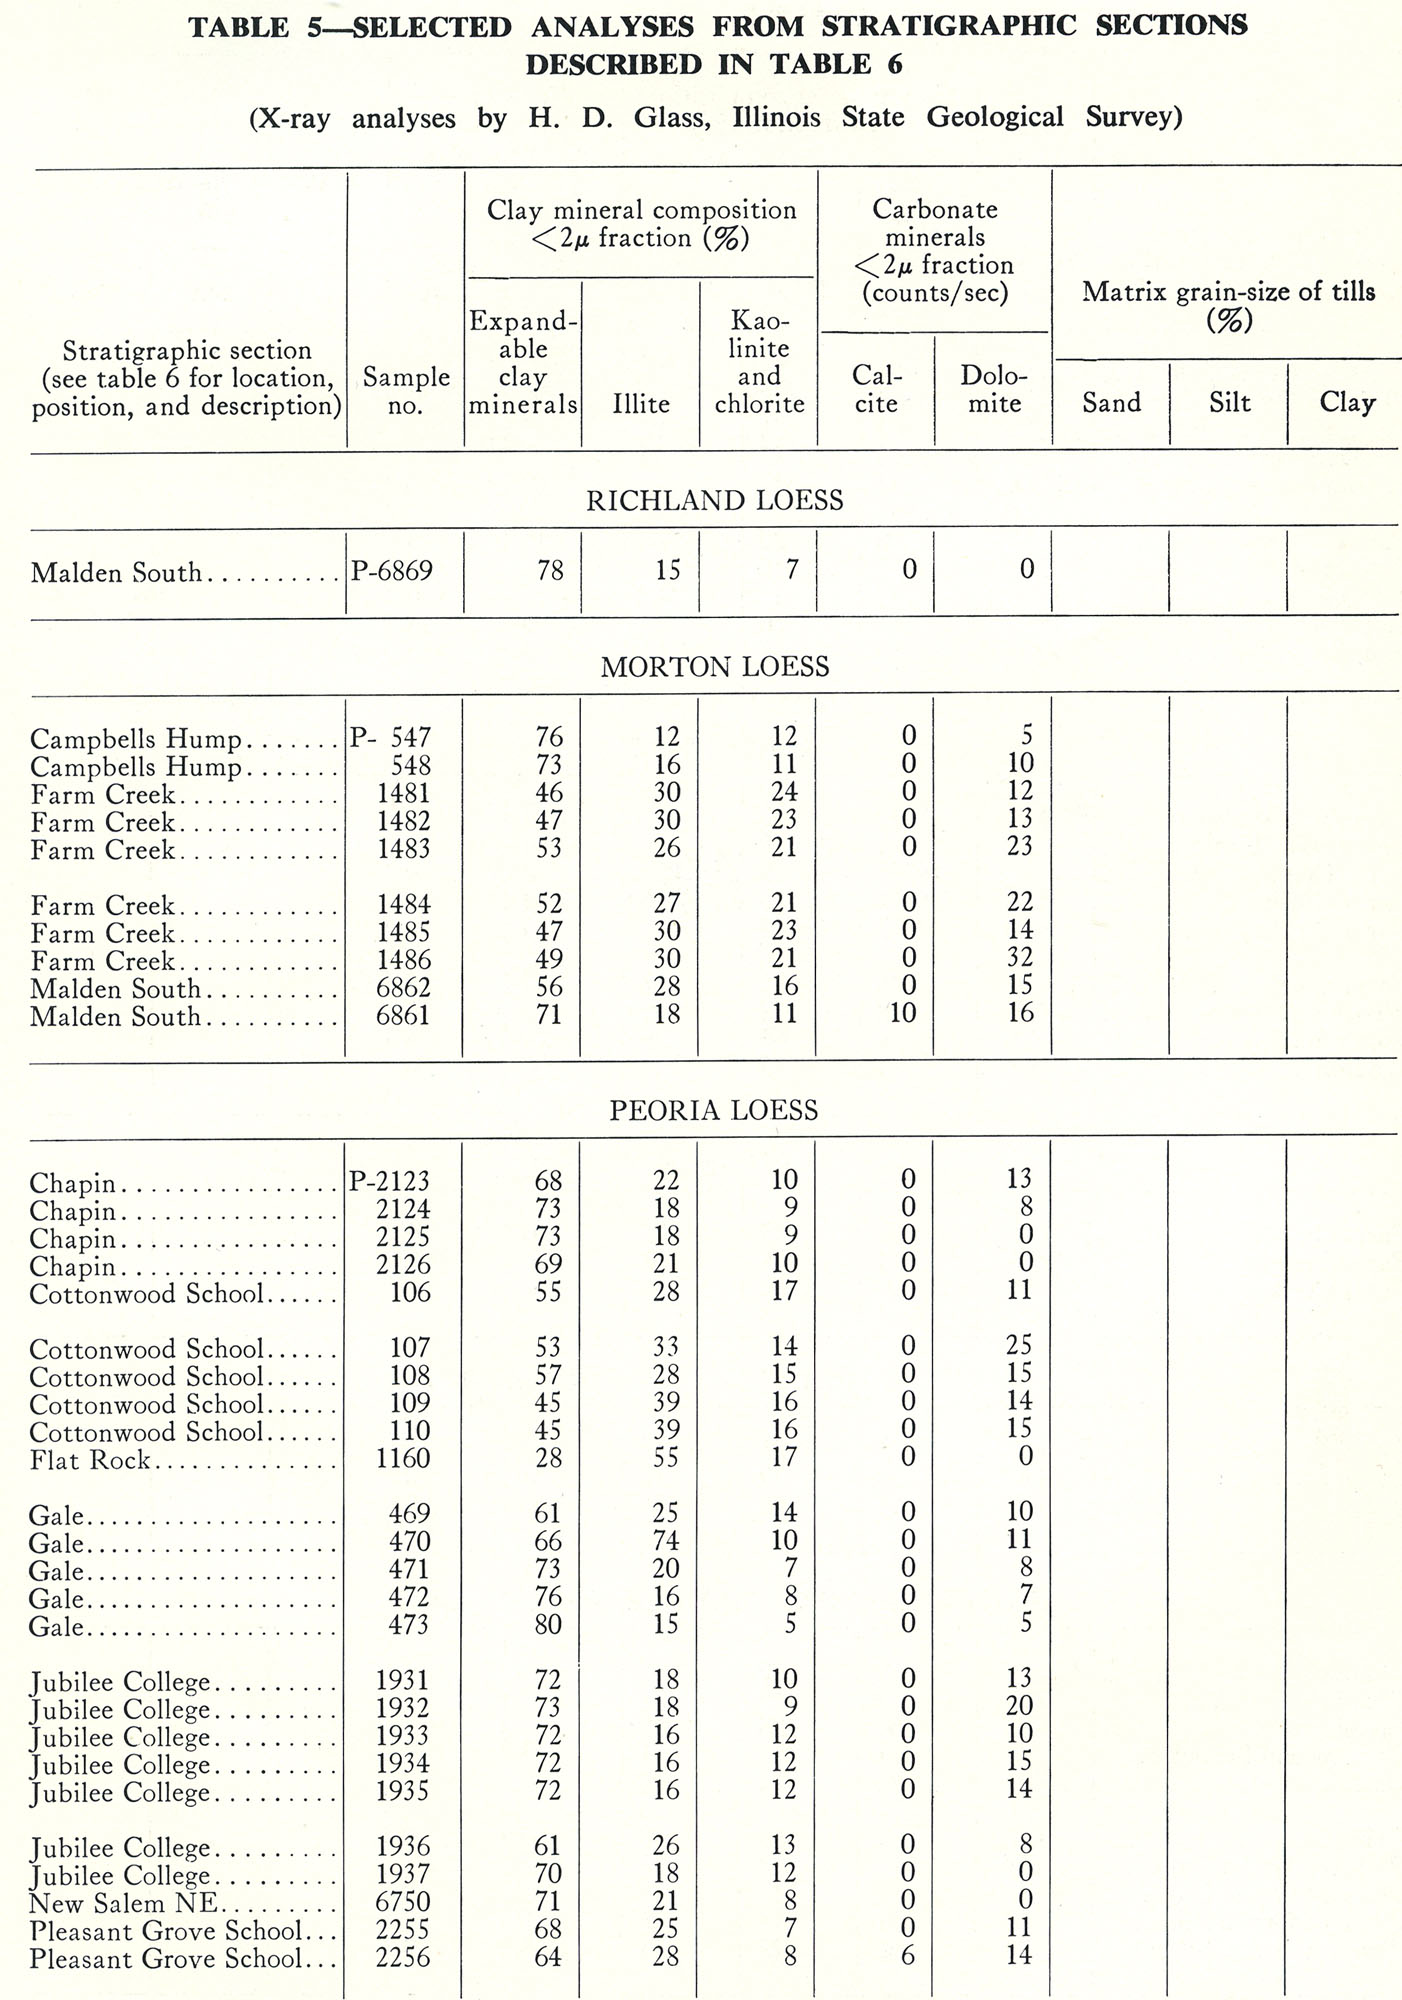
| 17:10, 18 April 2016 | 94-tb 5-a.jpg (file) |  |
410 KB | Table 5 -- Selected Analyses from Stratigraphic Sections Described in Table 6 (X-ray analyses by H. D. Glass, Illinois State Geological Survey). | 1 |
| 17:01, 18 April 2016 | 94-tb 5-.jpg (file) |  |
358 KB | Table 5 -- Continued. | 1 |
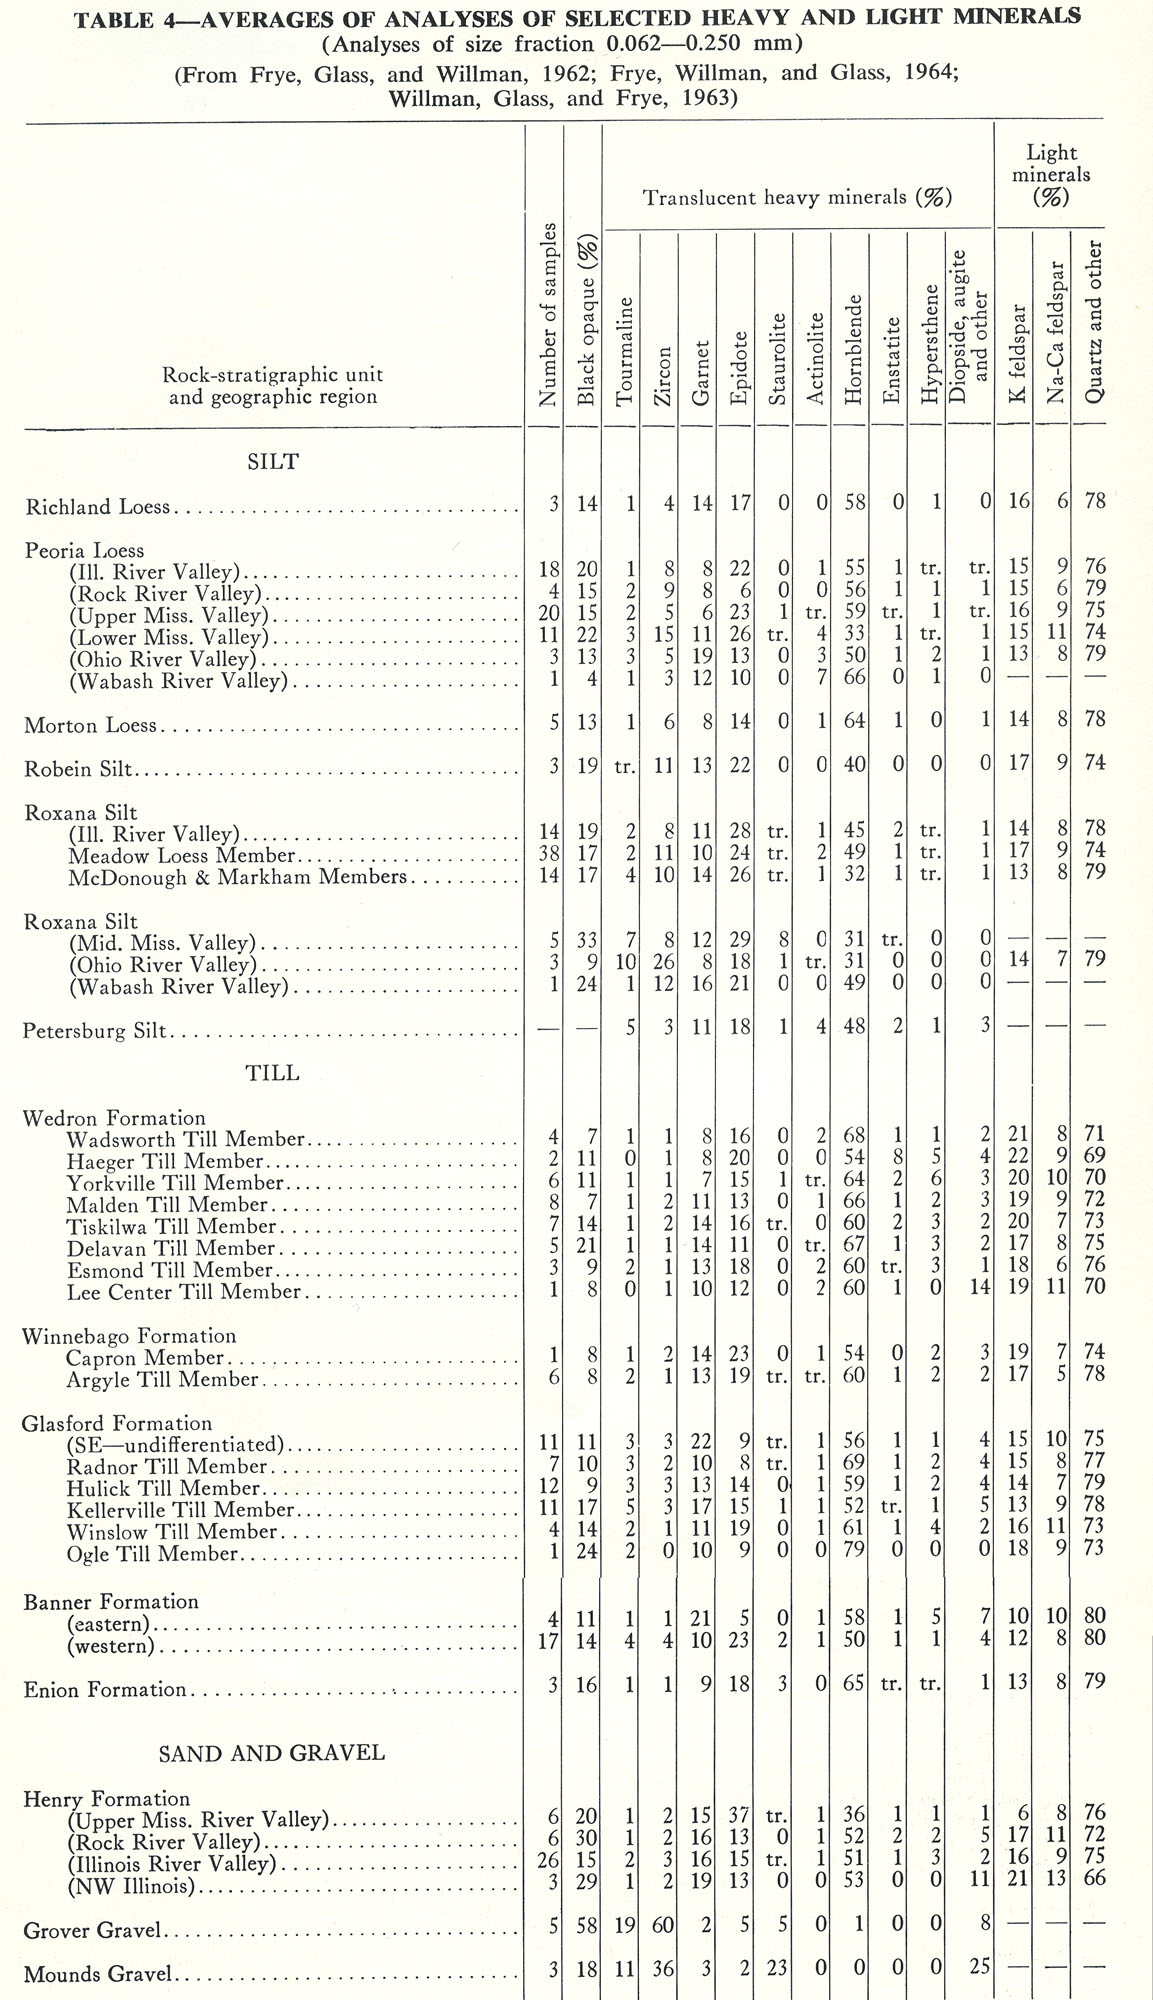
| 16:59, 18 April 2016 | 94-tb 4.jpg (file) |  |
452 KB | Table 4 -- Averages of Analyses of Selected Heavy and Light Minerals (Analyses of size fraction 0.062-0.250 mm). (From Frye, Glass, and Willman, 1962; Frye, Willman, and Glass, 1964; Willman, Glass, and Frye, 1963) | 1 |
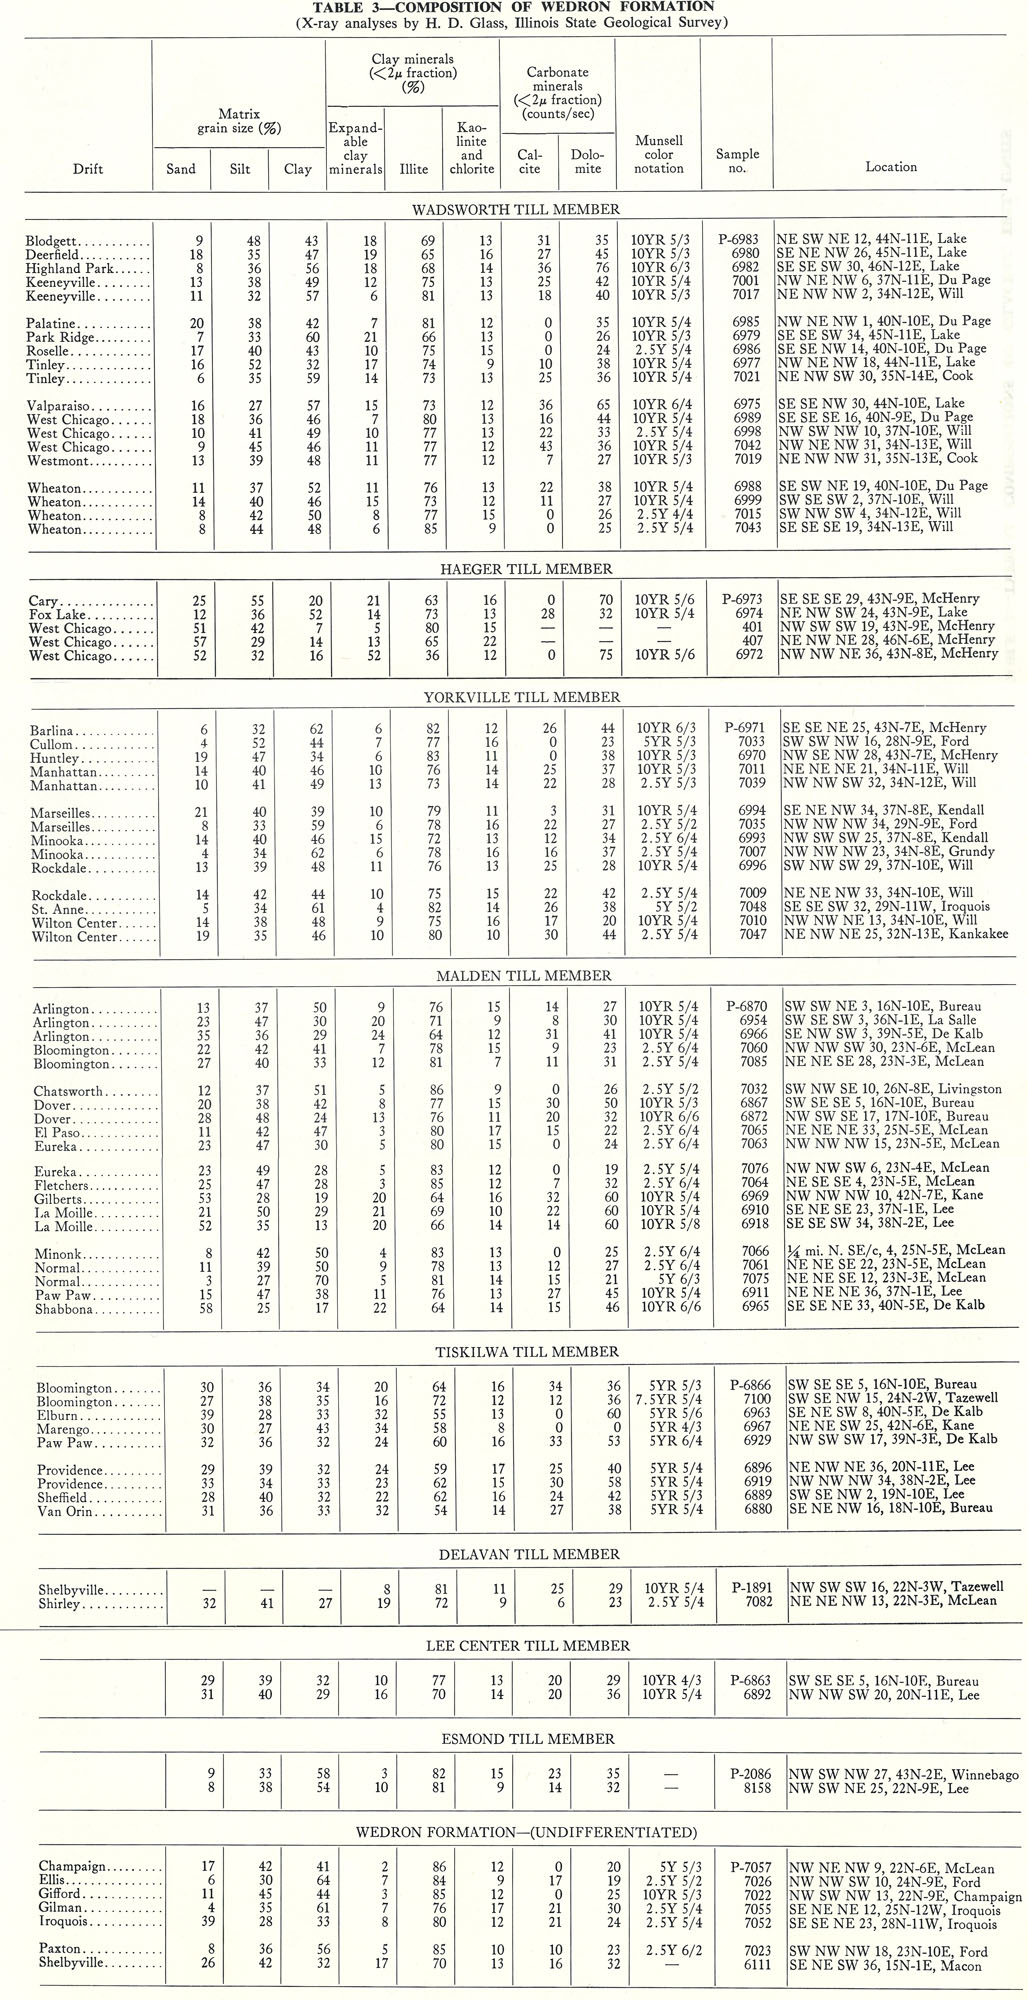
| 16:57, 18 April 2016 | 94-tb 3.jpg (file) |  |
516 KB | Table 3 -- Composition of Wedron Formation (X-ray analyses by H. D. Glass, Illinois State Geological Survey). | 1 |
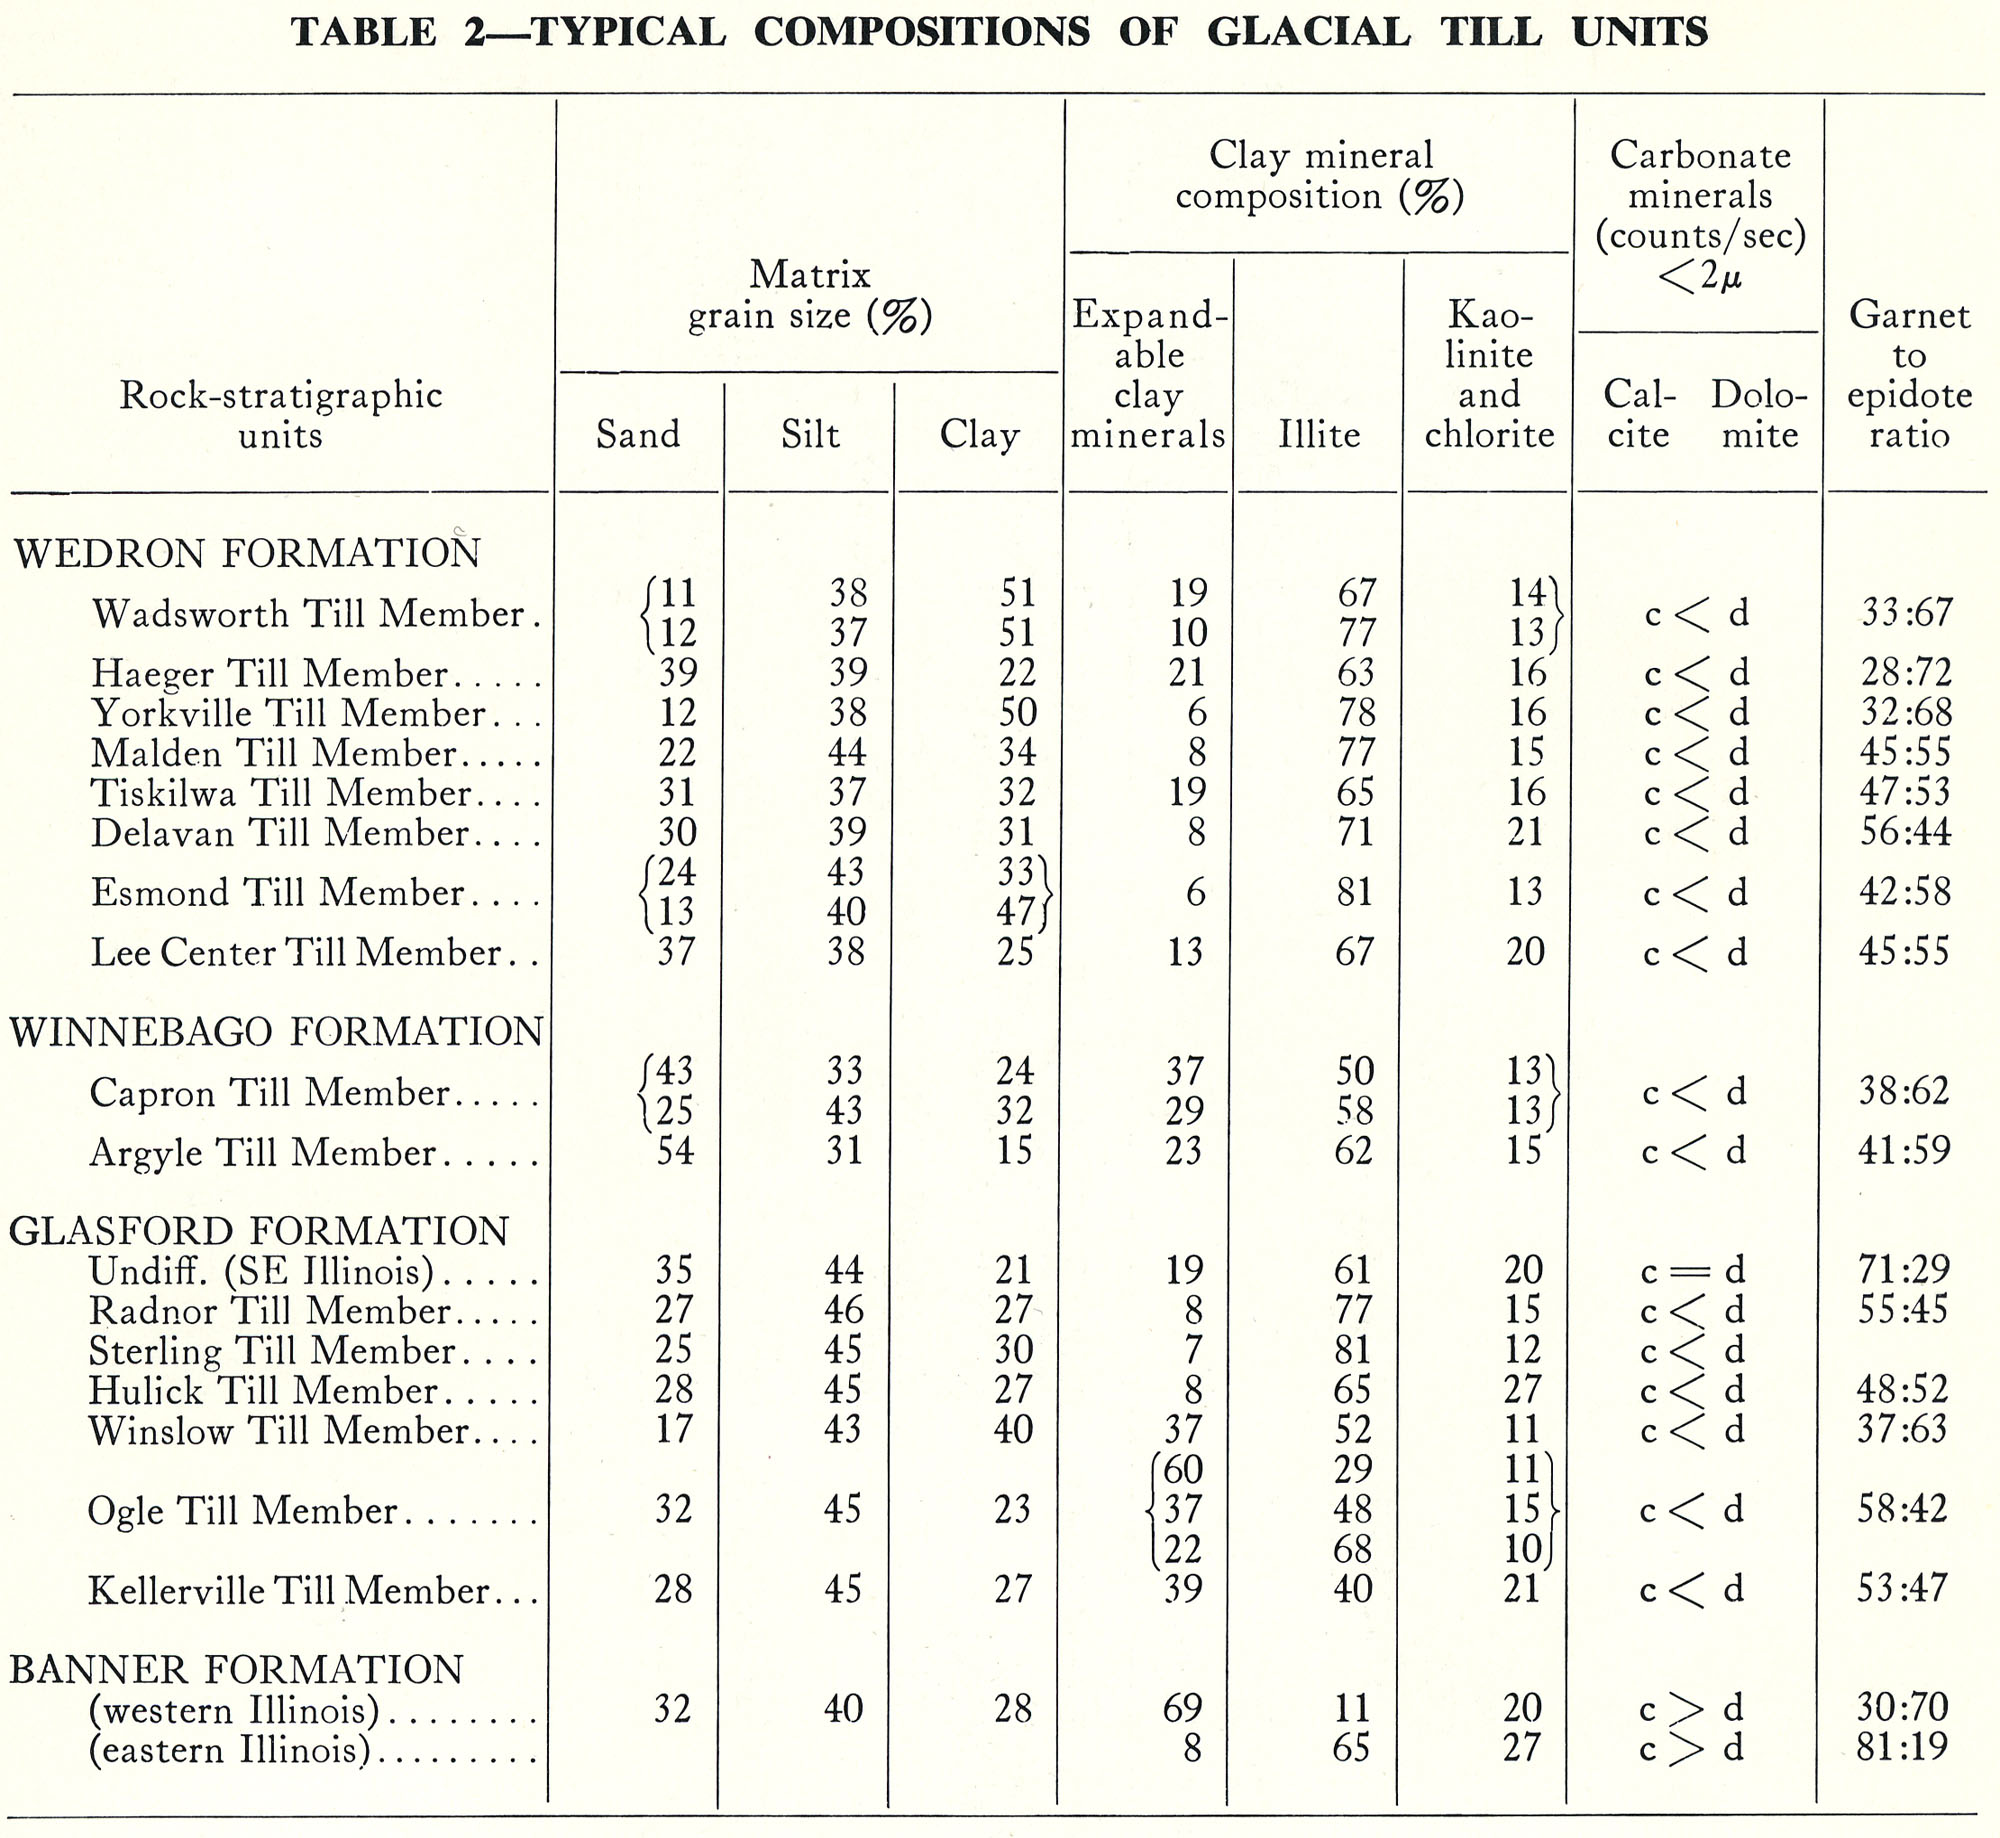
| 16:55, 18 April 2016 | 94-tb 2.jpg (file) |  |
508 KB | Table 2 -- Typical Compositions of Glacial Till Units. | 1 |
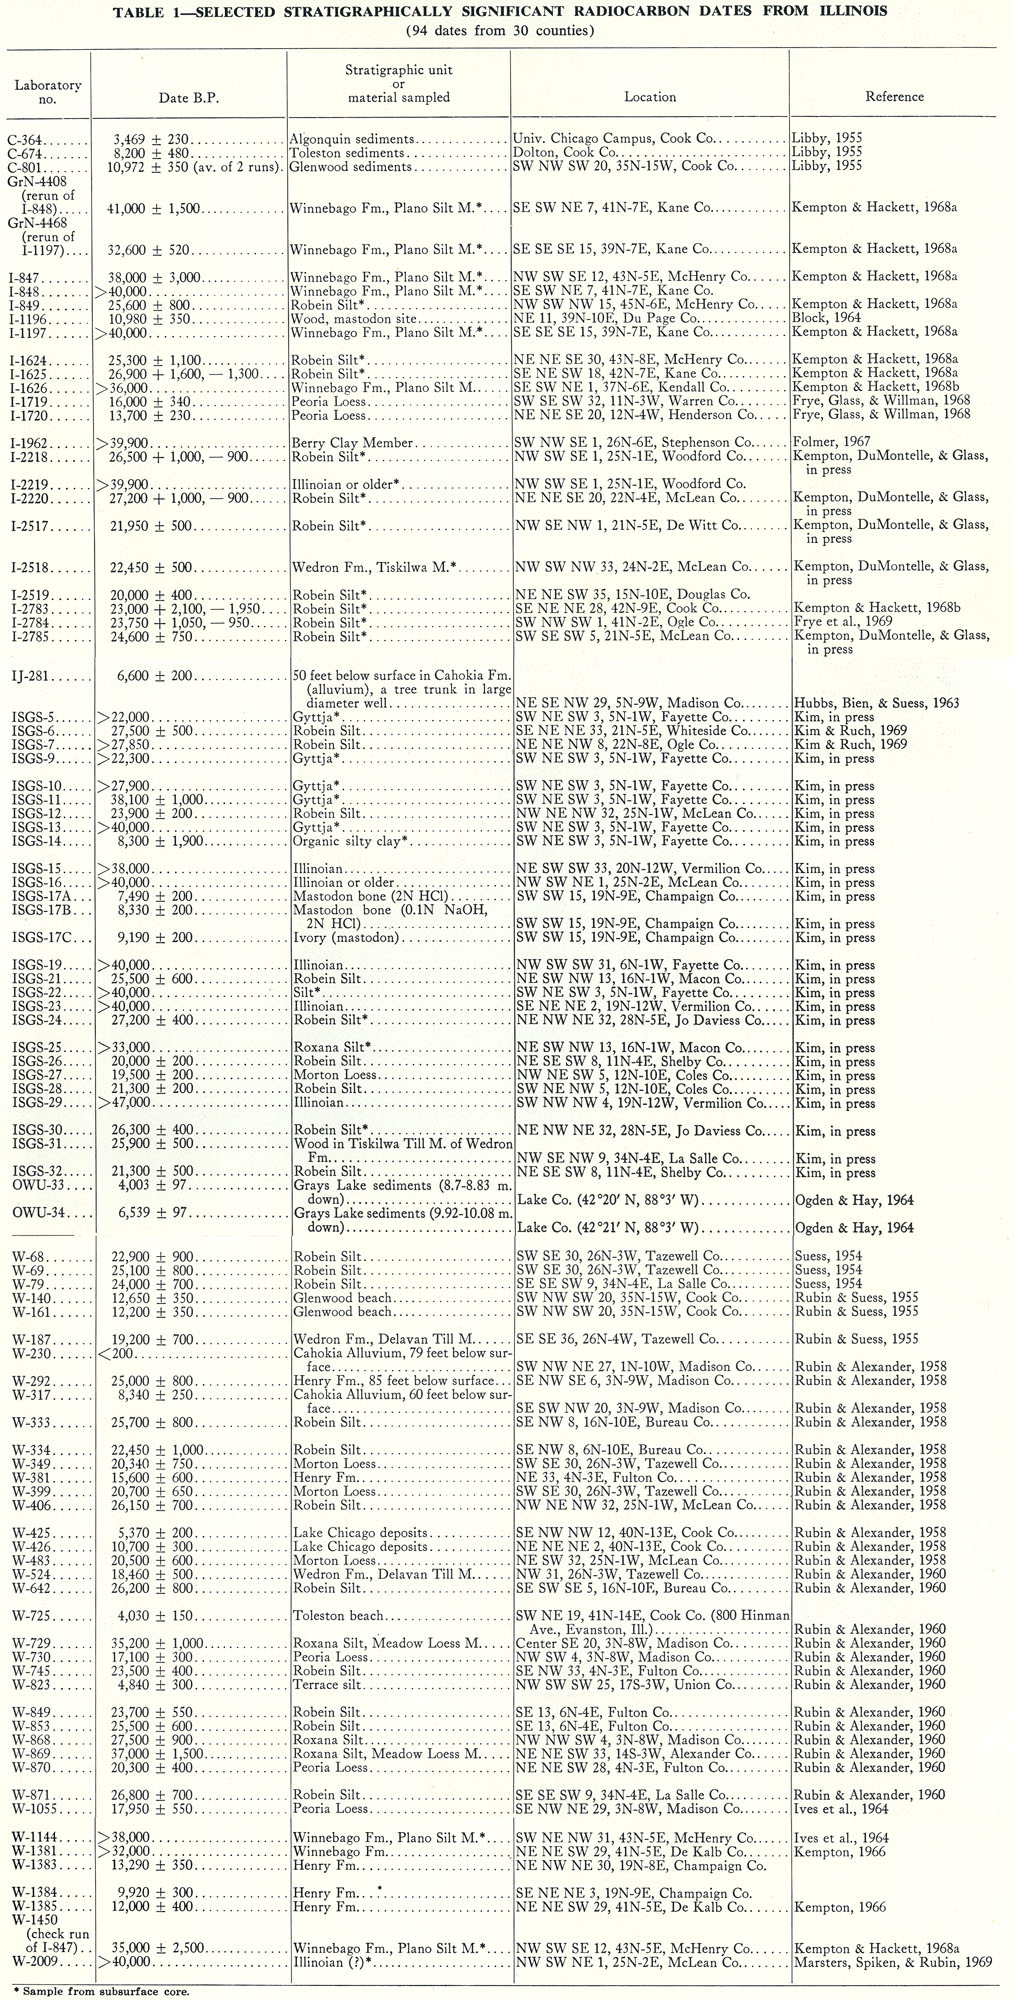
| 16:54, 18 April 2016 | 94-tb 1.jpg (file) |  |
657 KB | Table 1 -- Selected Stratigraphically Significant Radiocarbon Dates From Illinois (94 dates from 30 counties). | 1 |
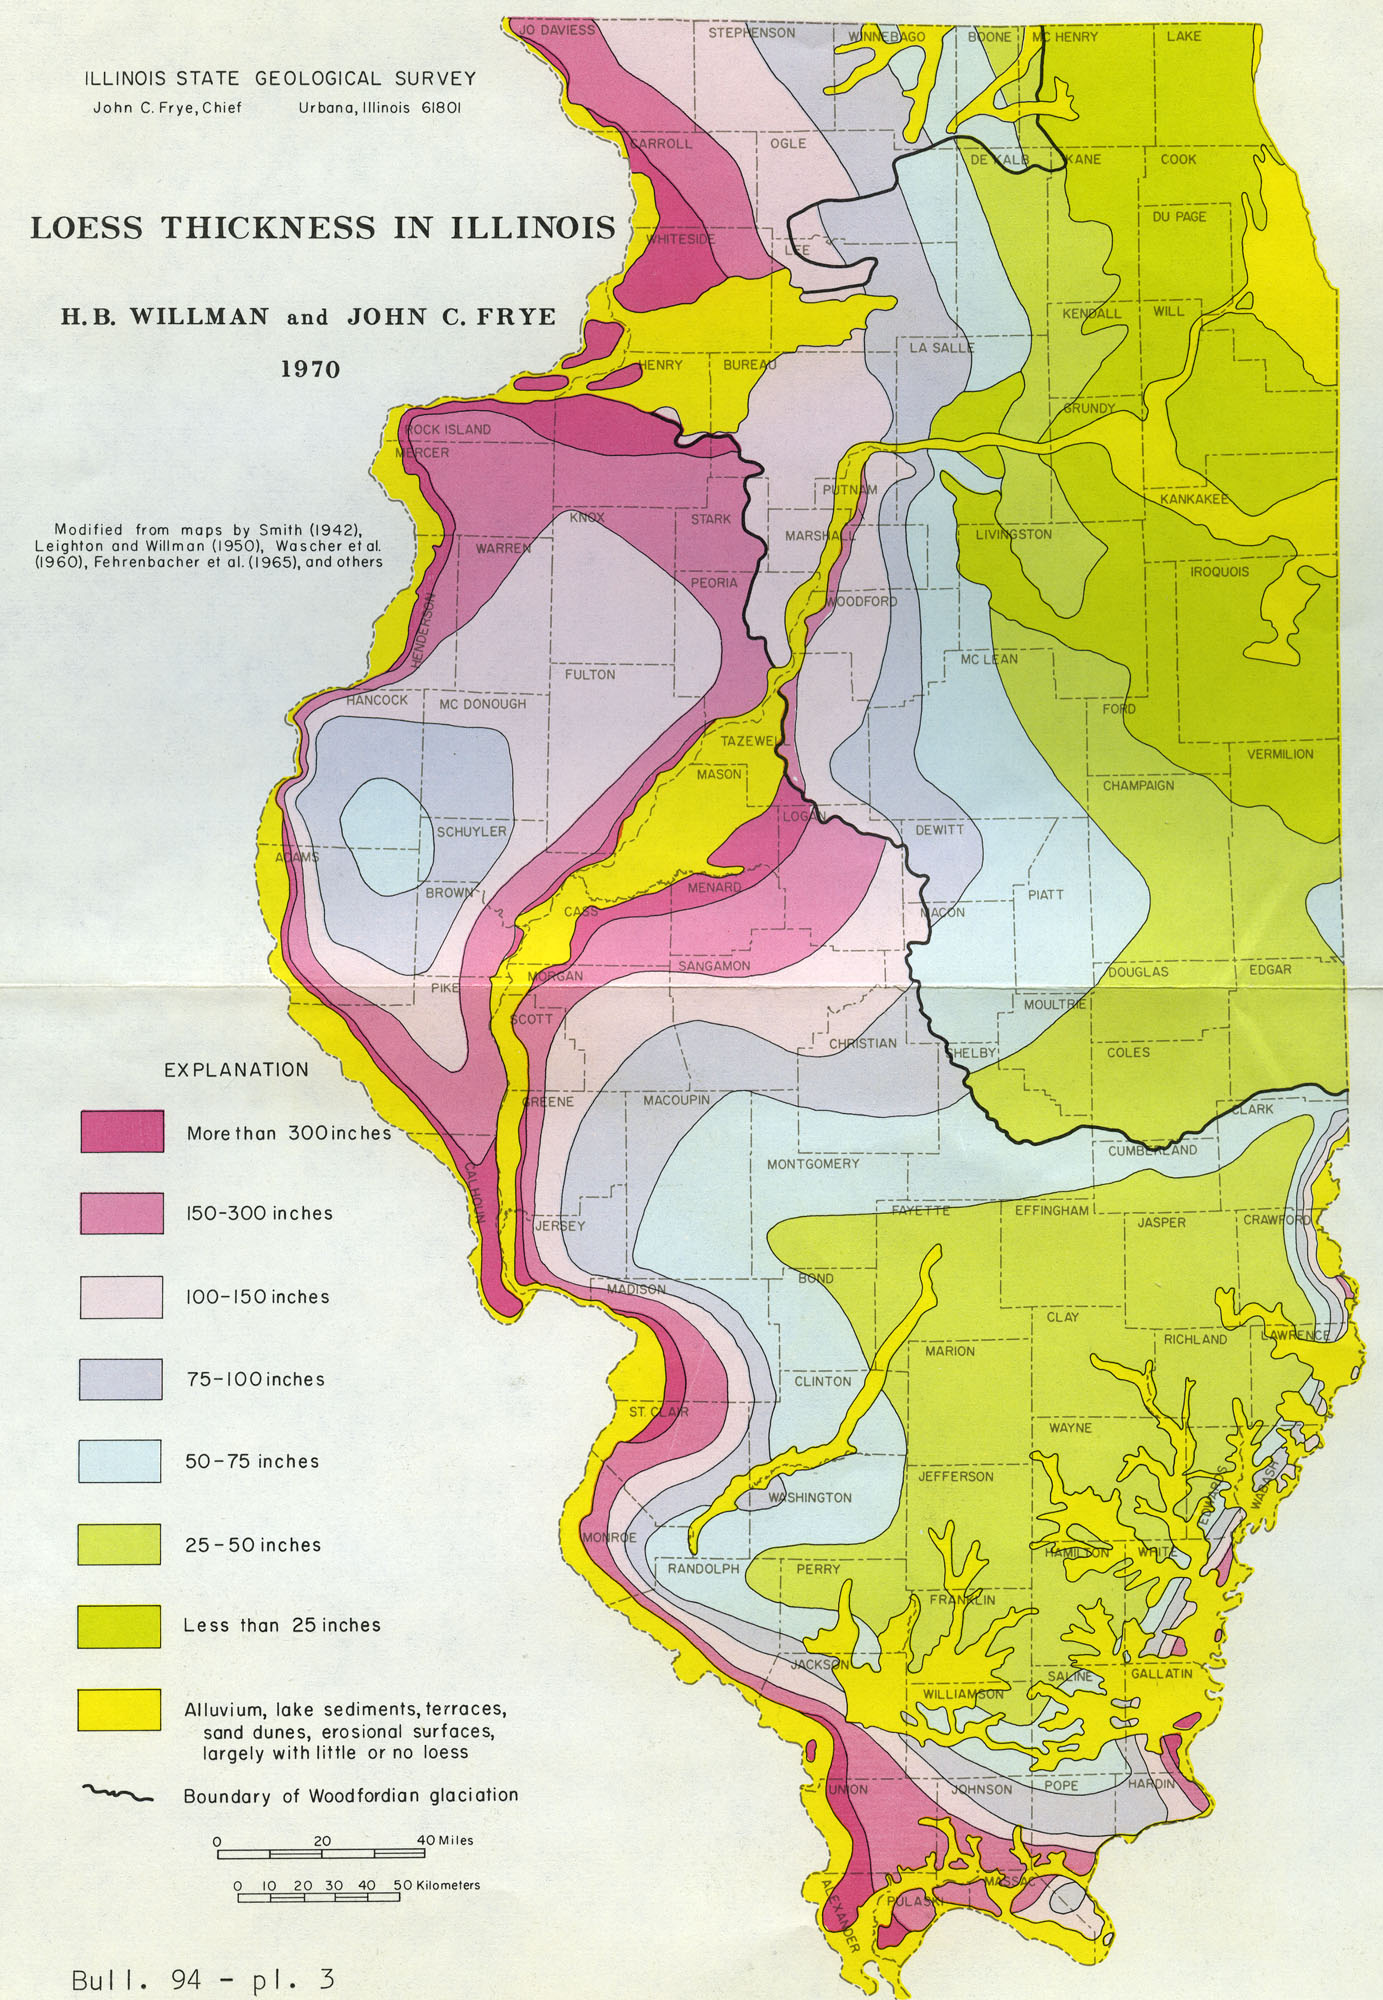
| 16:52, 18 April 2016 | 94-pl 3.jpg (file) |  |
587 KB | Bull. 94 - pl. 3 | 1 |
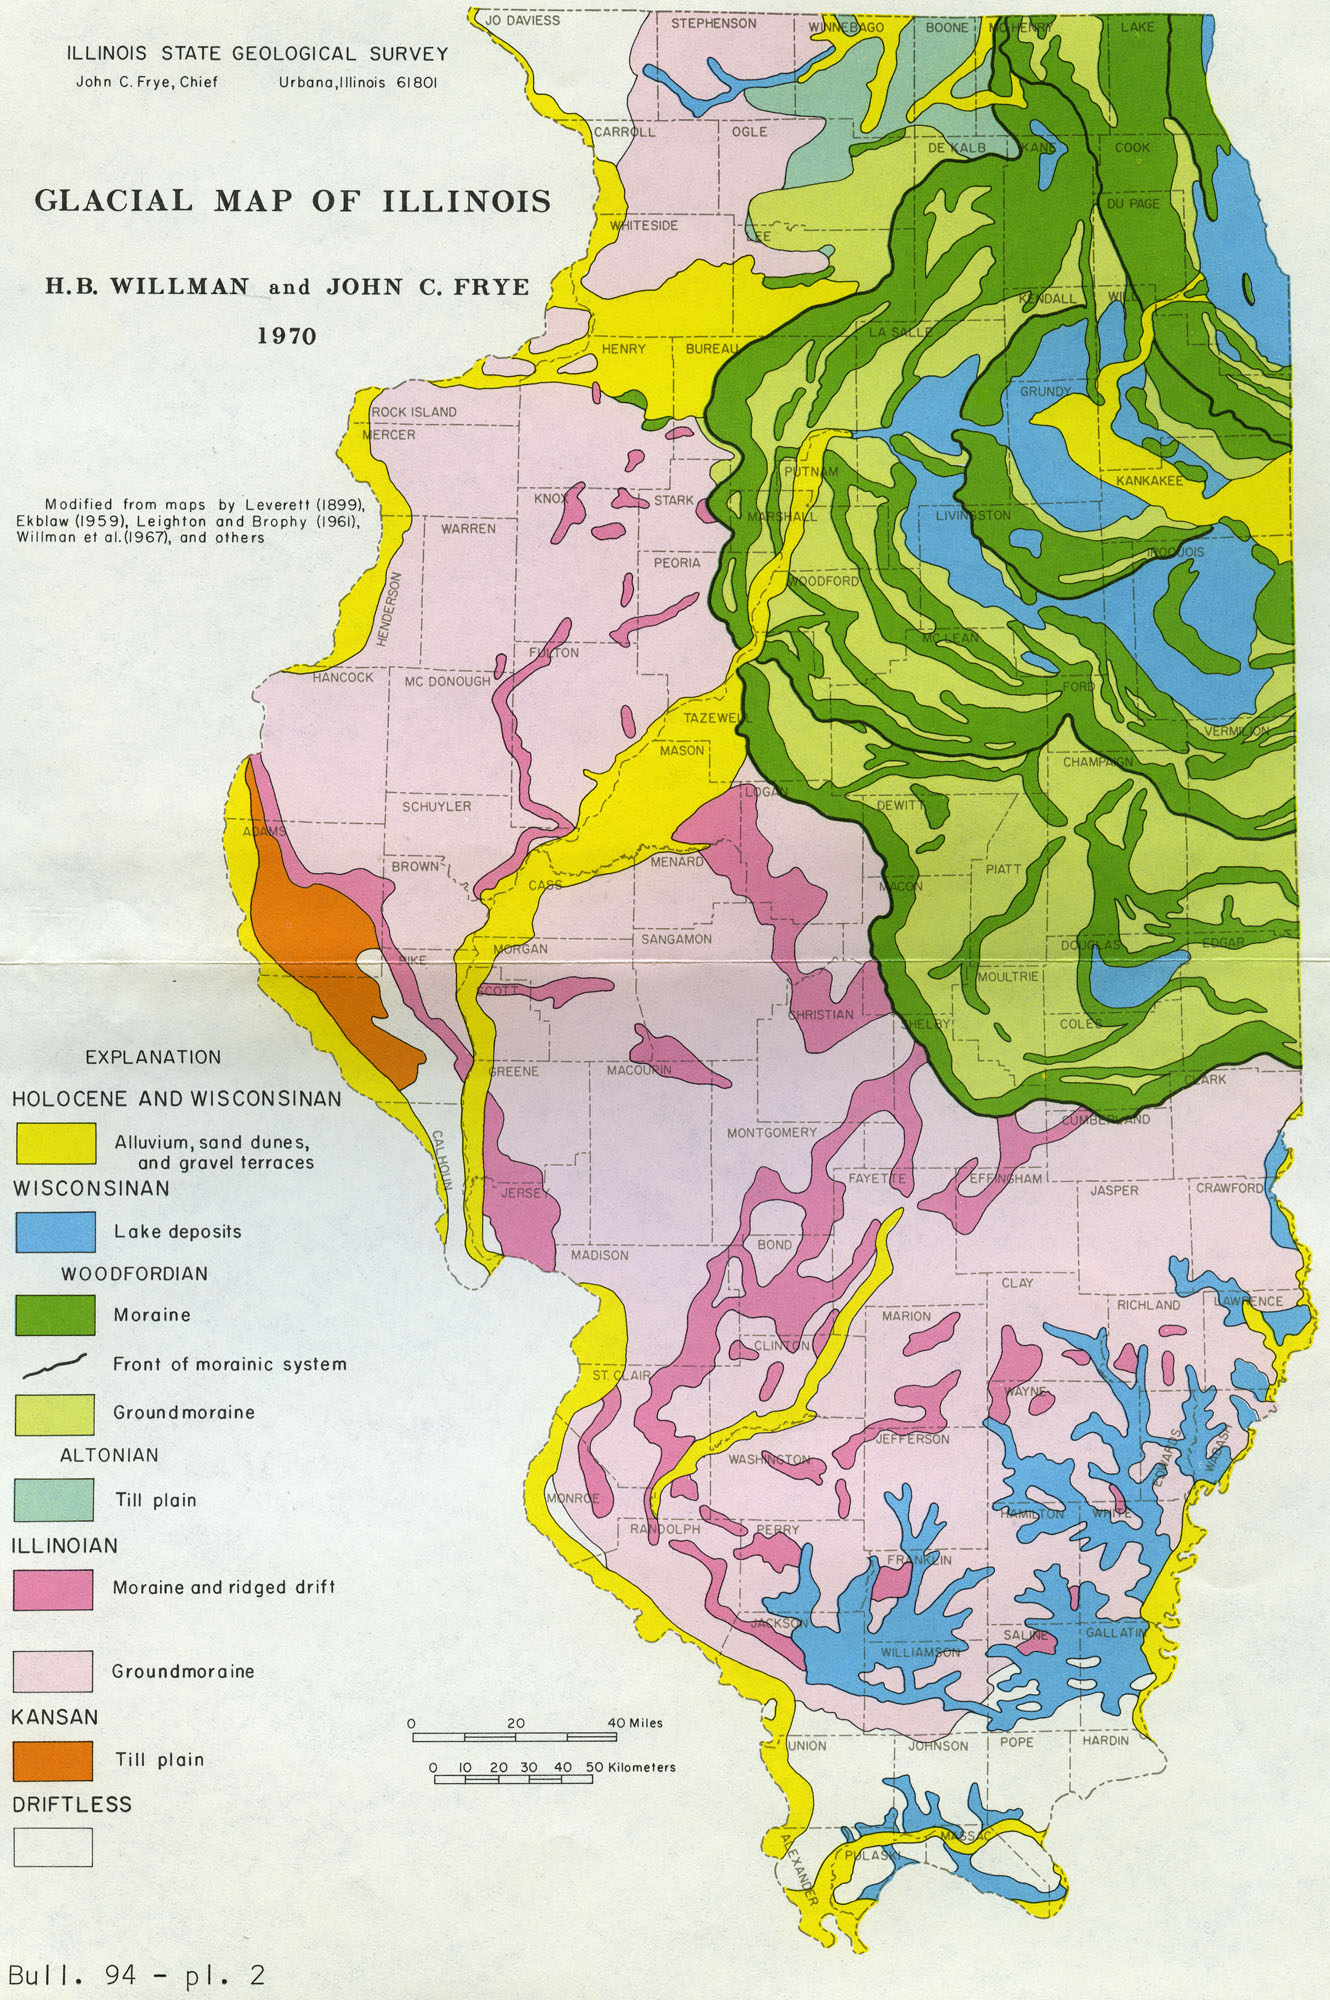
| 16:48, 18 April 2016 | 94-pl 2.jpg (file) |  |
611 KB | Bull. 94 - pl. 2 | 1 |
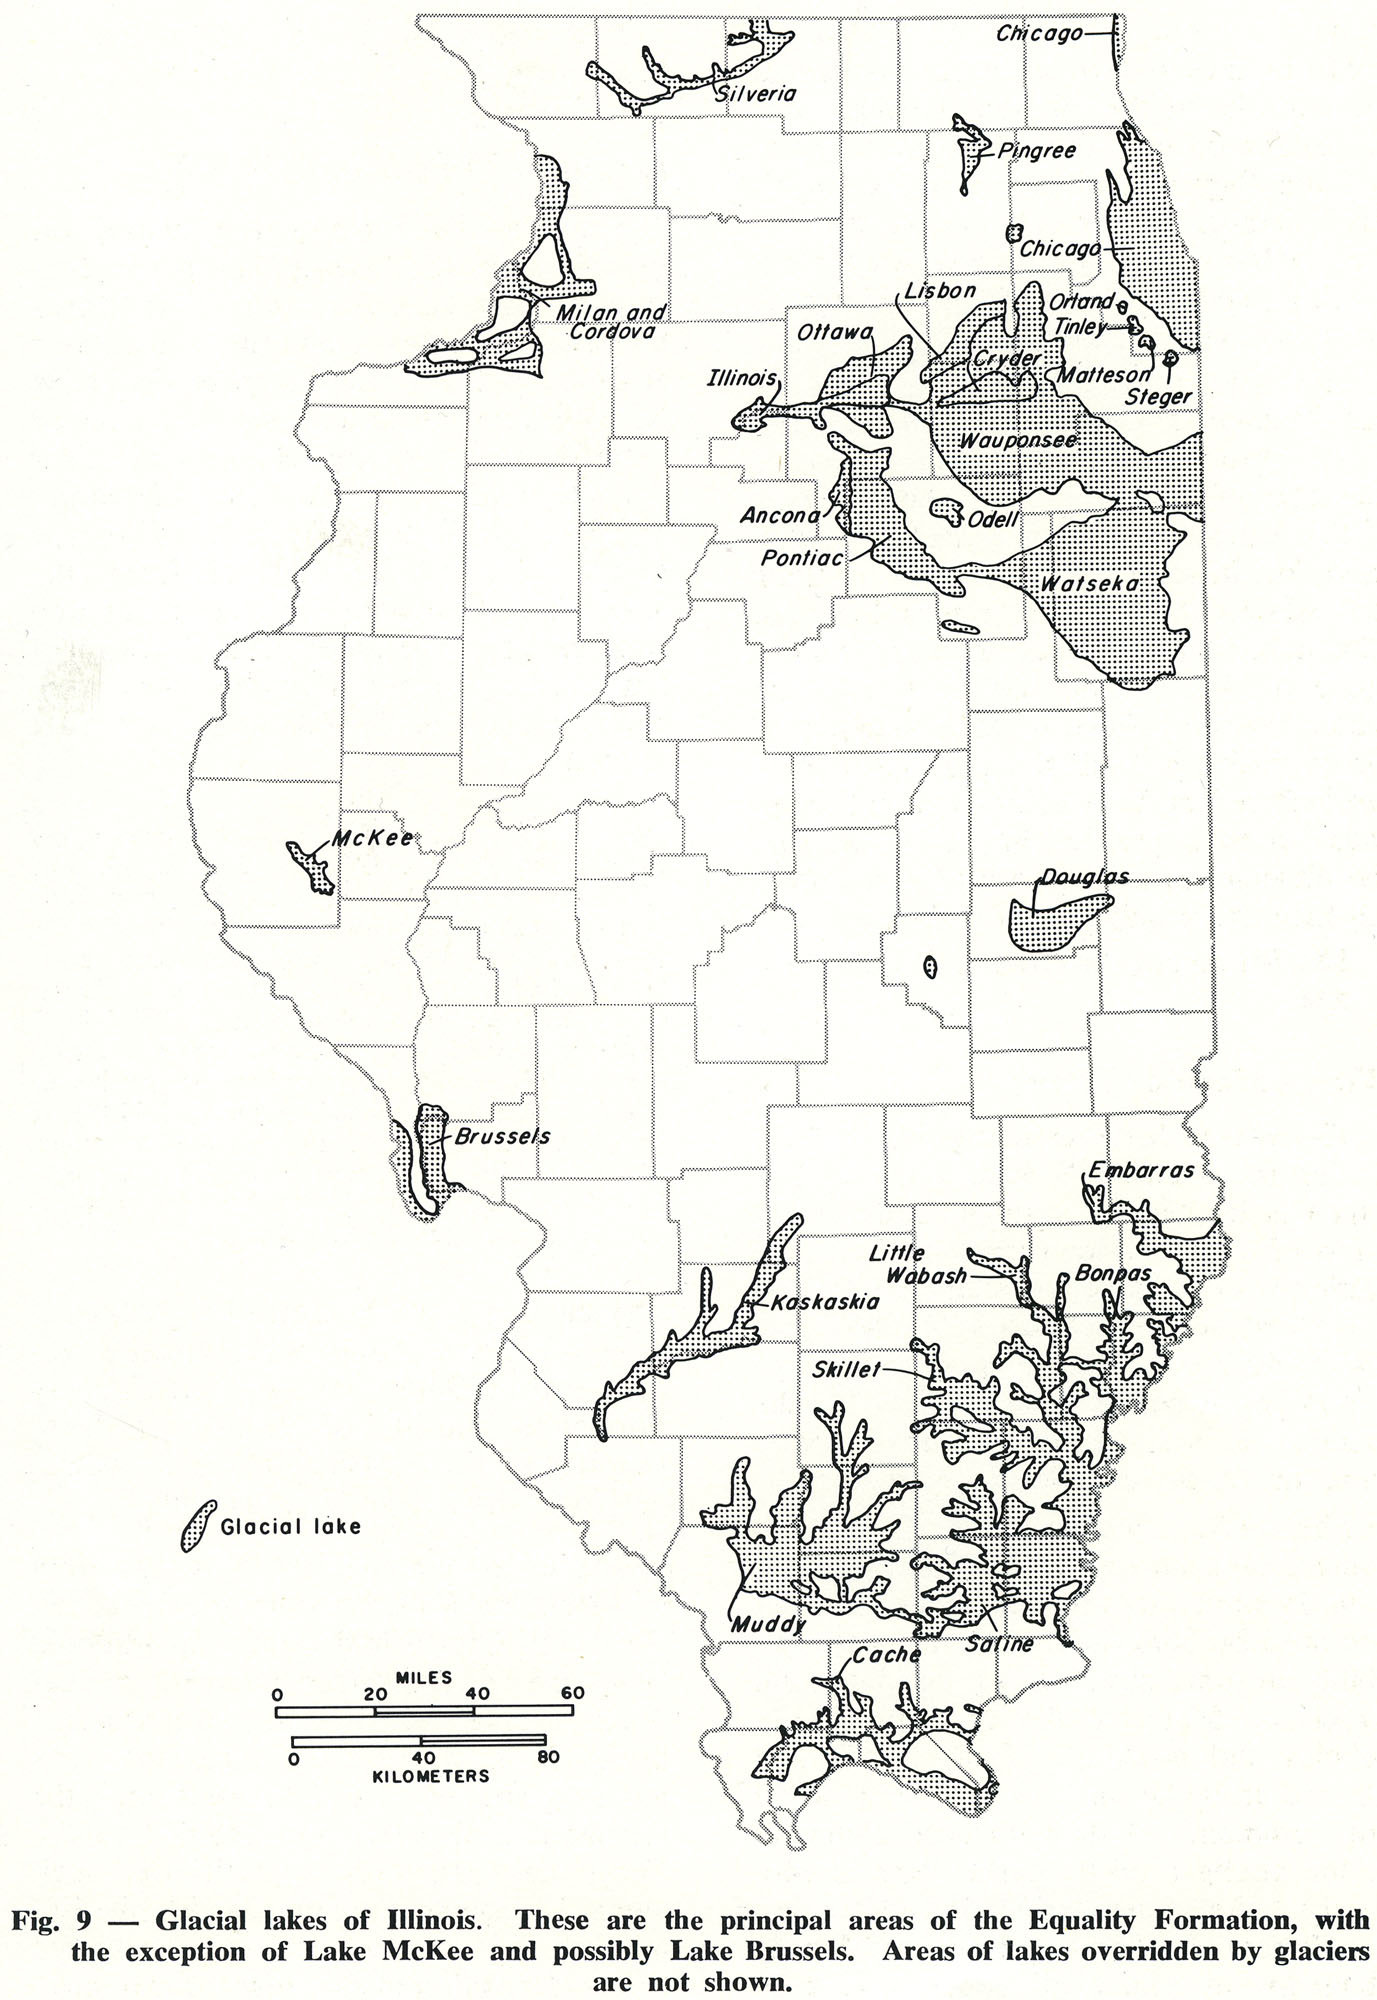
| 16:38, 18 April 2016 | 94-fig 9.jpg (file) |  |
438 KB | Fig. 9 -- Glacial lakes of Illinois. These are the principal areas of the Equality Formation, with the exception of Lake McKee and possibly Lake Brussels. Areas of lakes overridden by glaciers are not shown. | 1 |
| 16:32, 18 April 2016 | 94-fig 8.jpg (file) |  |
575 KB | Fig. 8 -- Diagrammatic cross section showing the relations of formations and members of Wisconsinan age in northern and western Illinois. | 1 |
| 16:30, 18 April 2016 | 94-fig 7.jpg (file) |  |
567 KB | Fig. 7 -- Diagrammatic cross section showing the relations of formations and members of Illinoian age in western Illinois. | 1 |
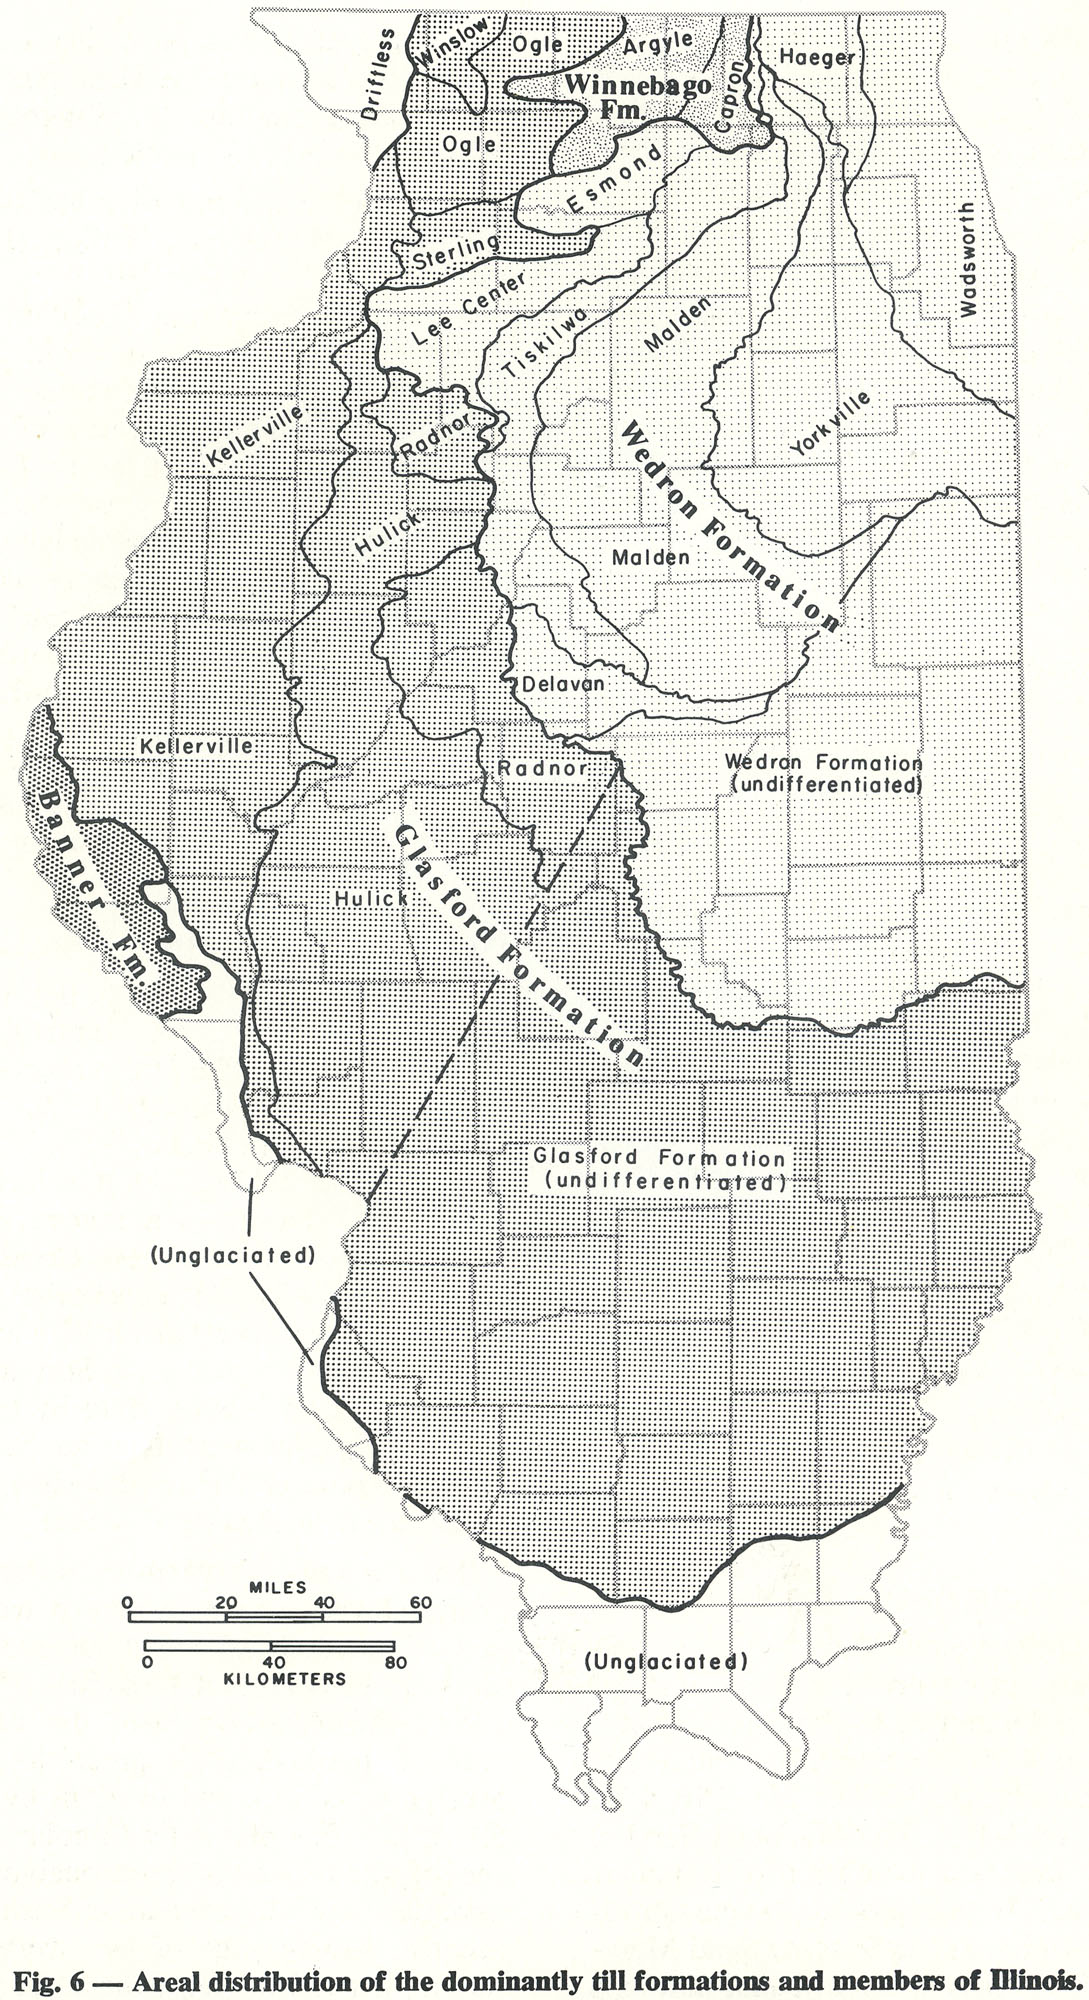
| 16:28, 18 April 2016 | 94-fig 6.jpg (file) |  |
665 KB | Fig. 6 -- Areal distribution of the dominantly till formations and members of Illinois. | 1 |
| 16:26, 18 April 2016 | 94-fig 5.jpg (file) |  |
399 KB | Fig. 5 -- Sequence of glaciations and interglacial drainage in Illinois. | 1 |
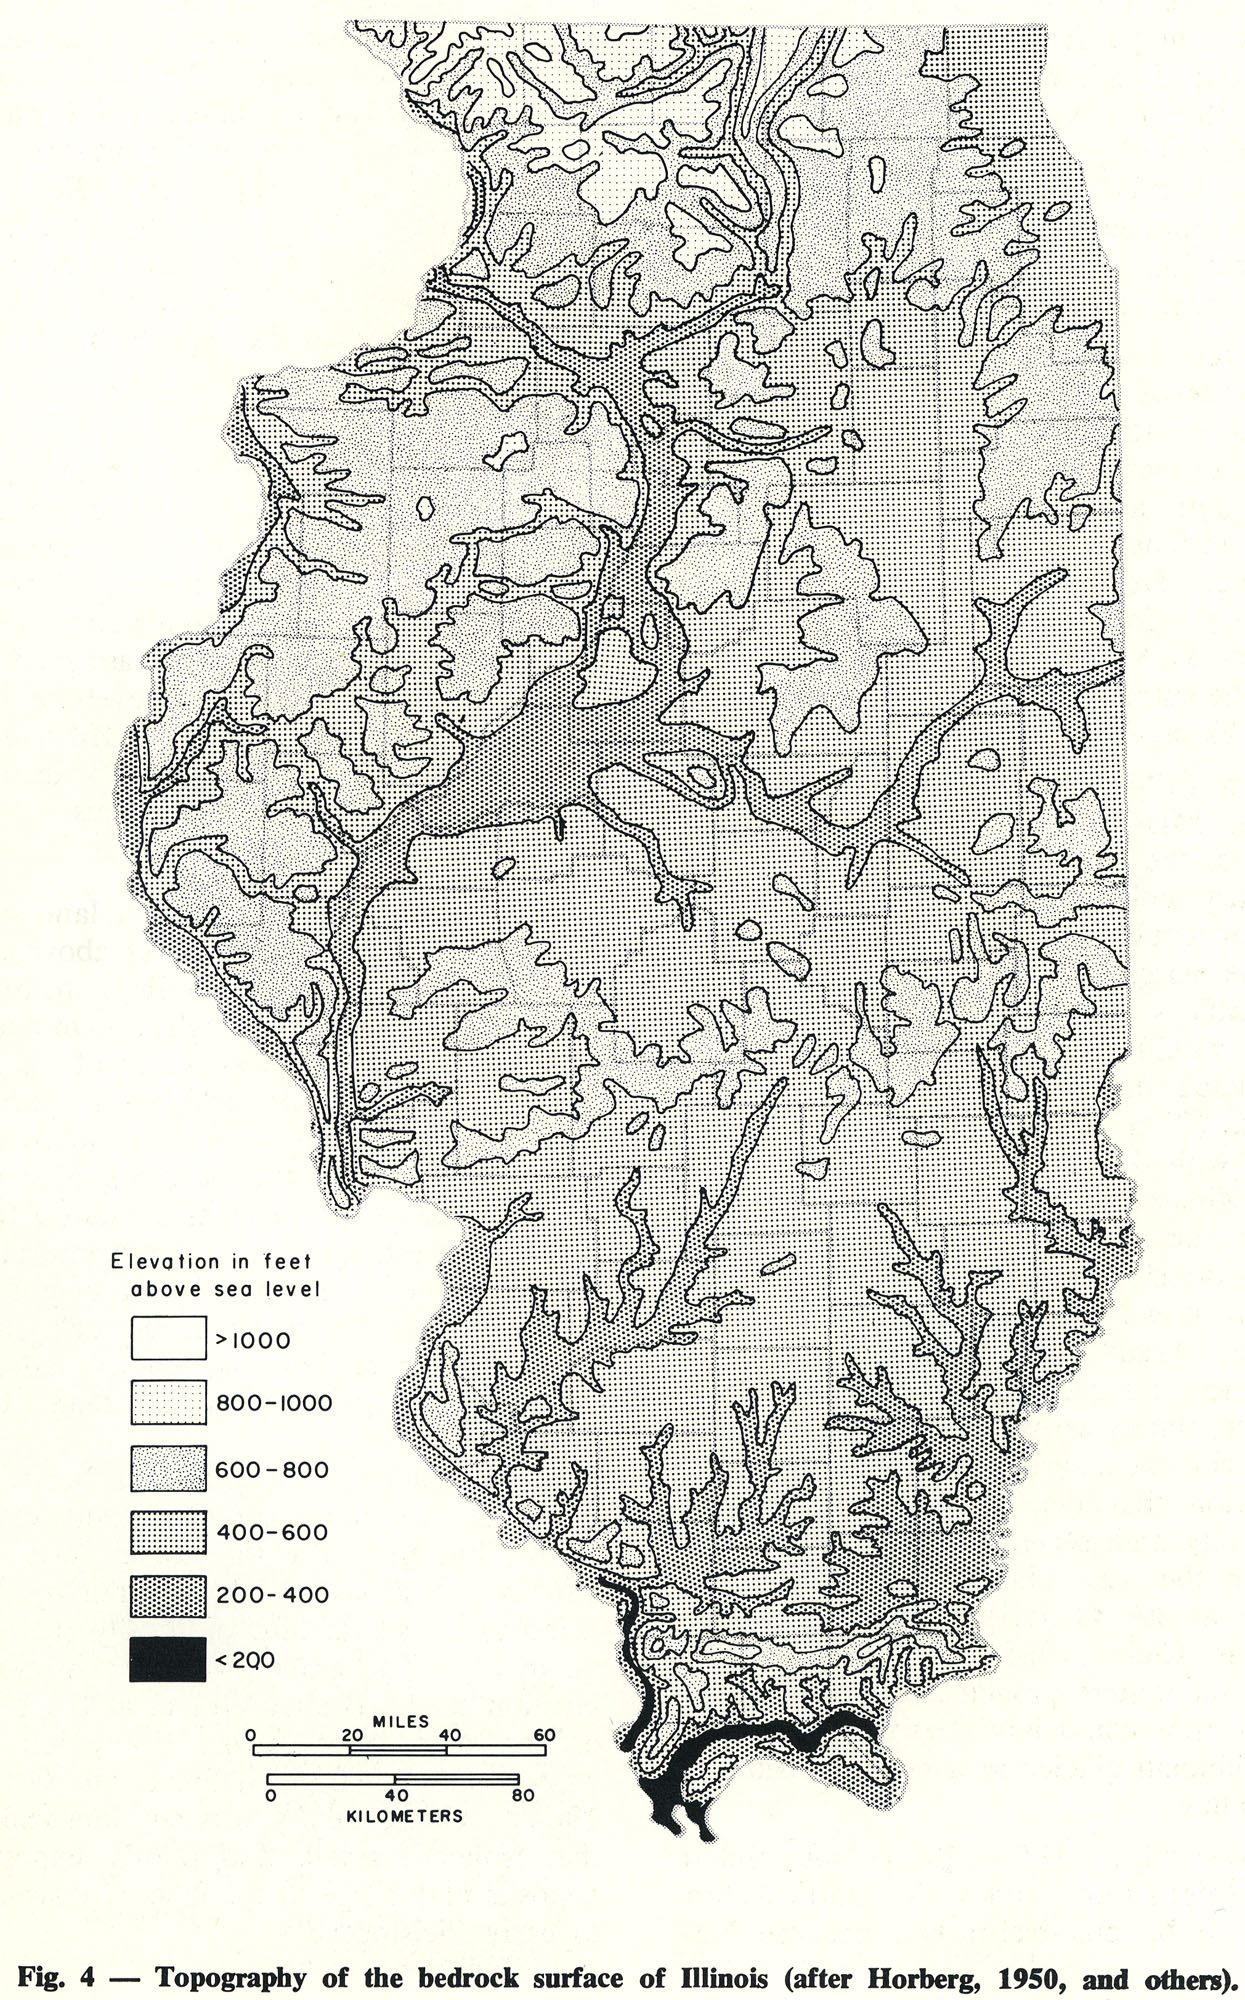
| 16:21, 18 April 2016 | 94-fig 4.jpg (file) |  |
858 KB | Fig. 4 -- Topography of the bedrock surface of Illinois (after Horberg, 1950, and others). | 1 |
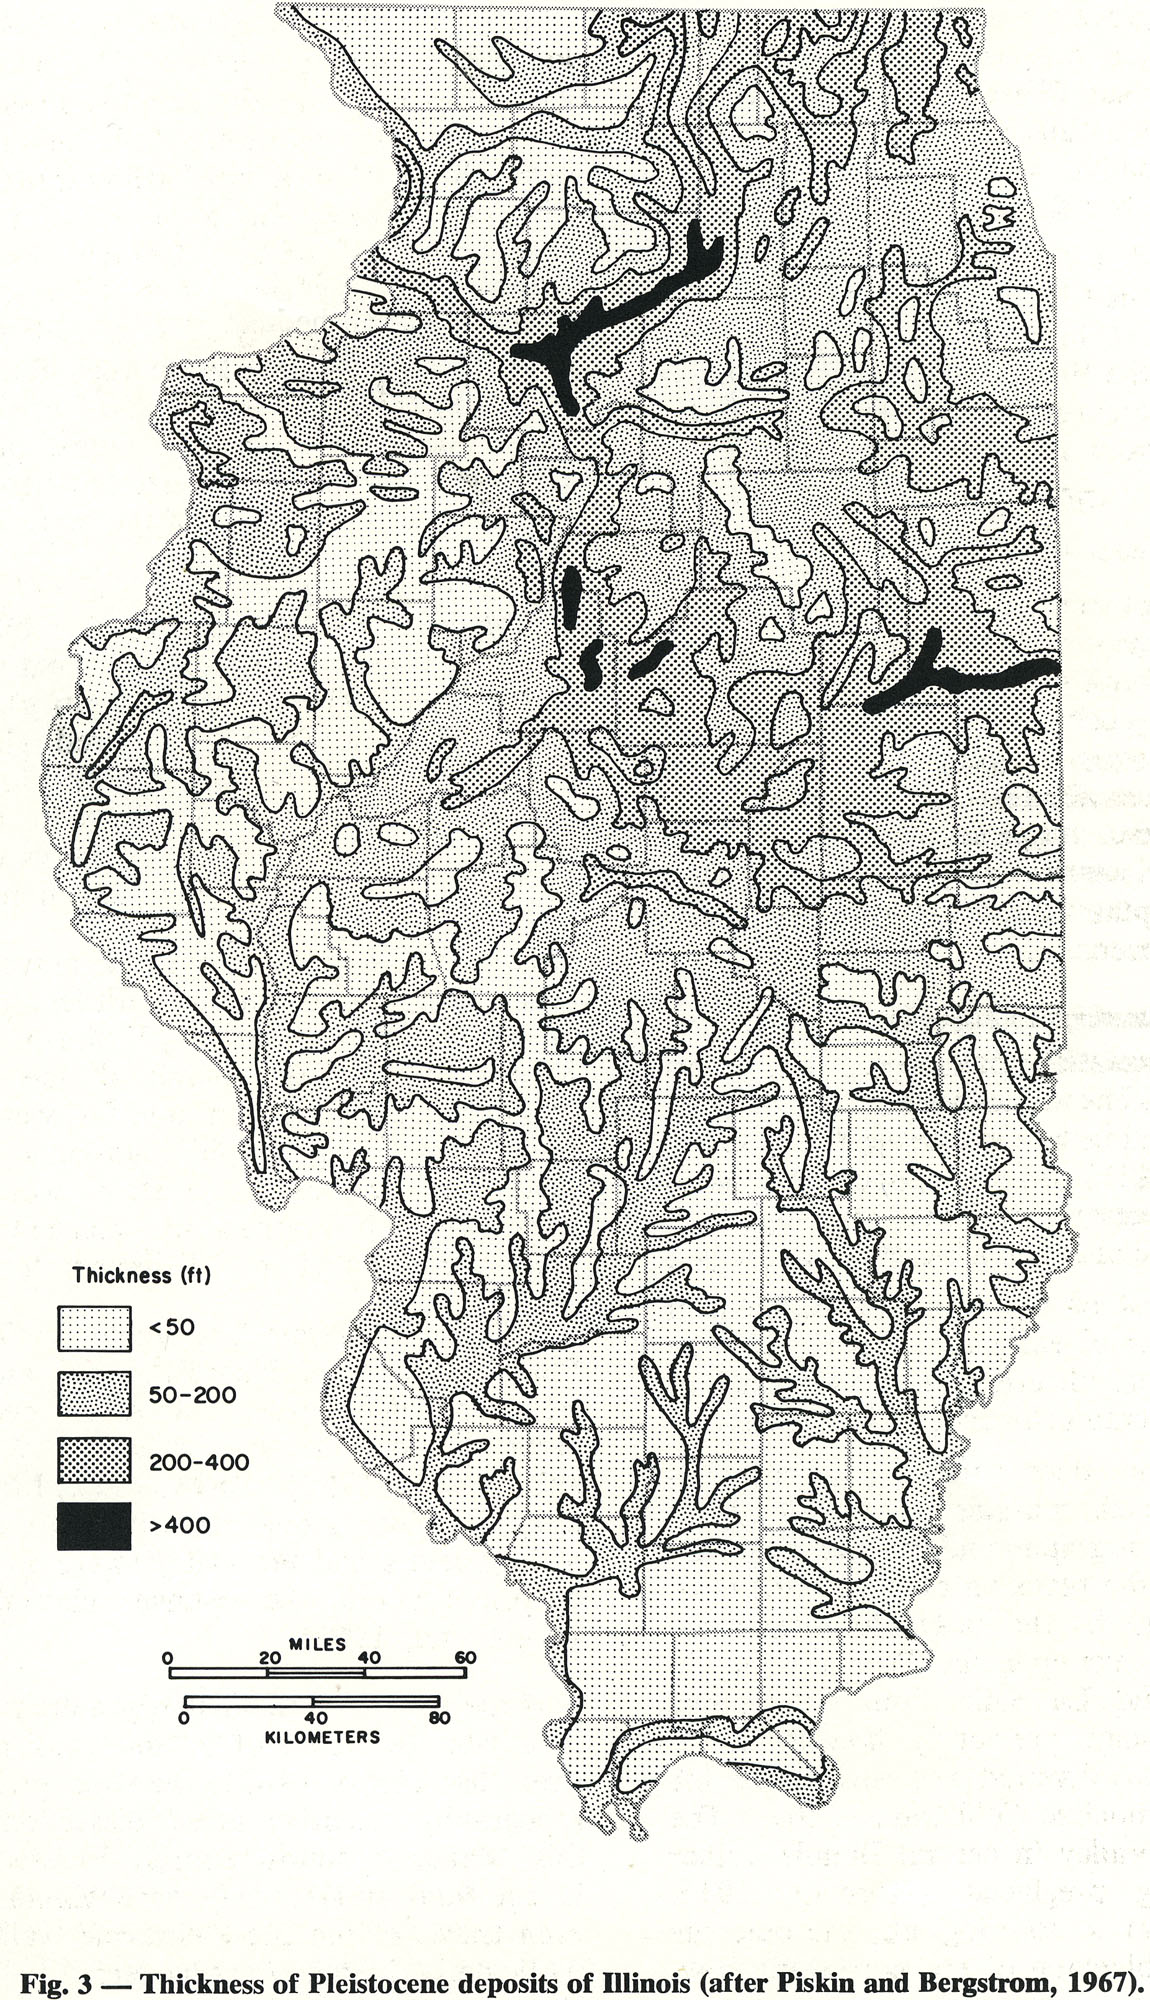
| 16:19, 18 April 2016 | 94-fig 3.jpg (file) |  |
876 KB | Fig. 3 -- Thickness of Pleistocene deposits of Illinois (after Piskin and Bergstrom, 1967). | 1 |