File list
Jump to navigation
Jump to search
This special page shows all uploaded files.
| Date | Name | Thumbnail | Size | User | Description | Versions |
|---|---|---|---|---|---|---|
| 16:35, 19 April 2016 | 104-Figure 11.jpg (file) |  |
362 KB | Illex-gron | Figure 11 Correlation of the Wedron Group formations and members in the Lake Michigan Lobe area (units in Wisconsin from Mickelson et. al. 1984, Mickelson and Syverson, in press; units in Indiana from Bleuer et al. 1983, N.K. Bleuer, Indiana Geological... | 1 |
| 13:54, 4 April 2016 | Figure M-10.jpg (file) |  |
362 KB | Alan.Myers | Fig. M-10 -- Thickness of the Valmeyeran Series. Thickness is shown where Chesterian strata are present. | 1 |
| 17:58, 4 April 2016 | Figure S-13.jpg (file) |  |
365 KB | Alan.Myers | Fig. S-13 -- Thickness of the Hunton Limestone Megagroup (modified from Bond et al., 1971). | 1 |
| 15:20, 9 July 2020 | C605-Figure-23.jpg (file) |  |
366 KB | Alan.Myers | 1 | |
| 15:03, 4 April 2016 | Figure O-23.jpg (file) |  |
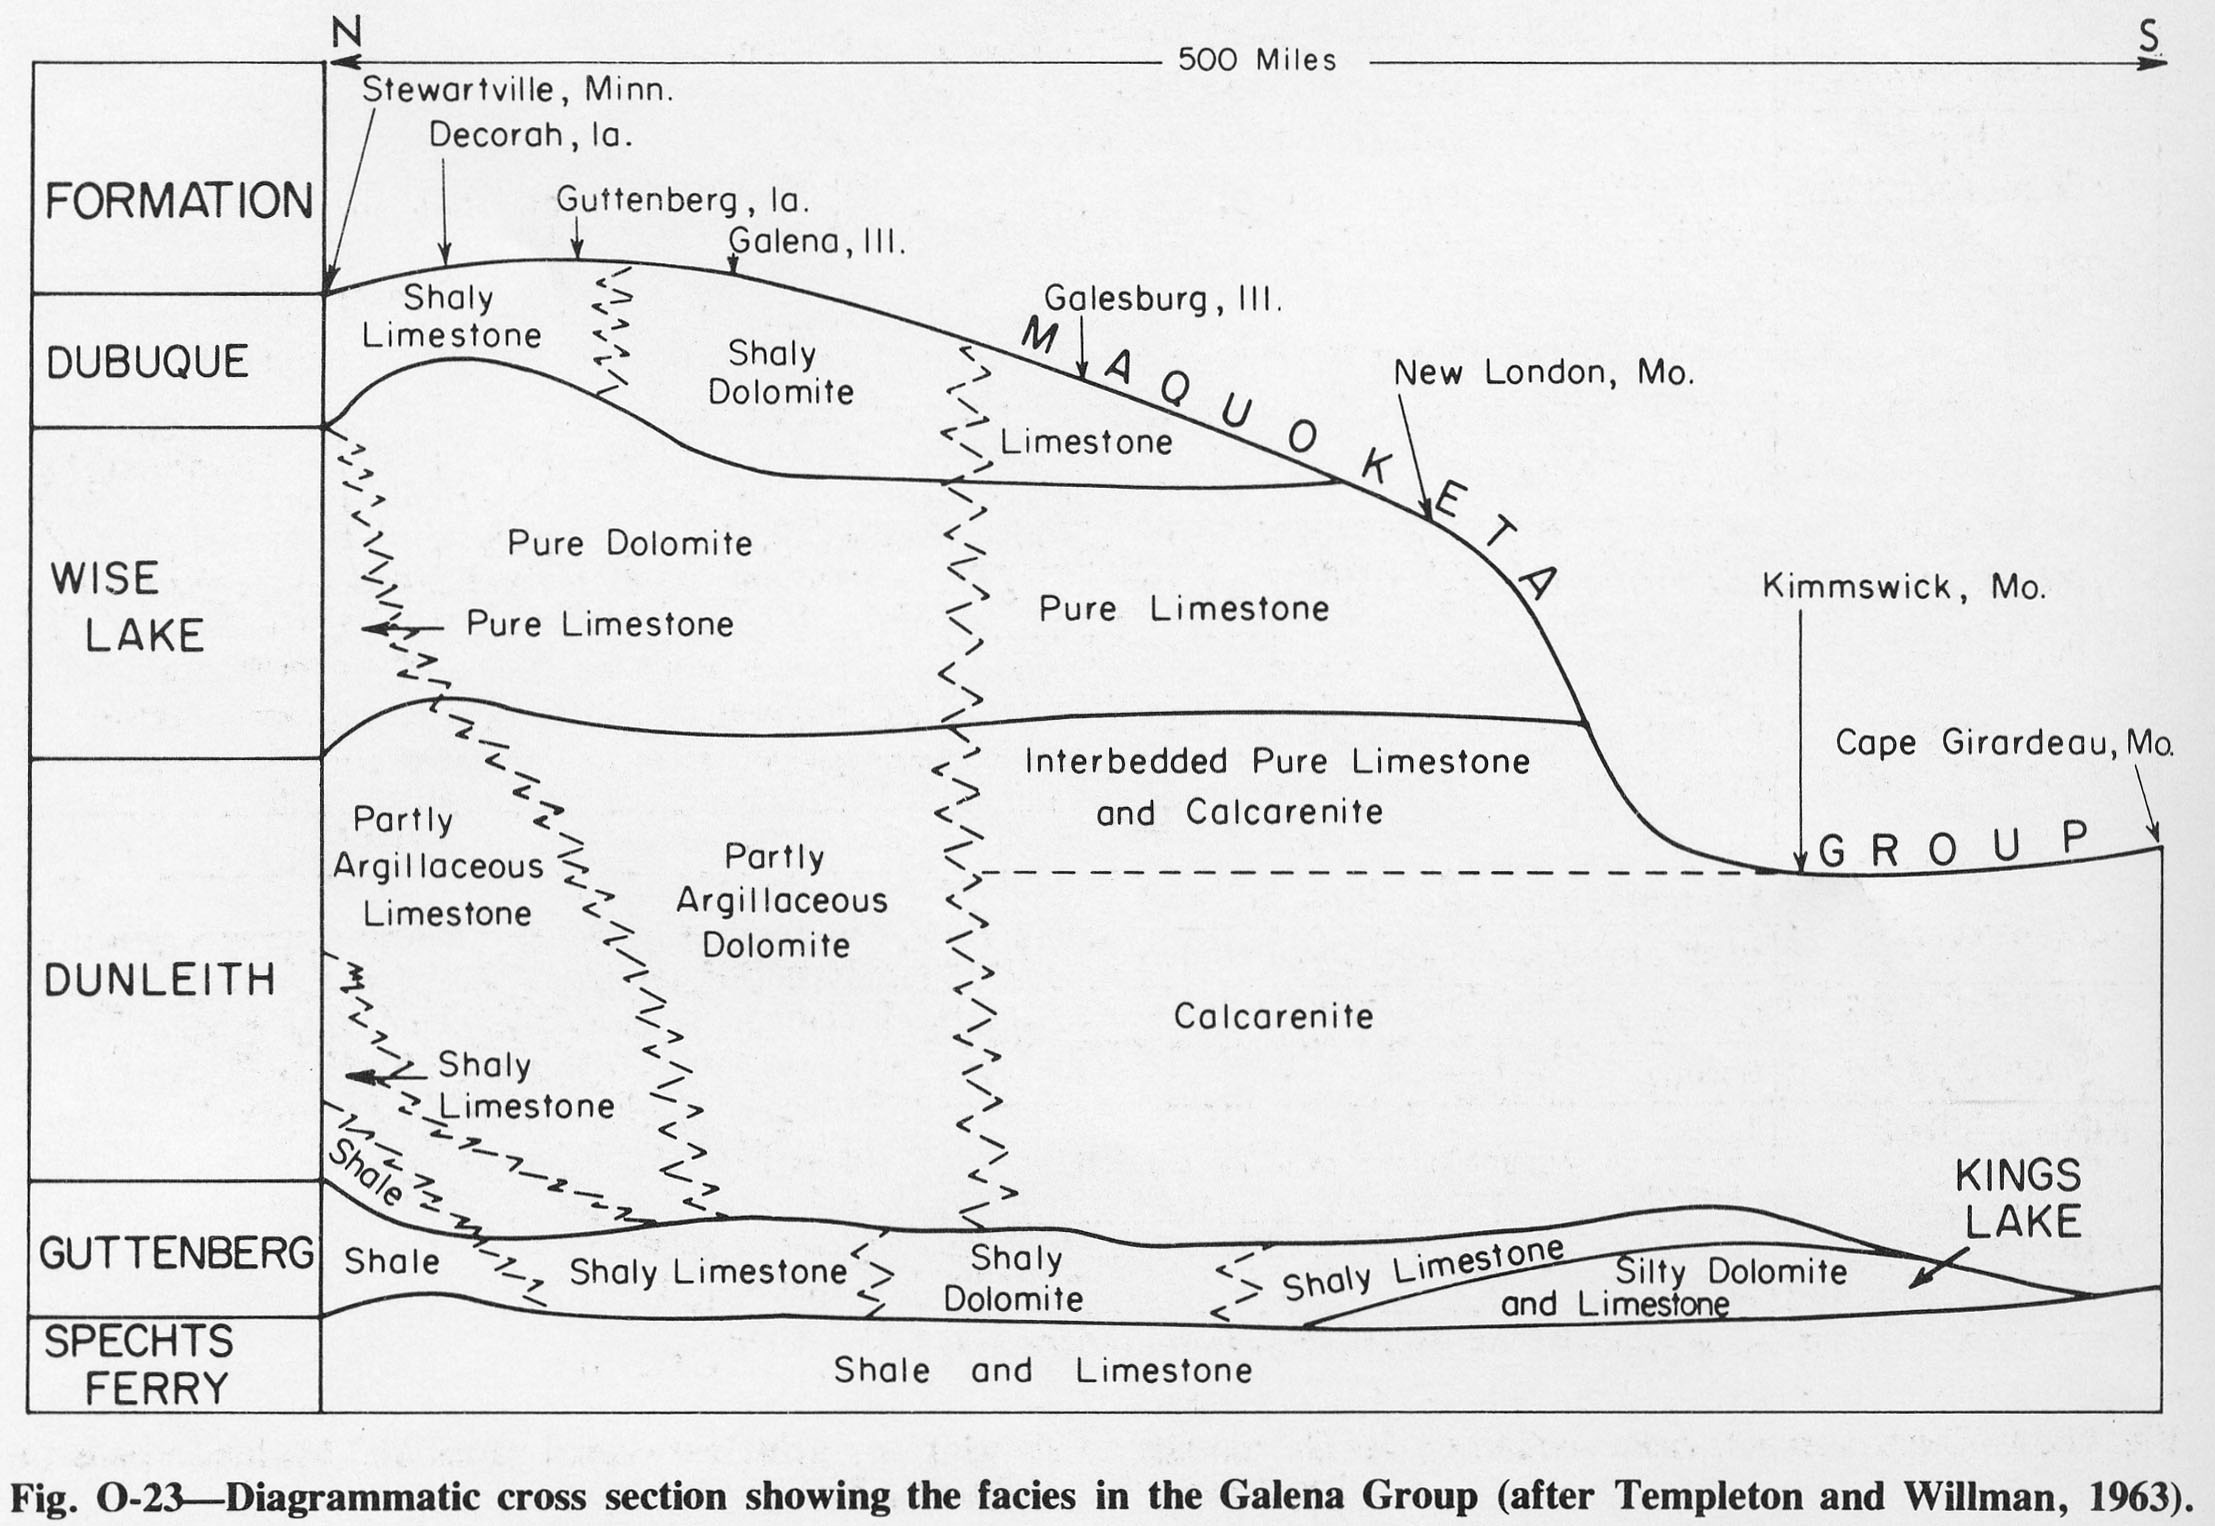
368 KB | Alan.Myers | Fig. O-23 -- Diagrammatic cross section showing the facies in the Galena Group. (after Templeton and Willman, 1963). | 1 |
| 18:09, 4 April 2016 | Table 3.jpg (file) |  |
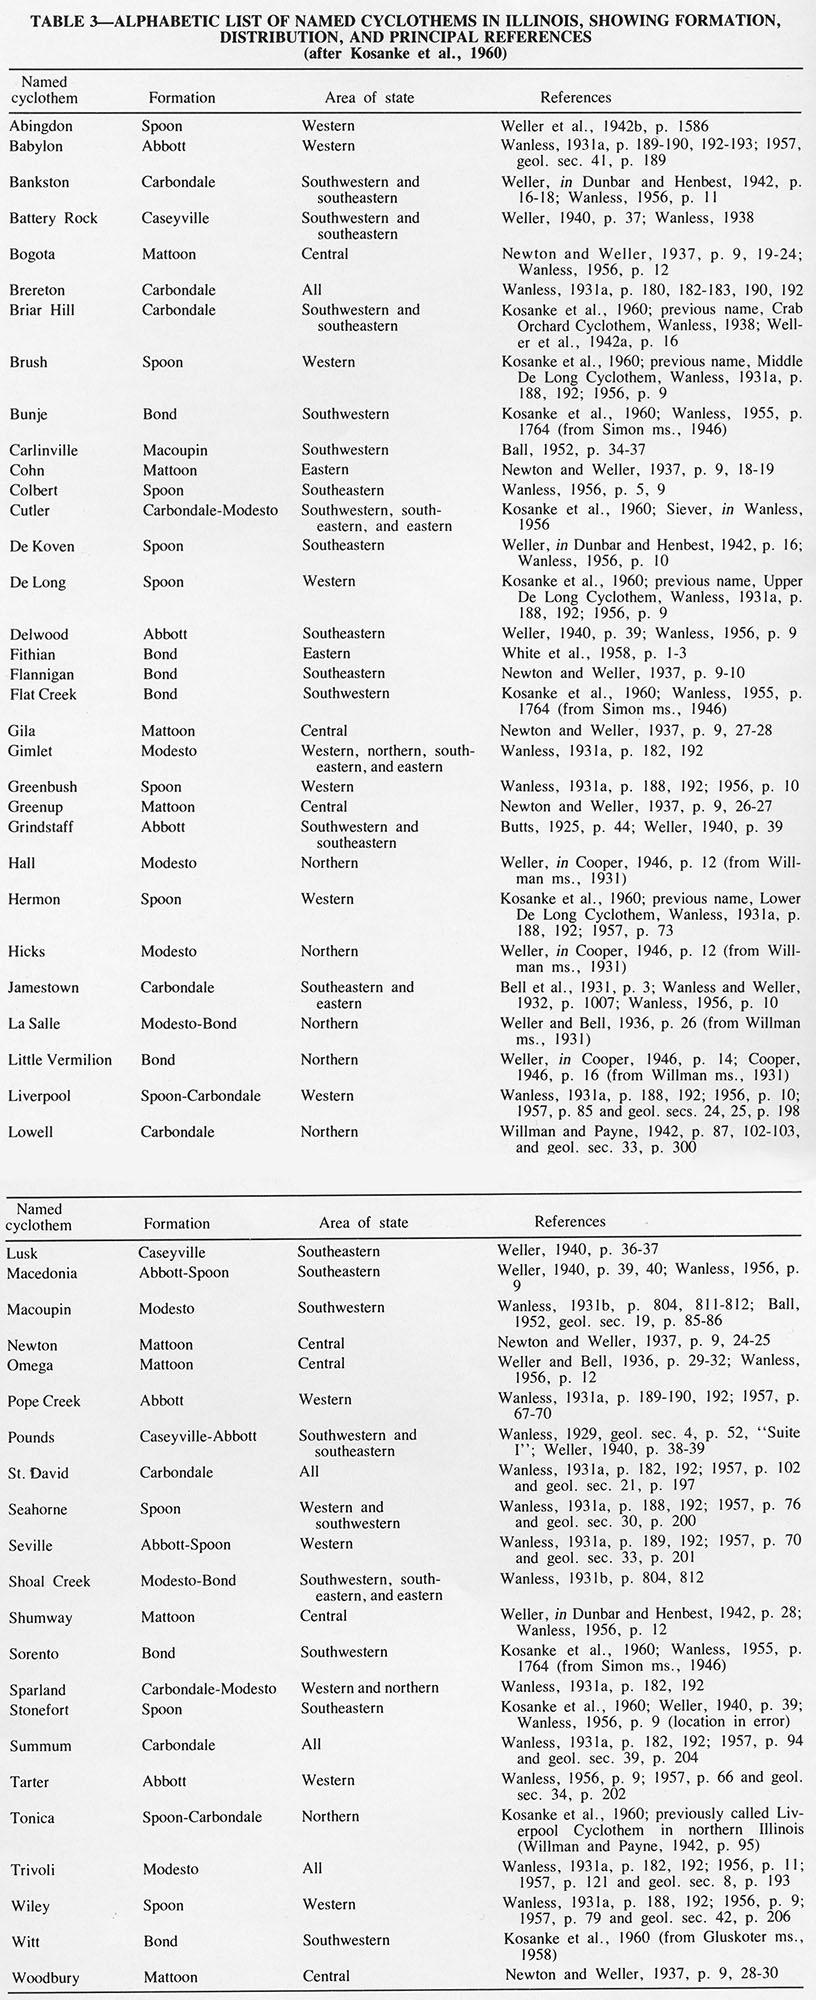
371 KB | Alan.Myers | Table 3 -- Alphabetic list of named cyclothems in Illinois, showing formation, distribution, and principal references (after Kosanke et al., 1960). | 1 |
| 15:22, 9 July 2020 | C605-Figure-25.jpg (file) |  |
375 KB | Alan.Myers | 1 | |
| 19:55, 23 December 2020 | Penn carbondale 4-48.jpg (file) |  |
375 KB | Jennifer.Obrad | 1 | |
| 19:42, 1 April 2016 | Figure C-3.jpg (file) |  |
377 KB | Alan.Myers | Fig. C-3 -- columnar section of the Cambrian System. | 1 |
| 14:05, 4 April 2016 | Figure M-22.jpg (file) |  |
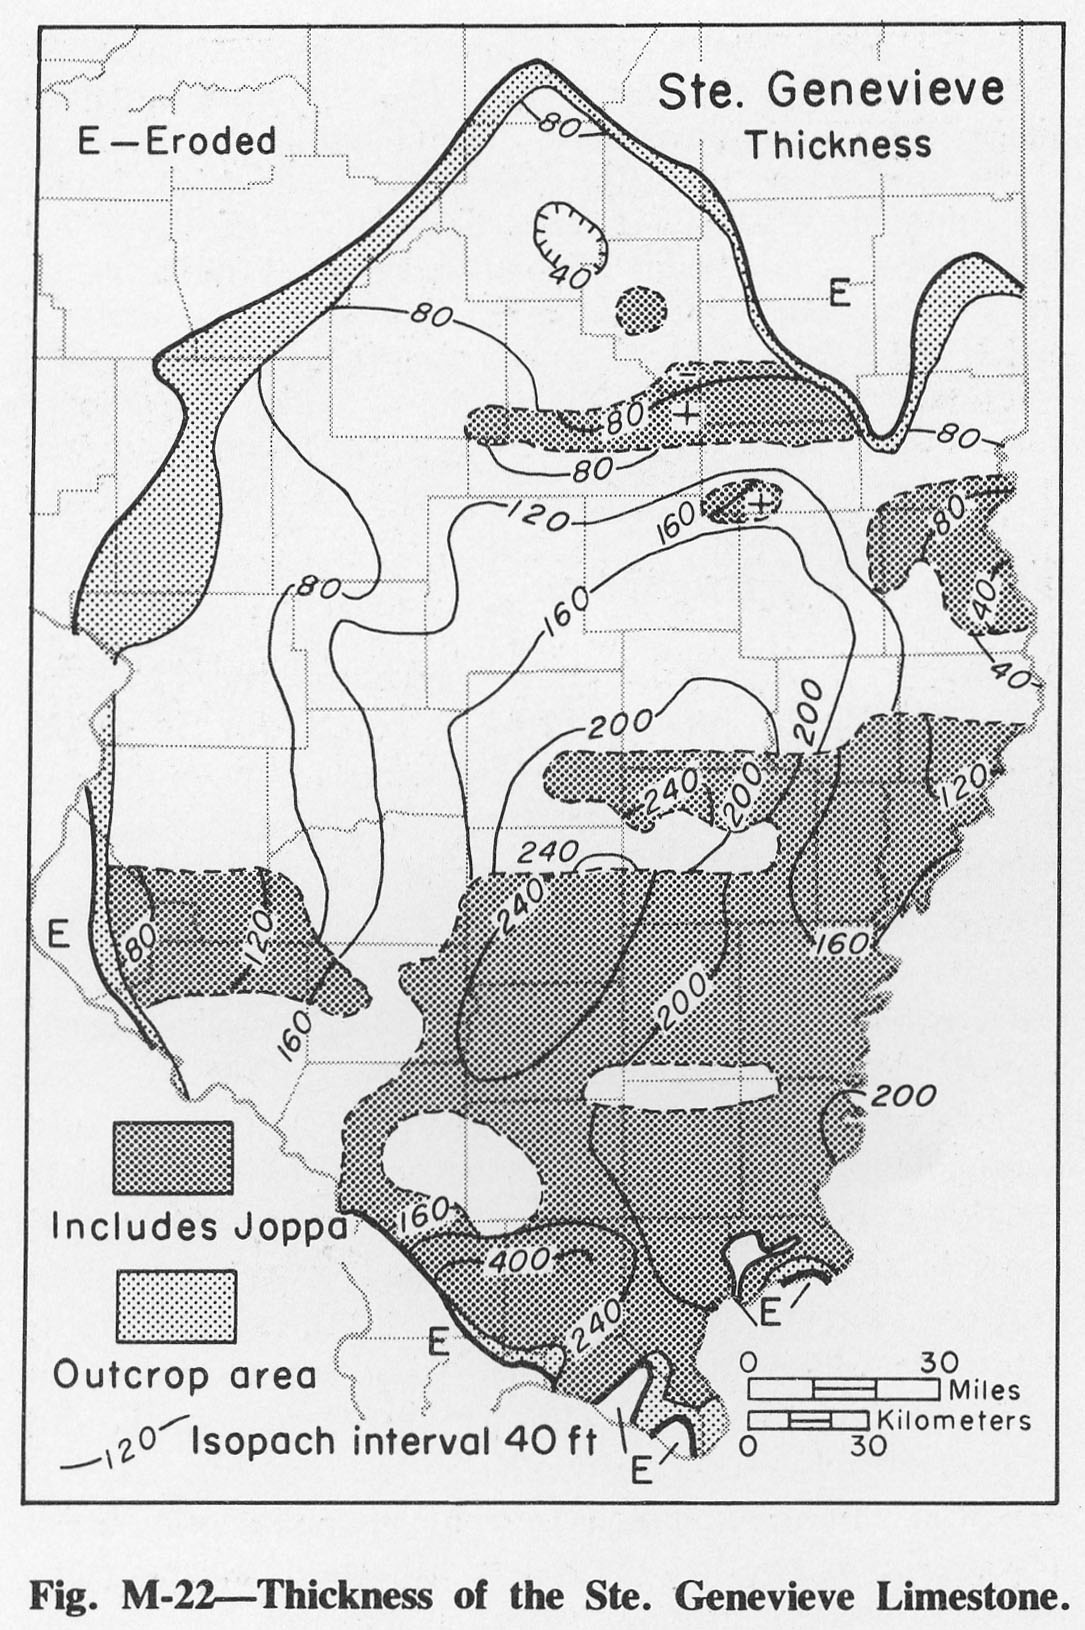
378 KB | Alan.Myers | Fig. M-22 -- Thickness of the Ste. Genevieve Limestone. | 1 |
| 15:02, 4 April 2016 | Figure O-22.jpg (file) |  |
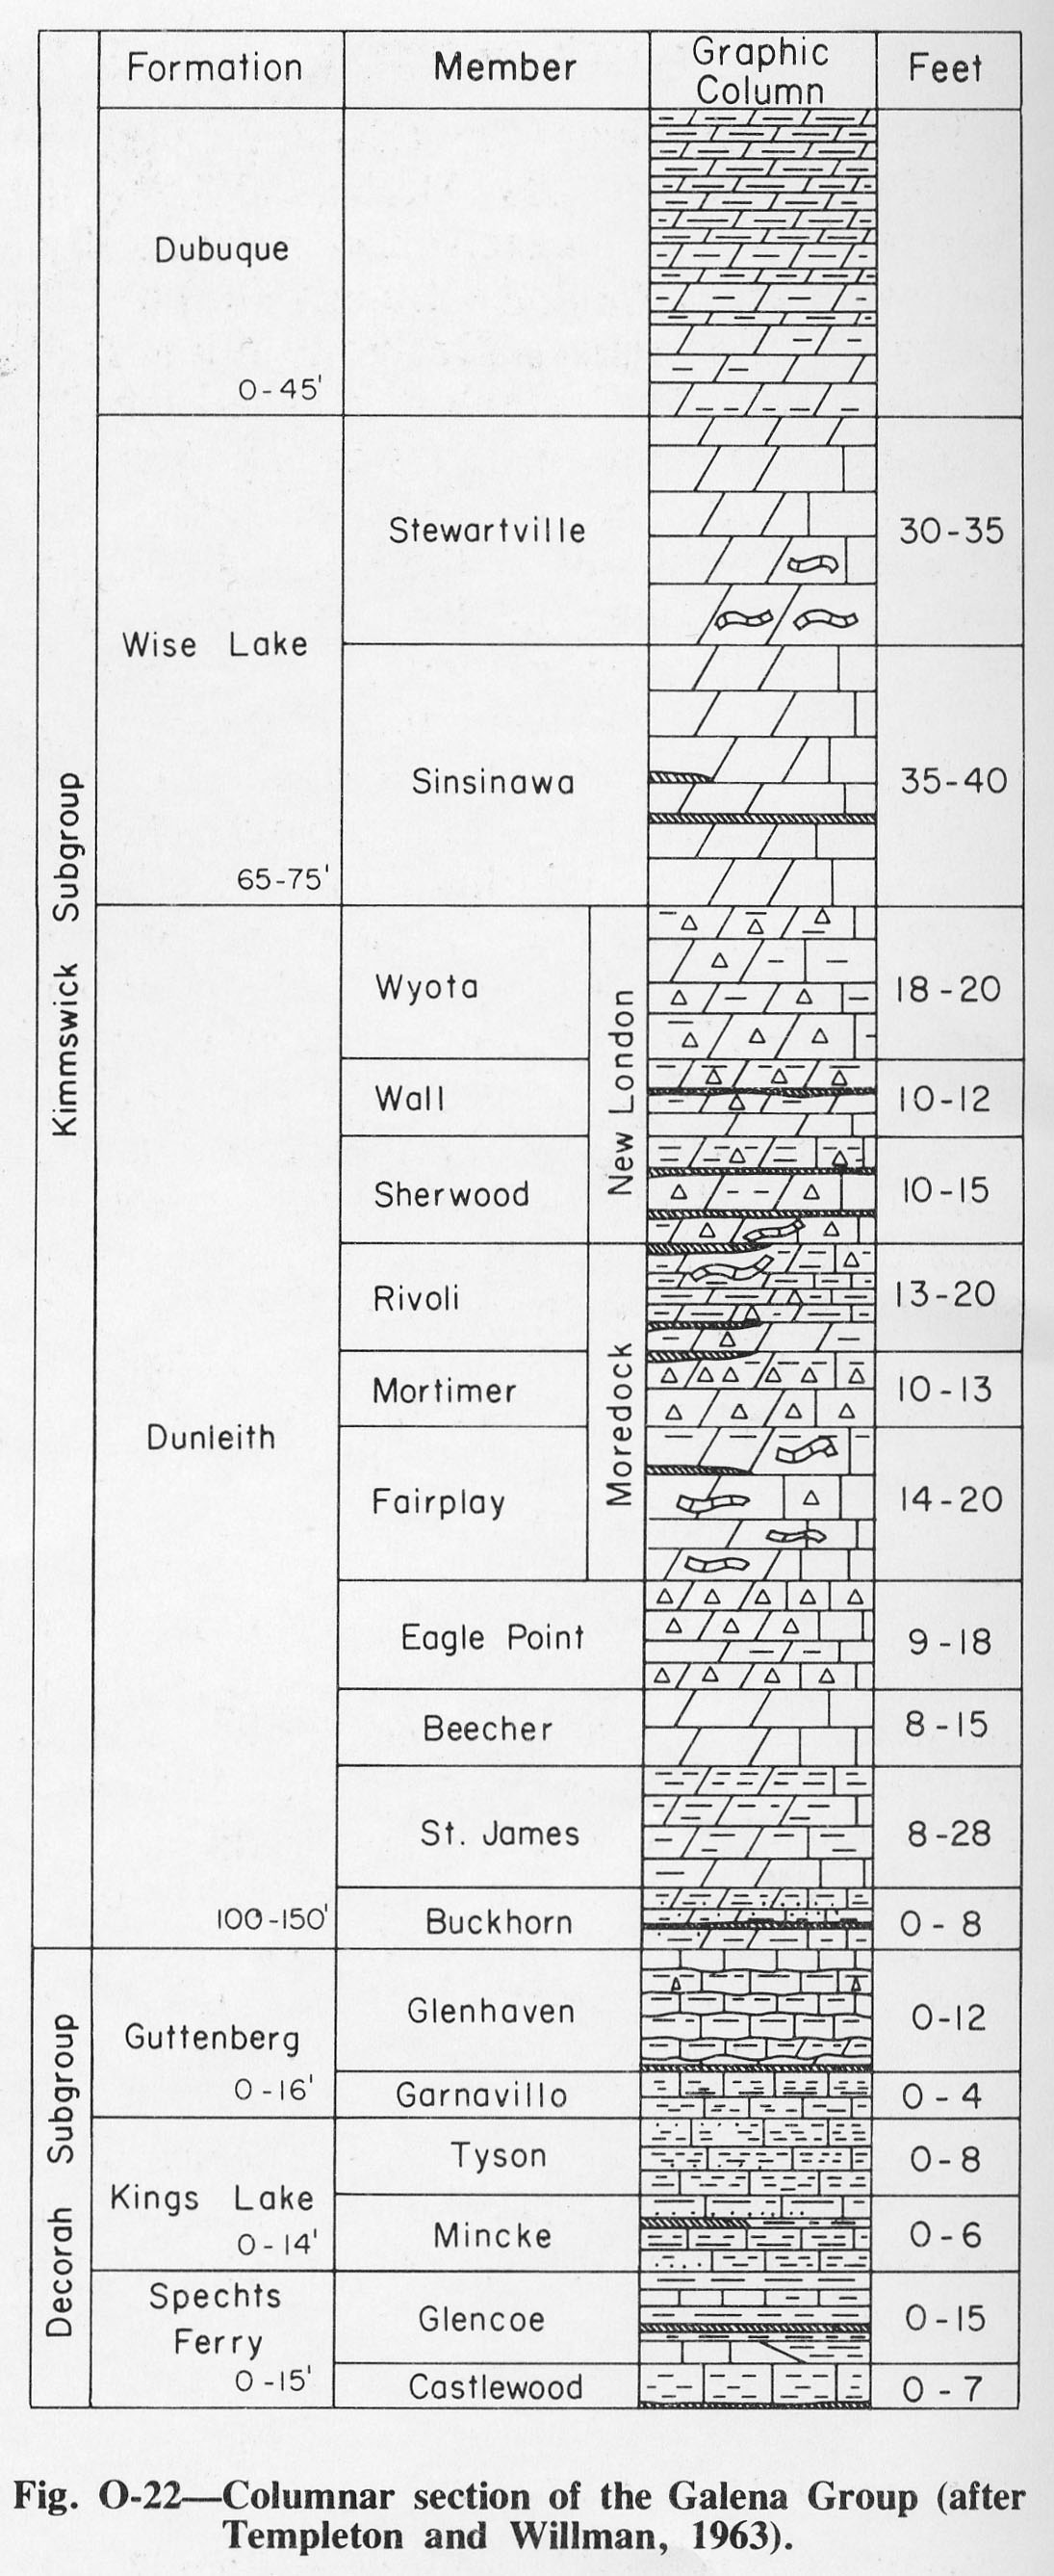
384 KB | Alan.Myers | Fig. O-22 -- Columnar section of the Galena Group (after Templeton and Willman, 1963). | 1 |
| 15:00, 4 April 2016 | Figure O-20.jpg (file) |  |
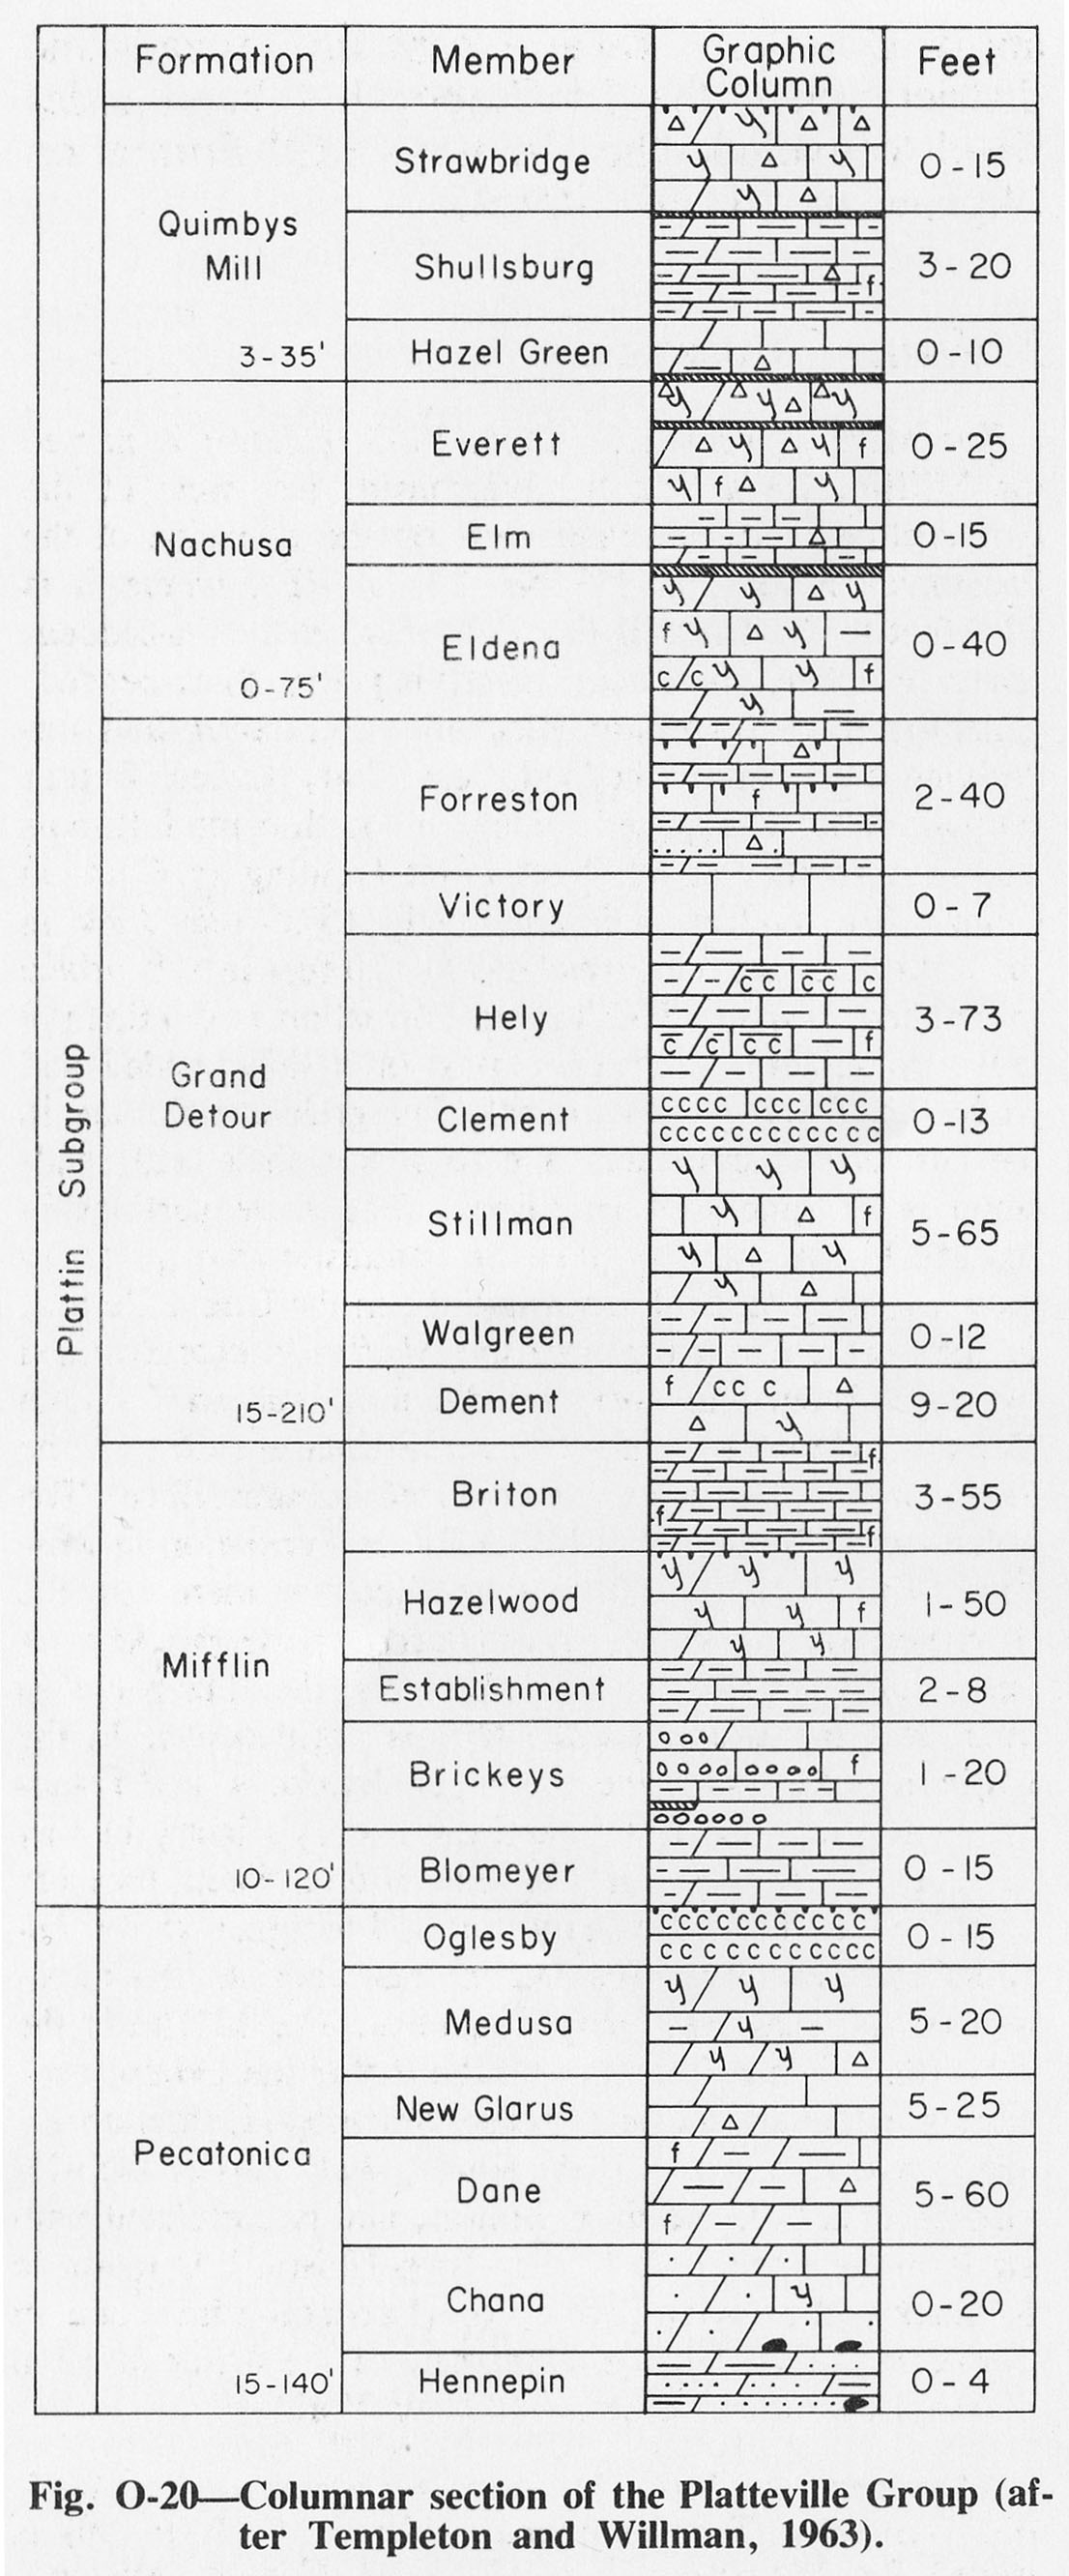
385 KB | Alan.Myers | Fig. O-21 -- Columnar Section of the Platteville GRoup (after Templeton and Willman, 1963). | 1 |
| 14:05, 4 April 2016 | Figure M-23.jpg (file) |  |
386 KB | Alan.Myers | Fig. M-23 -- Thickness of the Aux Vases Sandstone. | 1 |
| 14:56, 4 April 2016 | Figure O-16.jpg (file) |  |
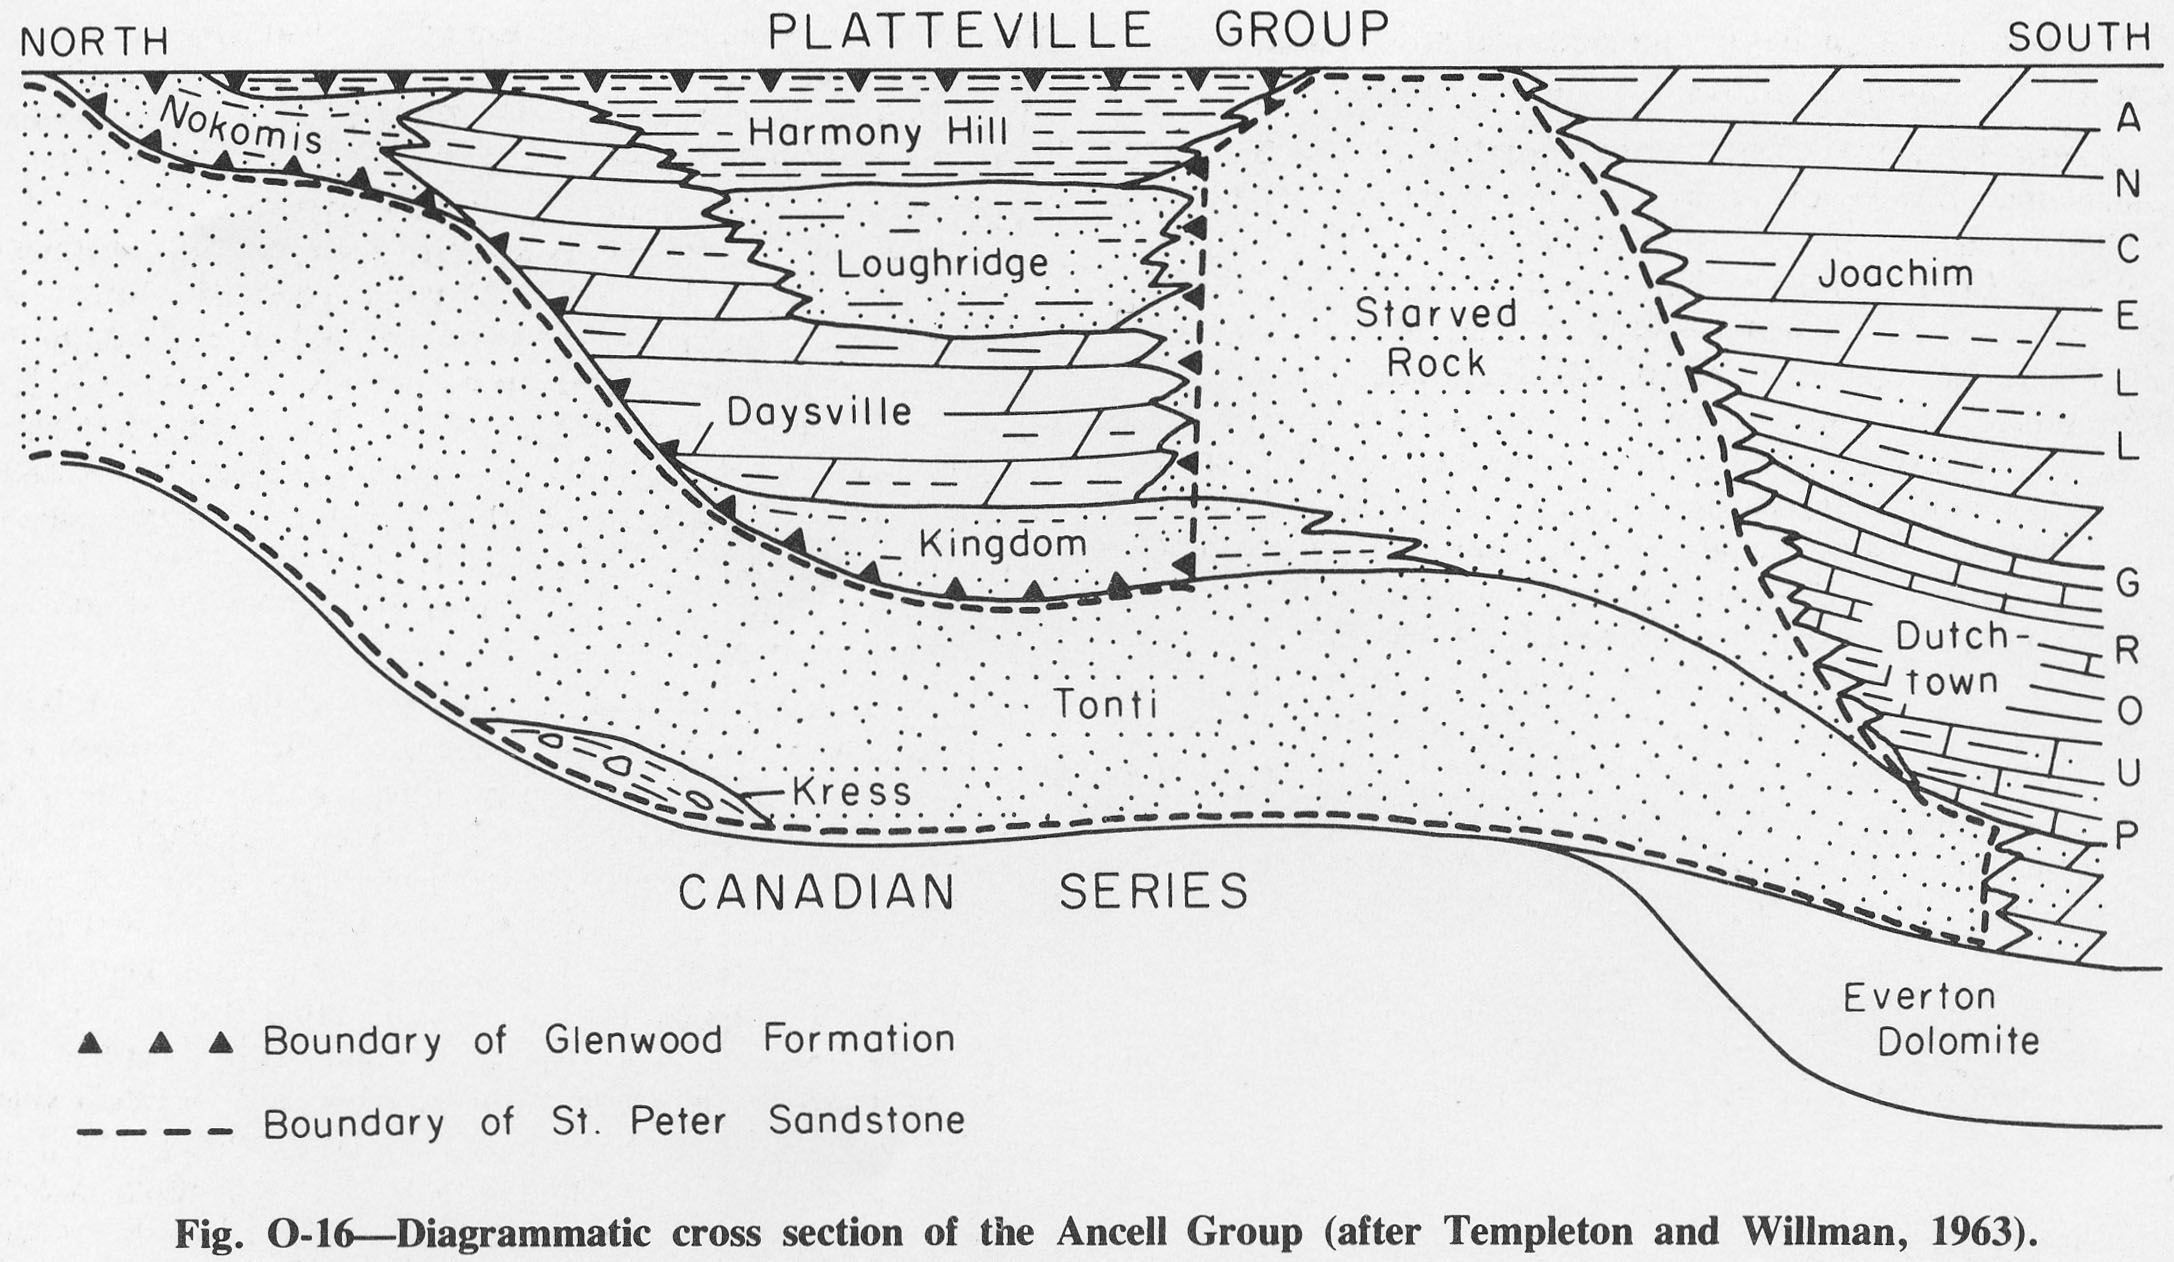
388 KB | Alan.Myers | Fig. O-16 -- Diagrammatic cross section of the Ancell Group (after Templeton and Willman, 1963). | 1 |
| 14:55, 4 April 2016 | Figure O-15.jpg (file) |  |
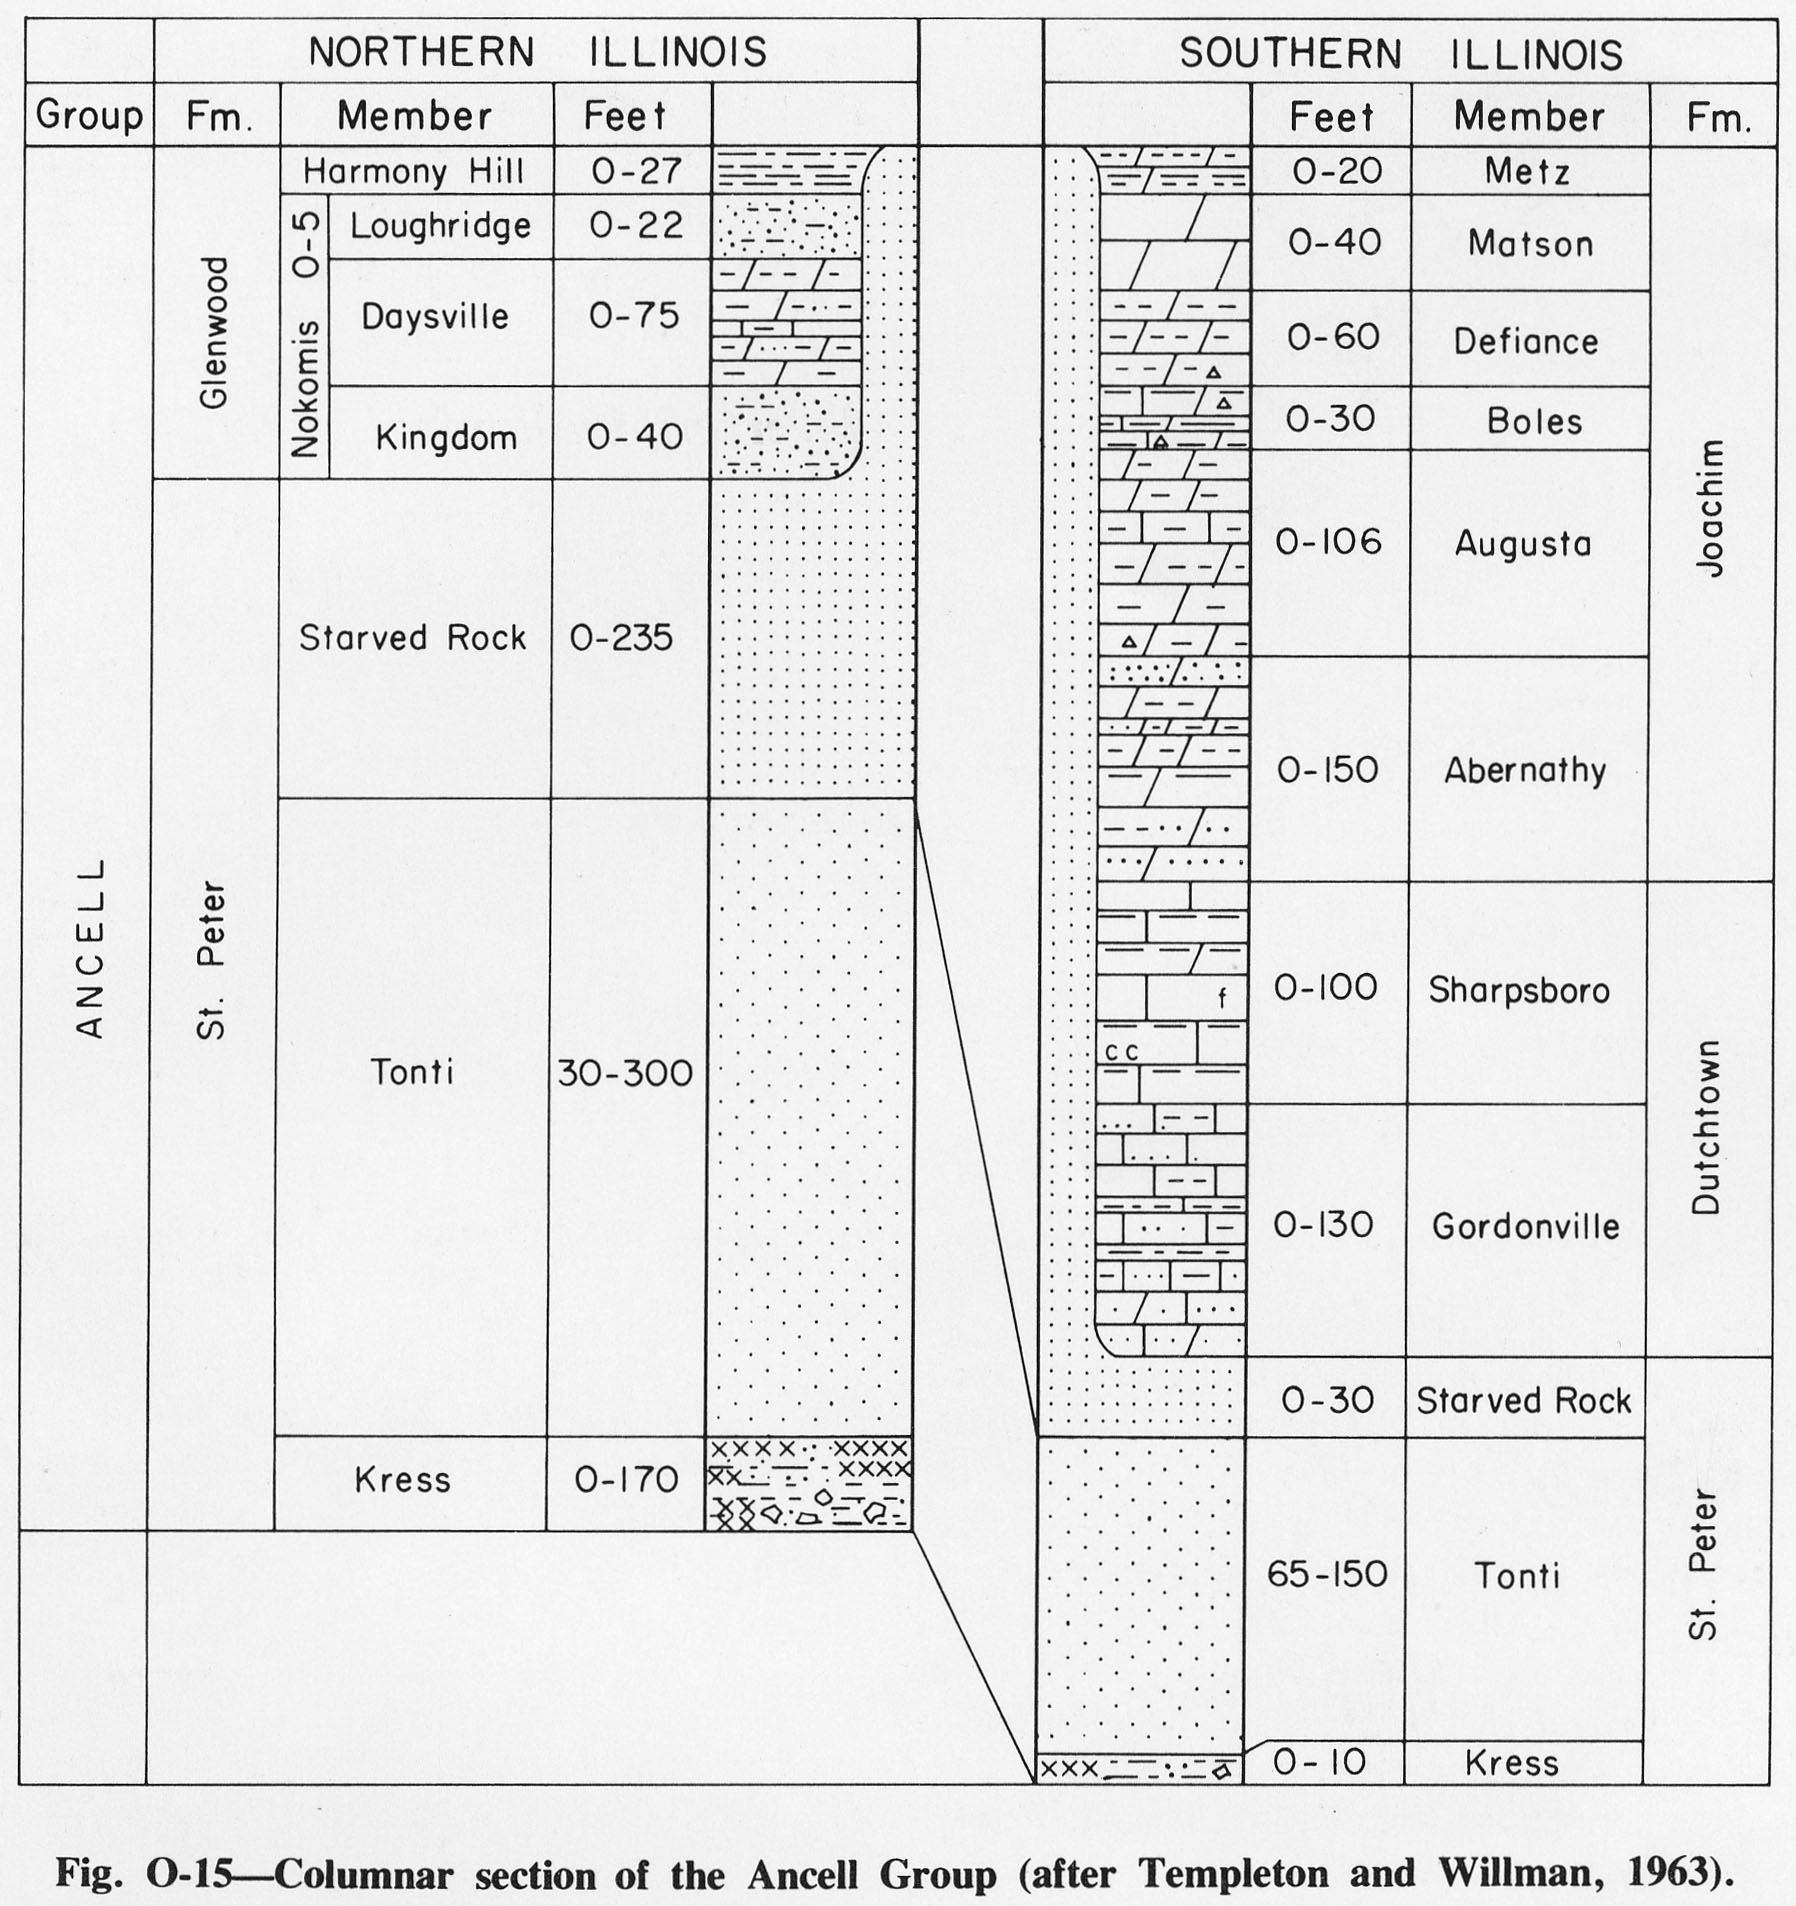
388 KB | Alan.Myers | Fig. O-15 -- Columnar section of the Ancell Group (after Templeton and Willman, 1963). | 1 |
| 19:44, 1 April 2016 | Figure C-5.jpg (file) |  |
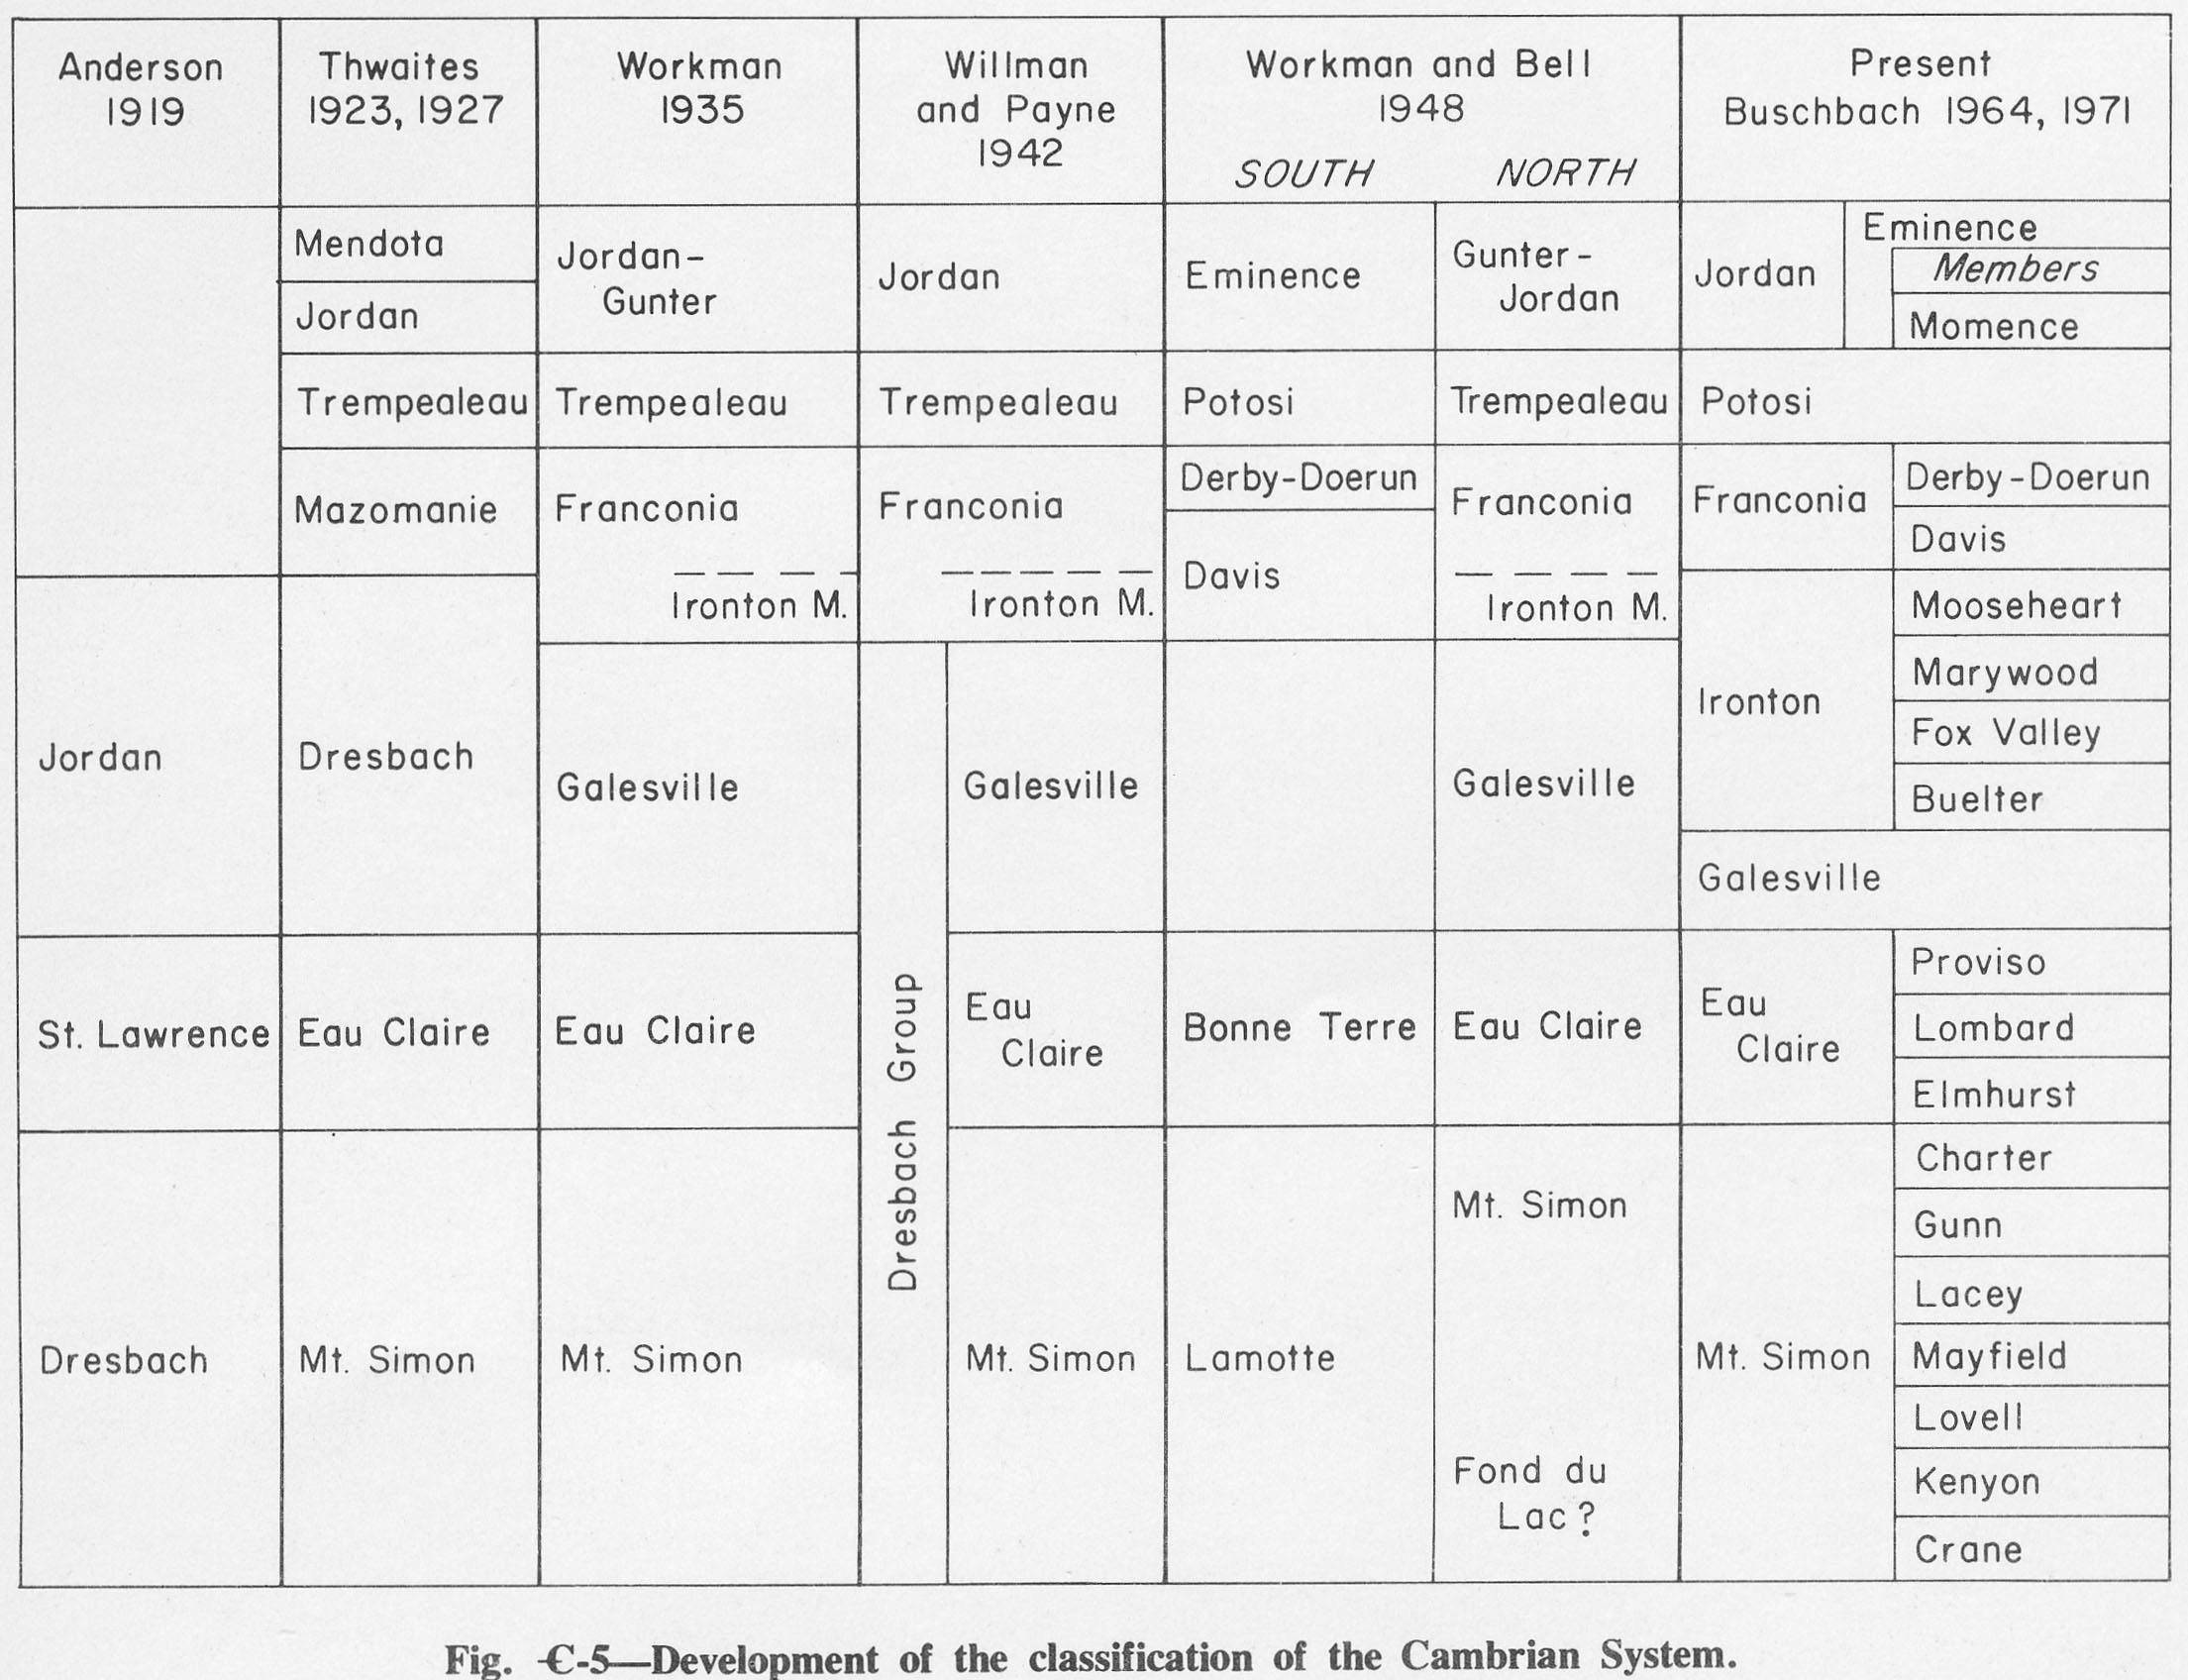
388 KB | Alan.Myers | Fig. C-5 -- Development of the classification of the Cambrian System. | 1 |
| 13:25, 4 April 2016 | Figure M-7.jpg (file) |  |
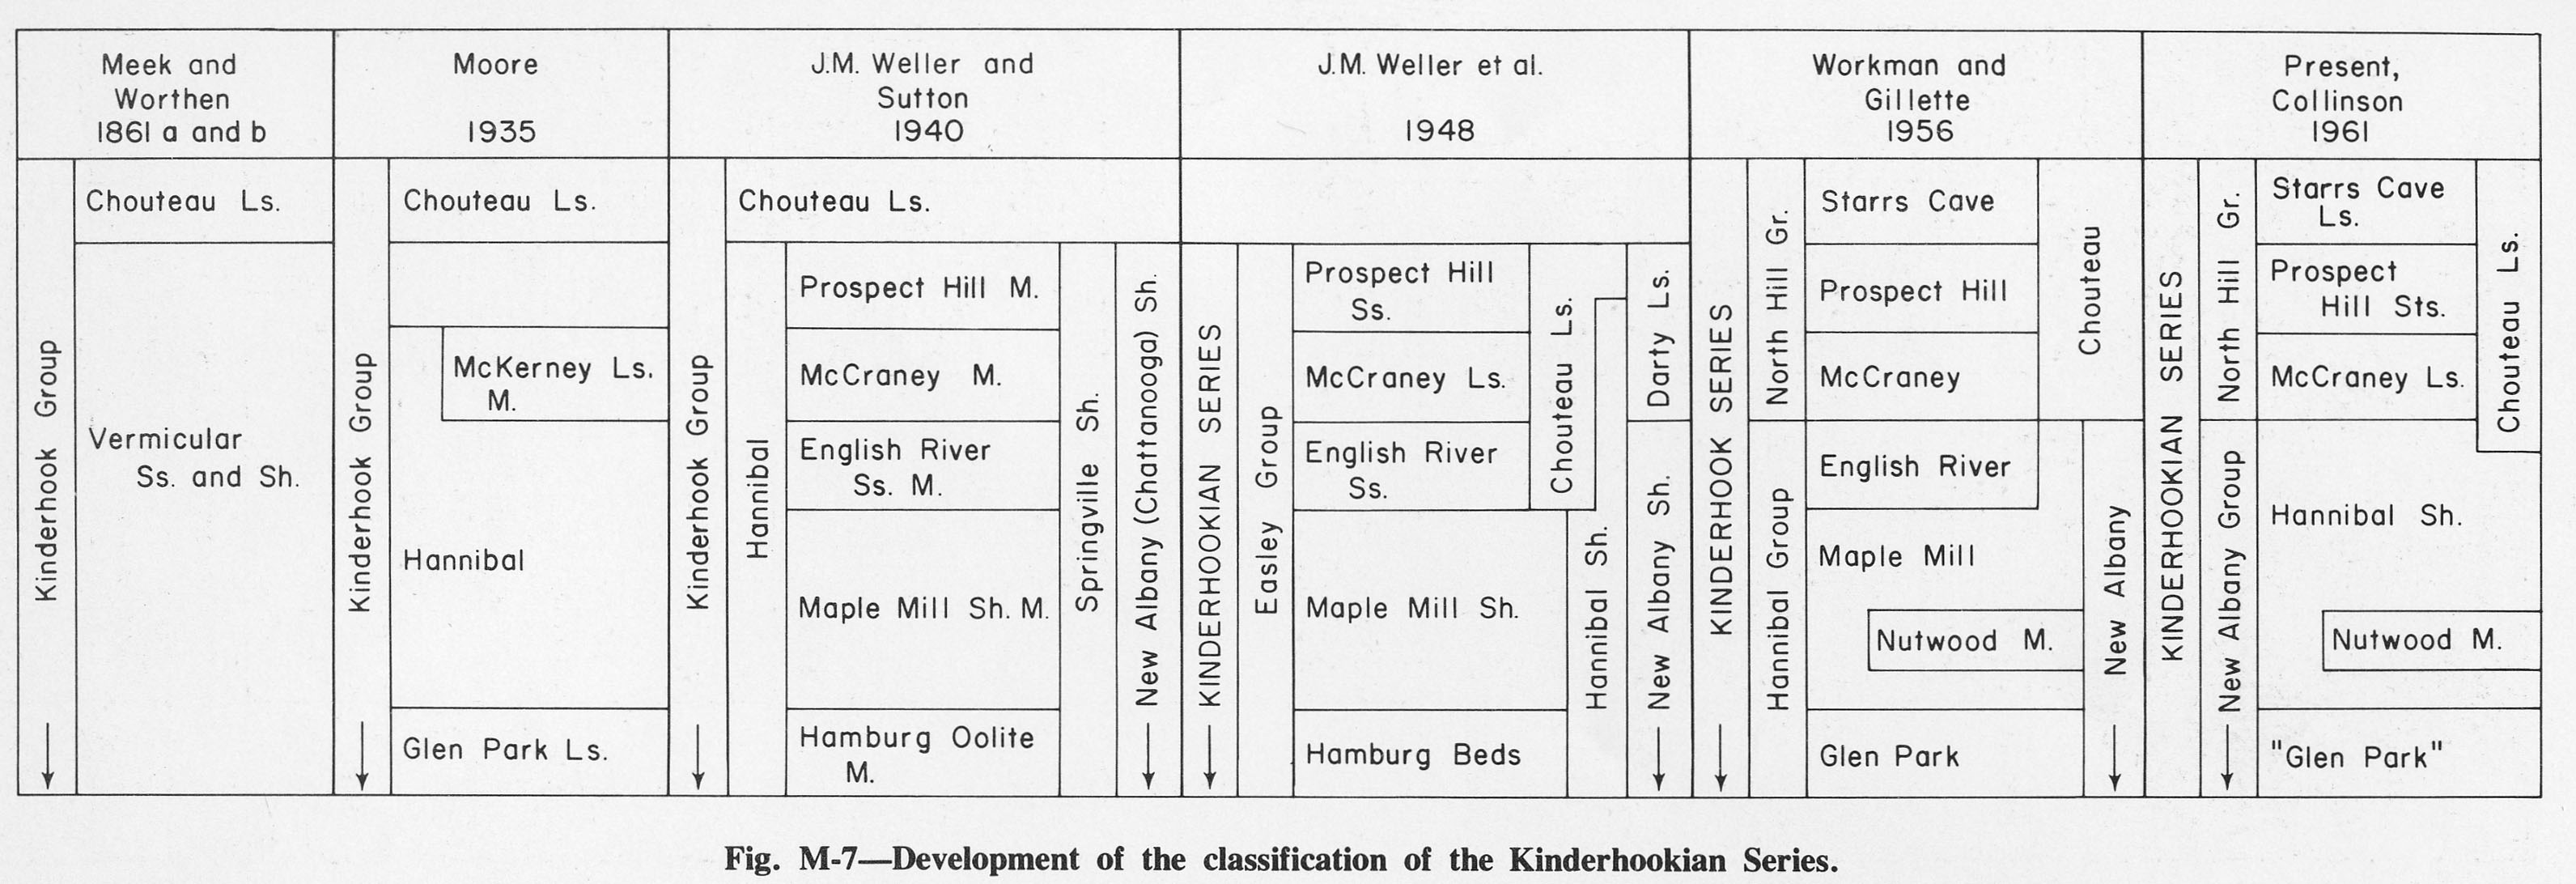
391 KB | Alan.Myers | Fig. M-7 -- Development of the classification of the Kinderhookian Series. | 1 |
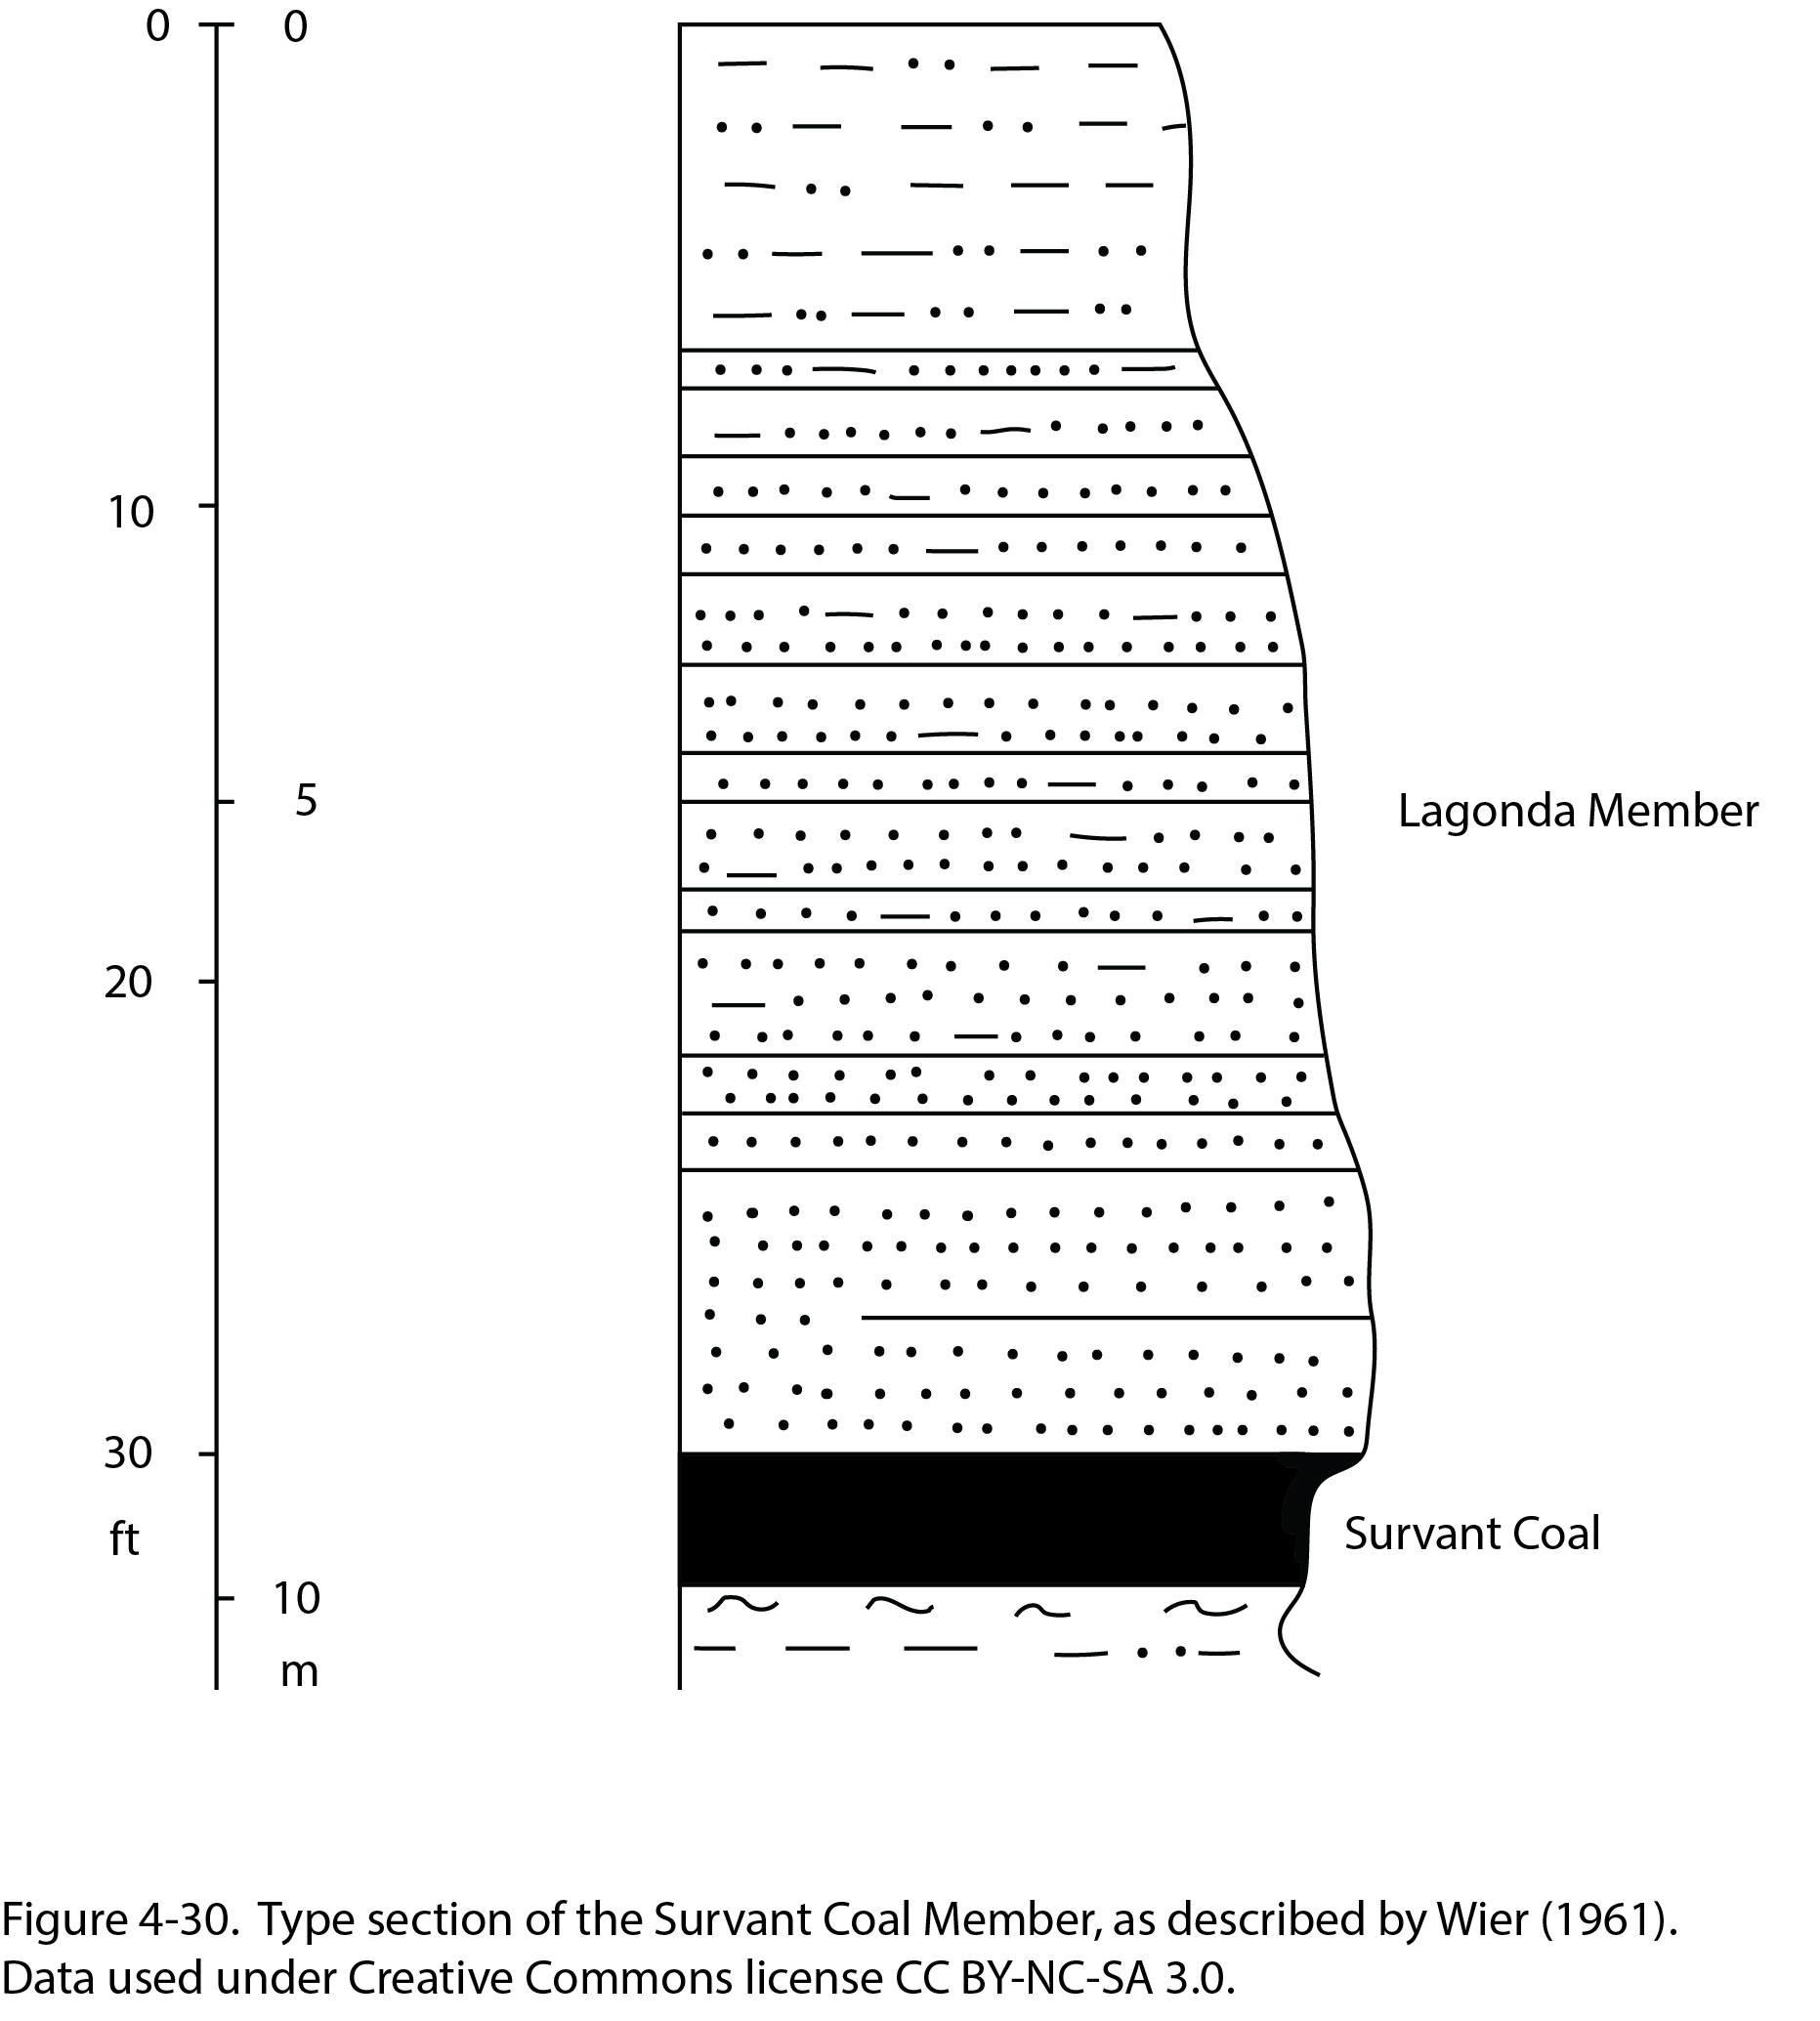
| 16:43, 23 December 2020 | Penn carbondale 4-30.jpg (file) |  |
392 KB | Jennifer.Obrad | 1 | |
| 16:45, 18 April 2016 | 94-fig 14.jpg (file) |  |
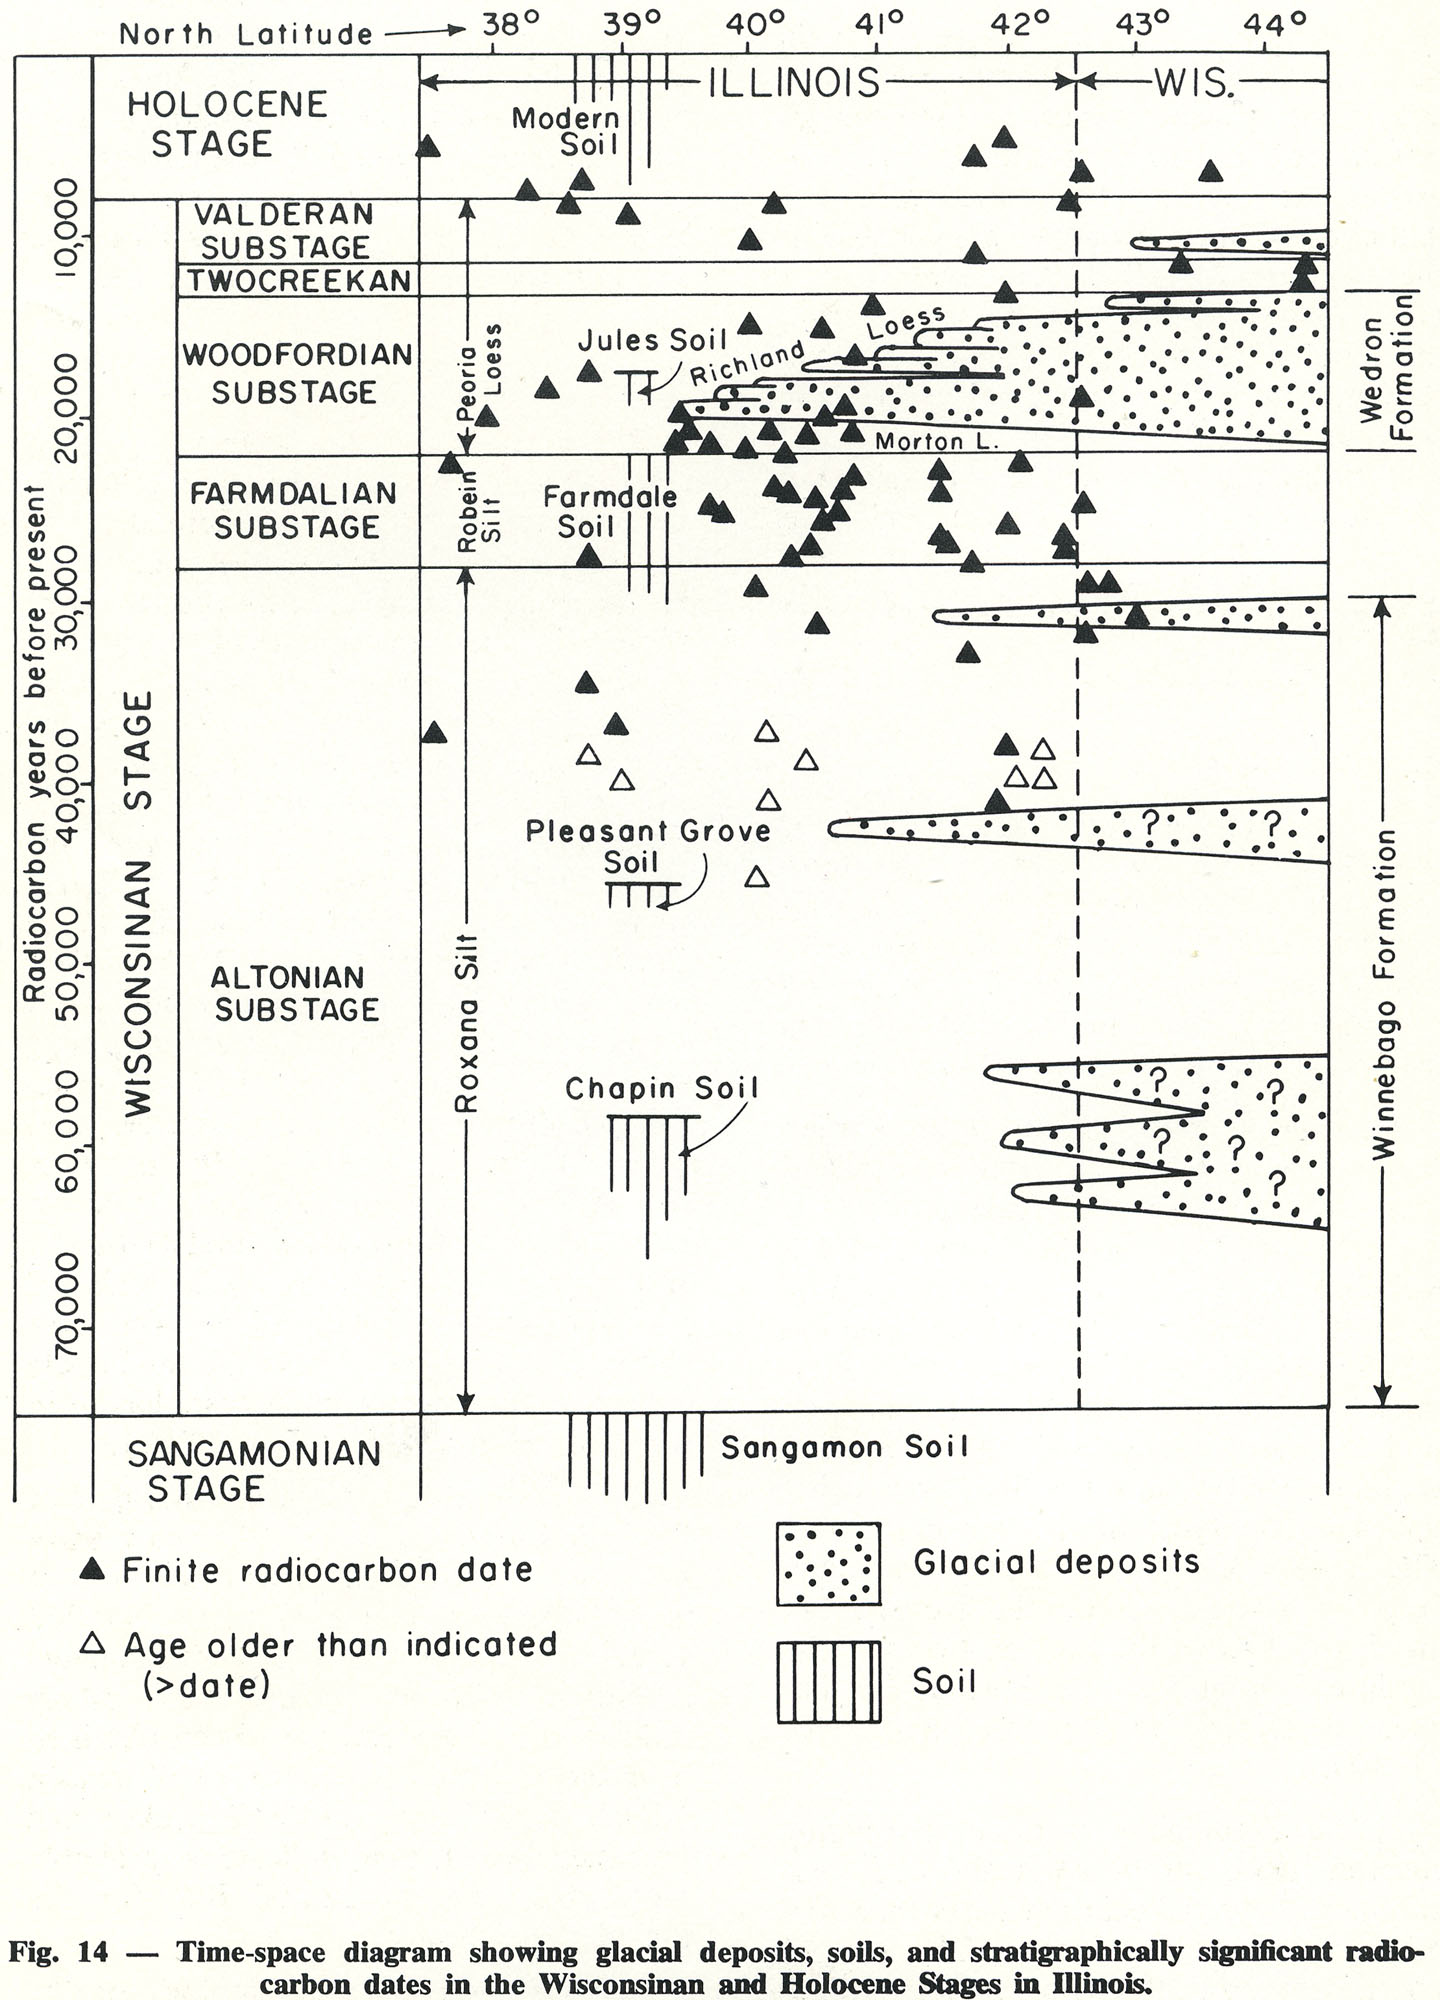
398 KB | Illex-gron | Fig. 14 -- Time-space diagram showing glacial deposits, soils, and stratigraphically significant radio-carbon dates in the Wisconsinan and Holocene Stages in Illinois. | 1 |
| 16:26, 18 April 2016 | 94-fig 5.jpg (file) |  |
399 KB | Illex-gron | Fig. 5 -- Sequence of glaciations and interglacial drainage in Illinois. | 1 |
| 13:30, 4 April 2016 | Figure M-8.jpg (file) |  |
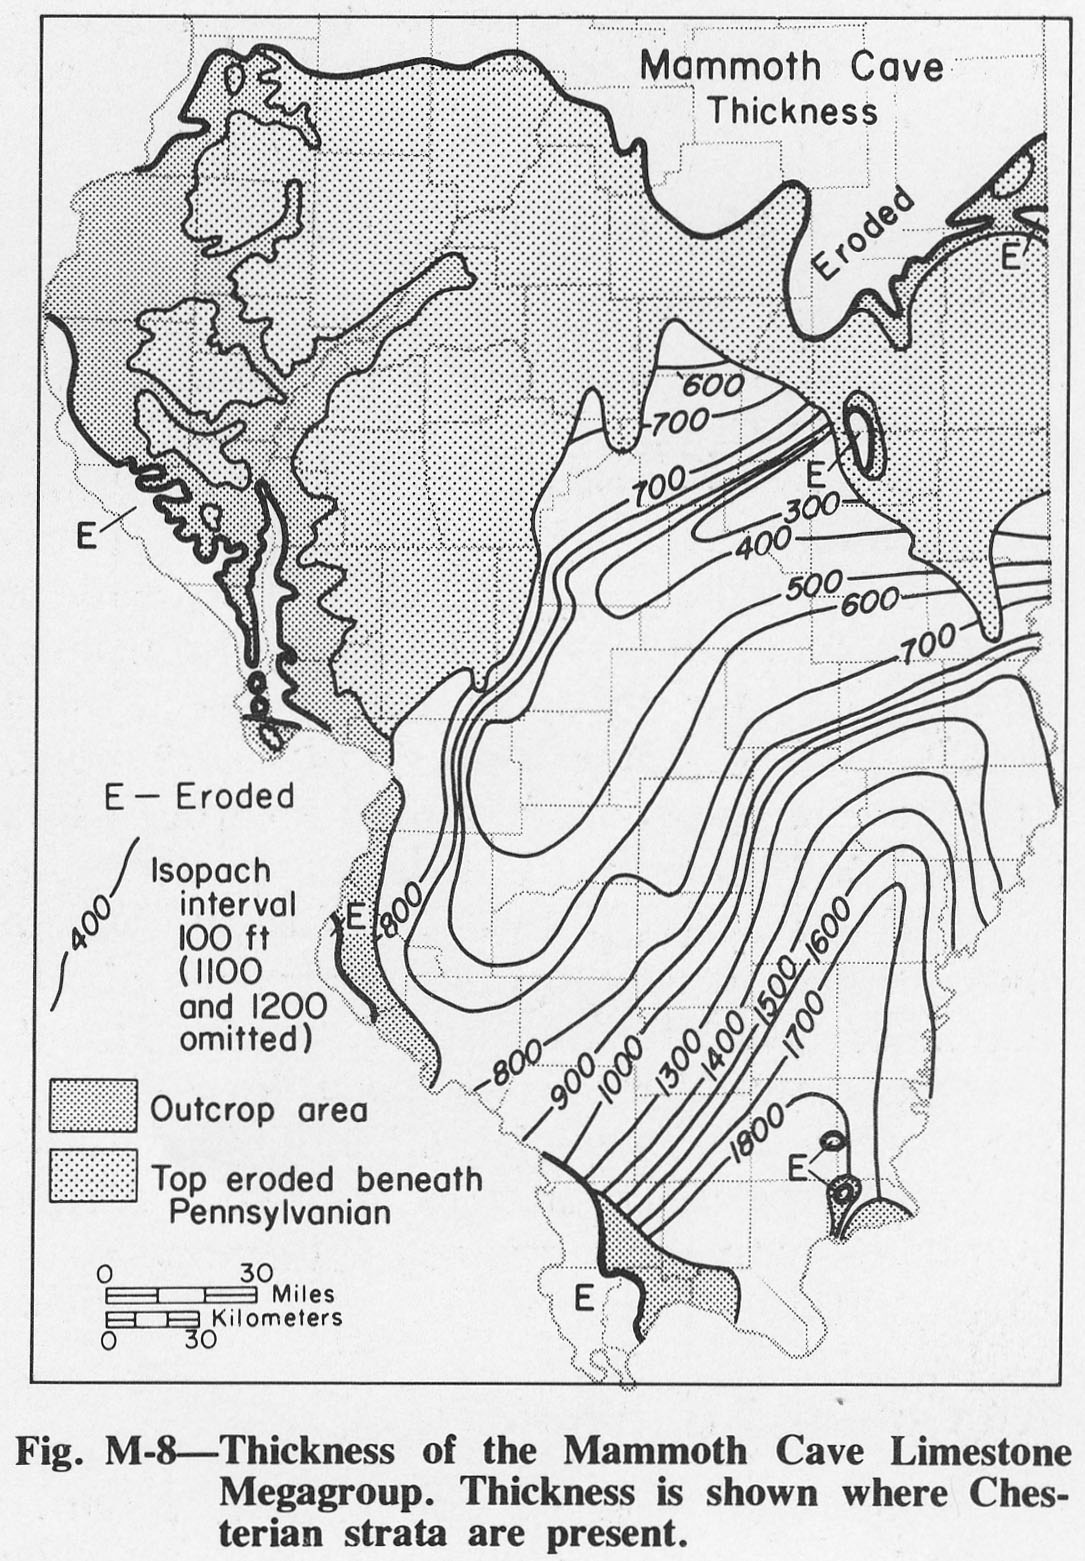
400 KB | Alan.Myers | Fig. M-8 -- Thickness of the Mammoth Cave Limestone Megagroup. Thickness is shown where Chesterian strata are present. | 1 |
| 17:11, 18 April 2016 | 94-tb 5-b.jpg (file) |  |
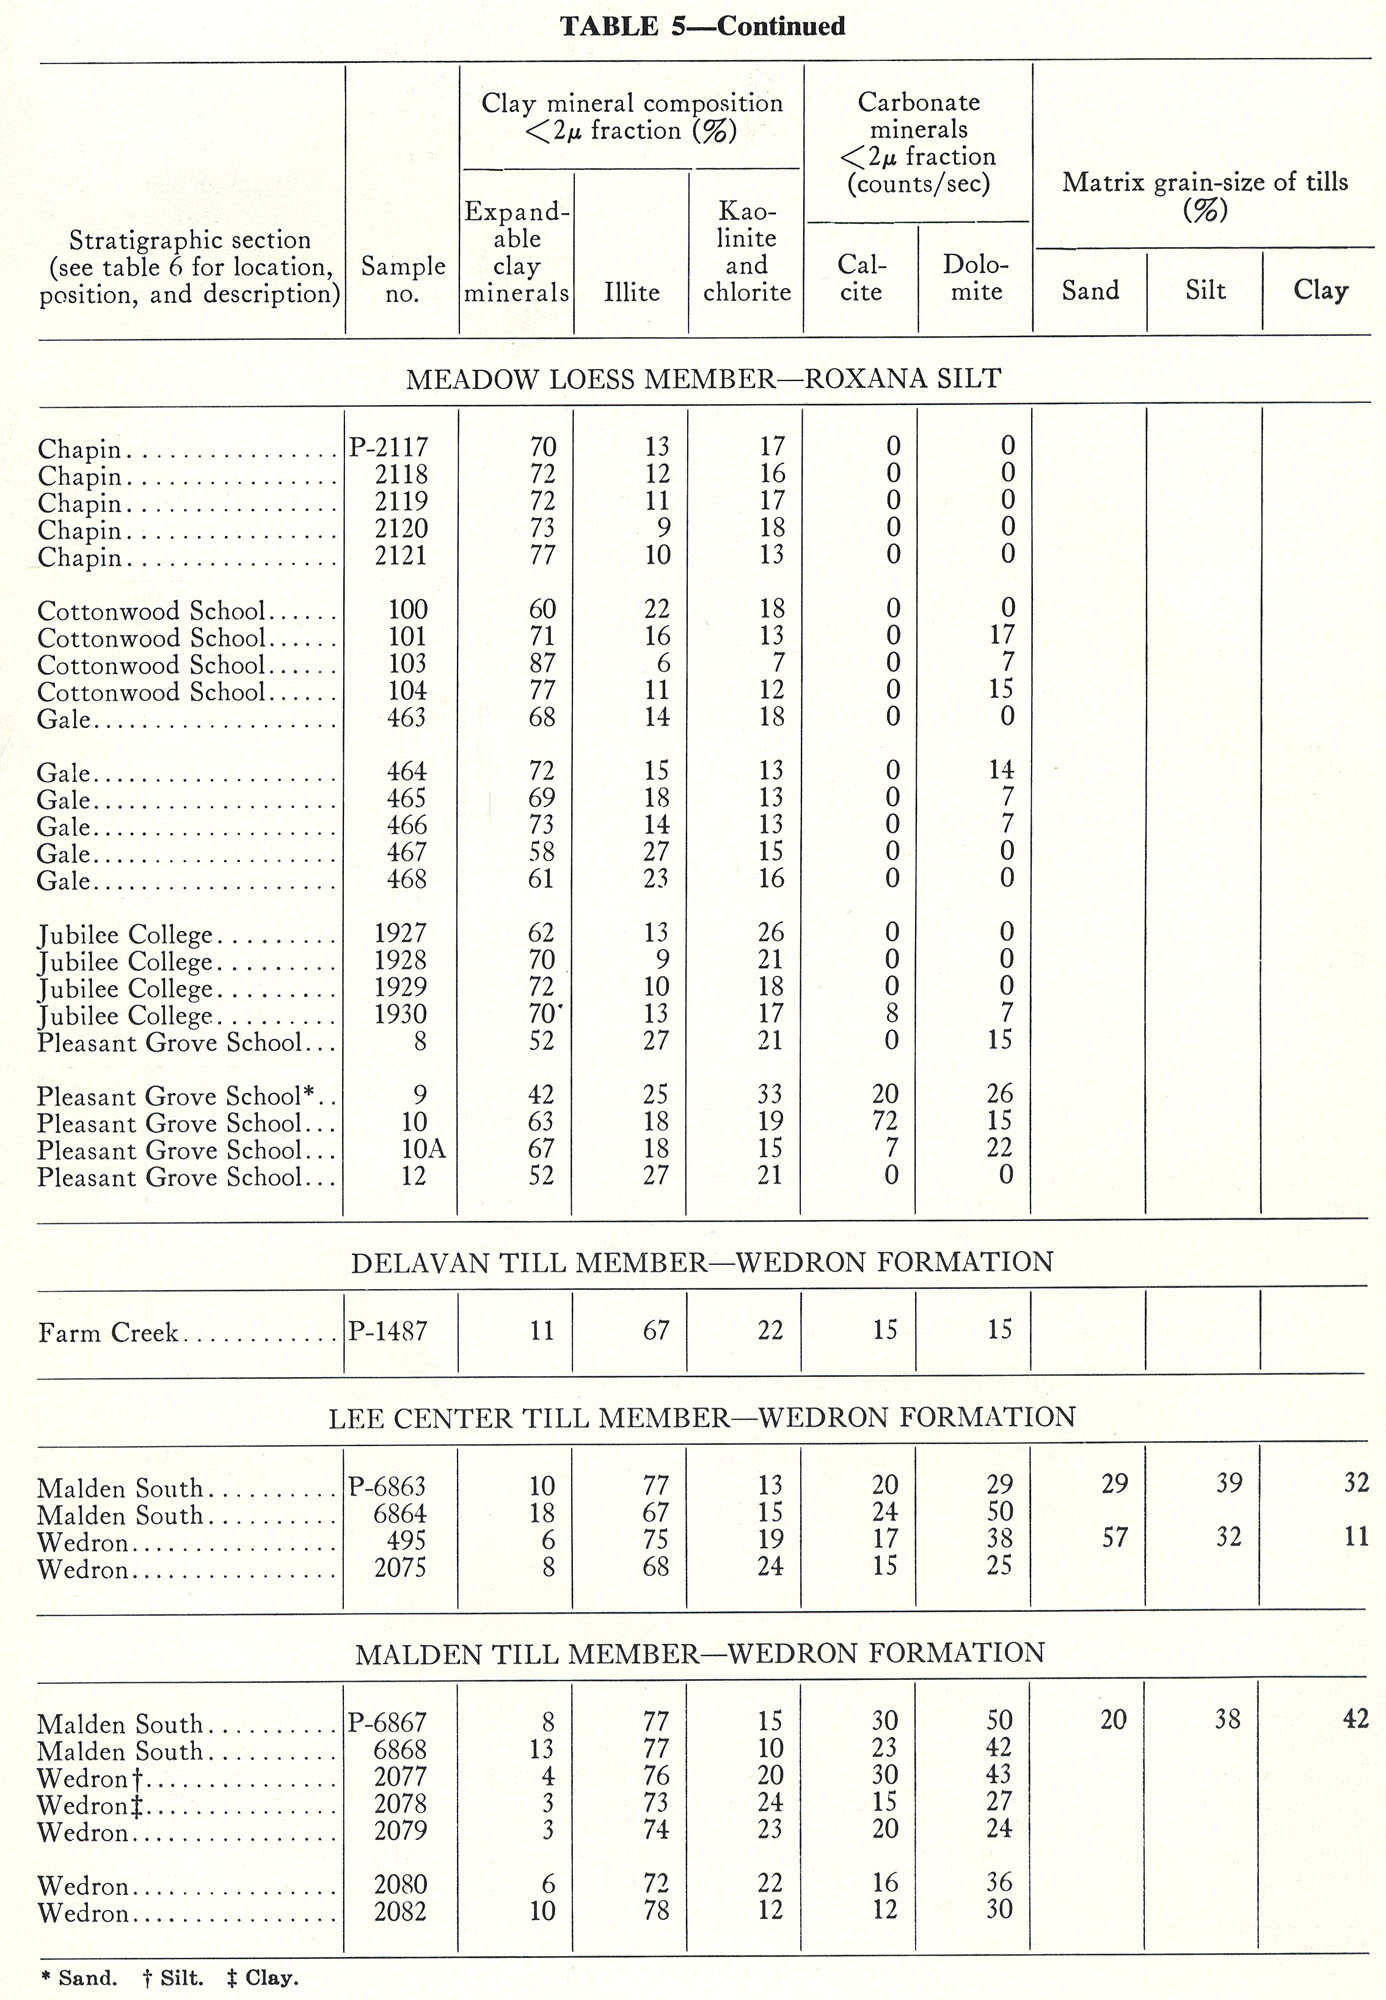
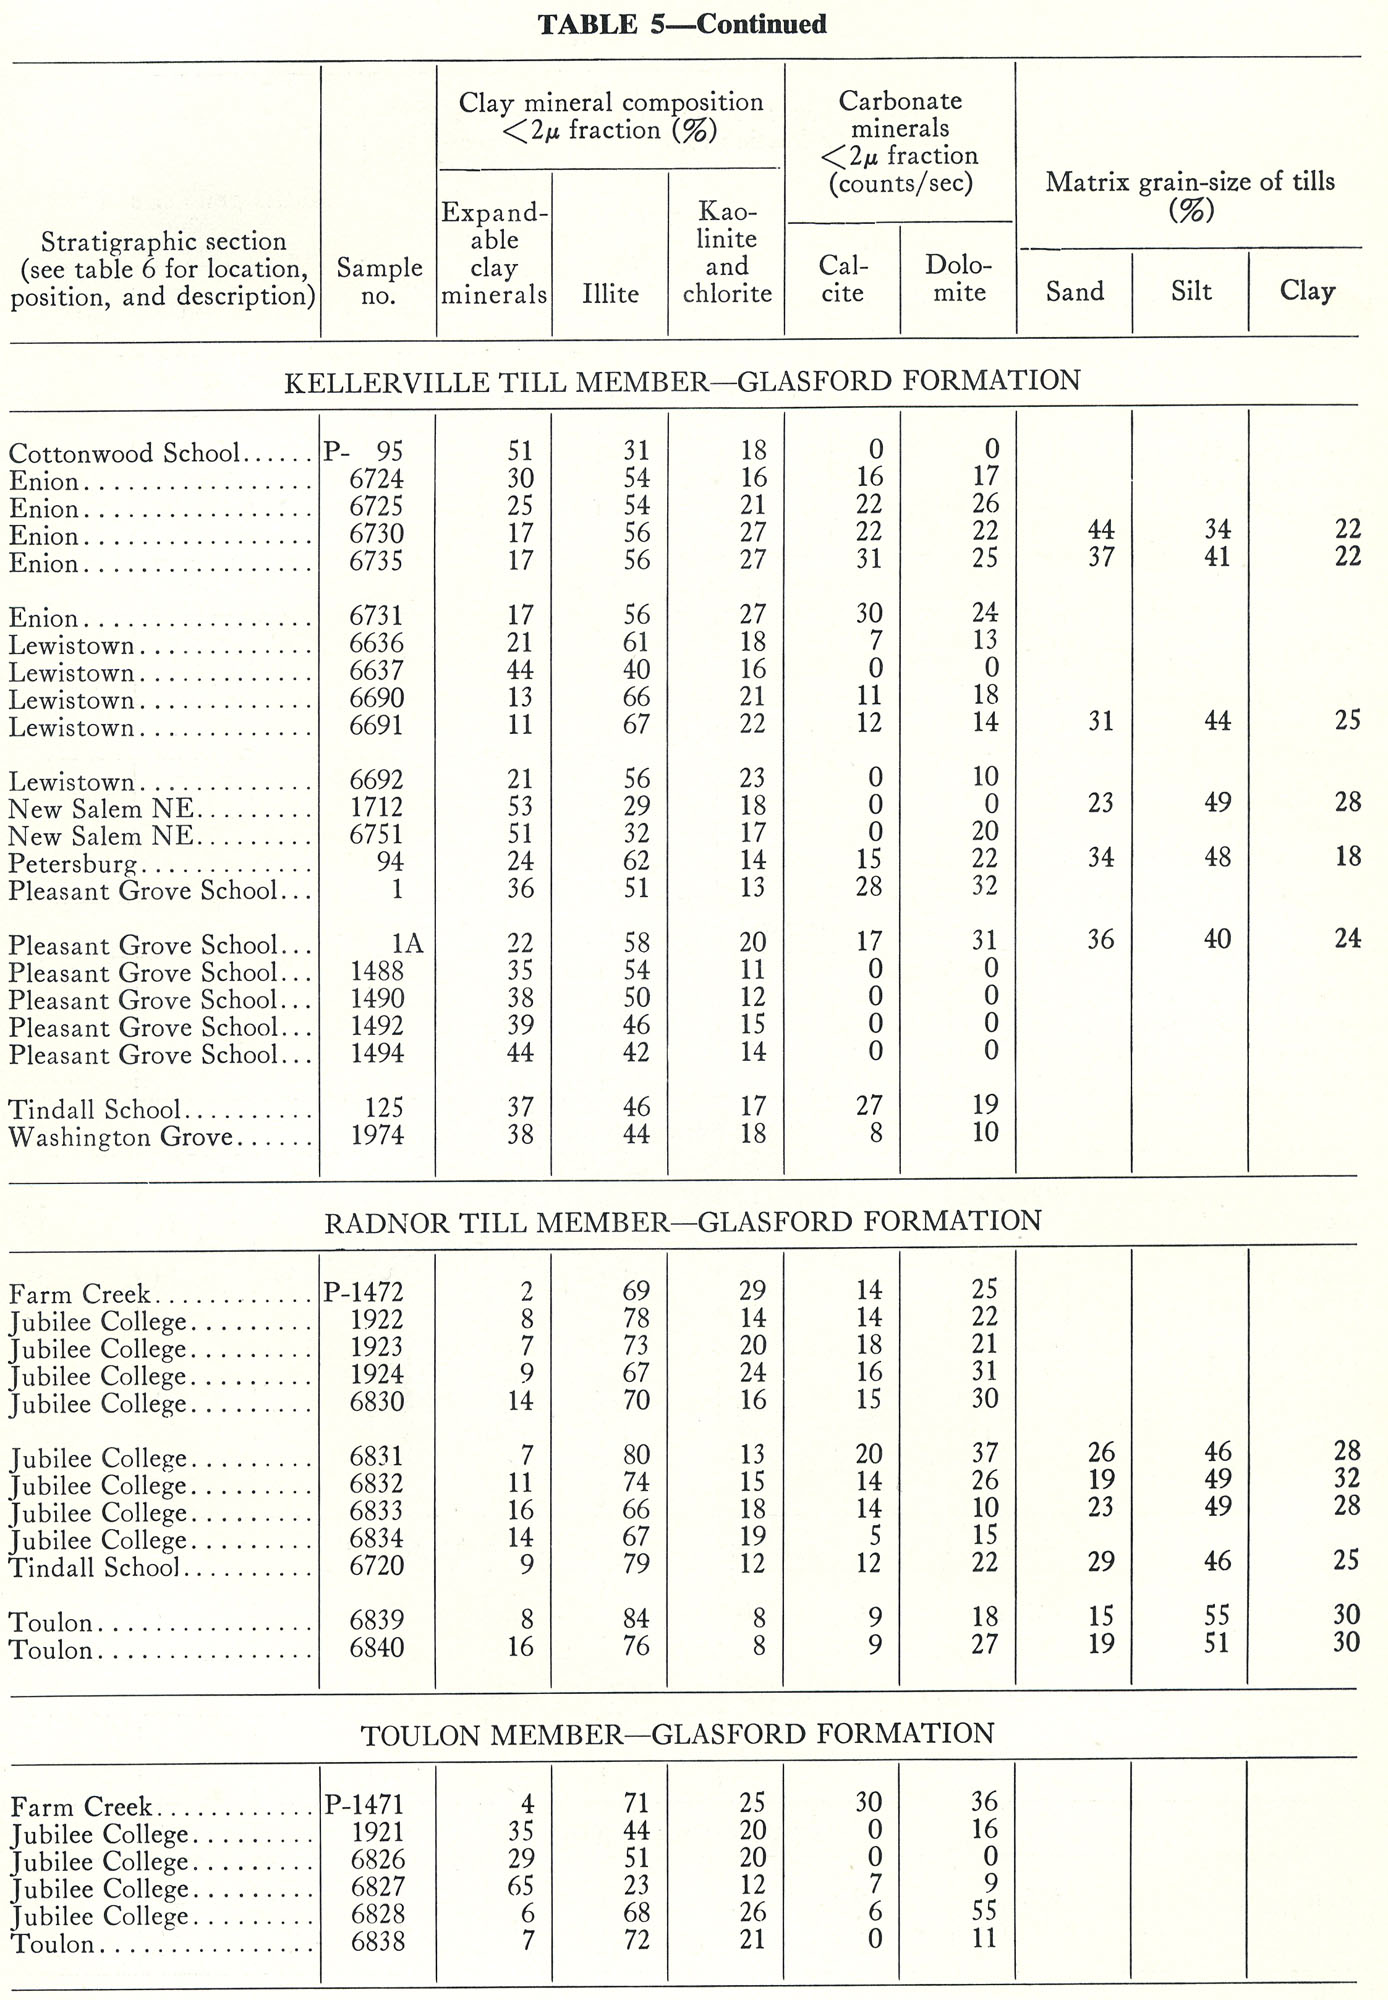
404 KB | Illex-gron | Table 5 - Continued. | 1 |
| 13:56, 4 April 2016 | Figure M-12.jpg (file) |  |
406 KB | Alan.Myers | Fig. M-12 -- Columnar section of the Valmeyeran Series in central Illinois. | 1 |
| 19:56, 1 April 2016 | Figure D-4.jpg (file) |  |
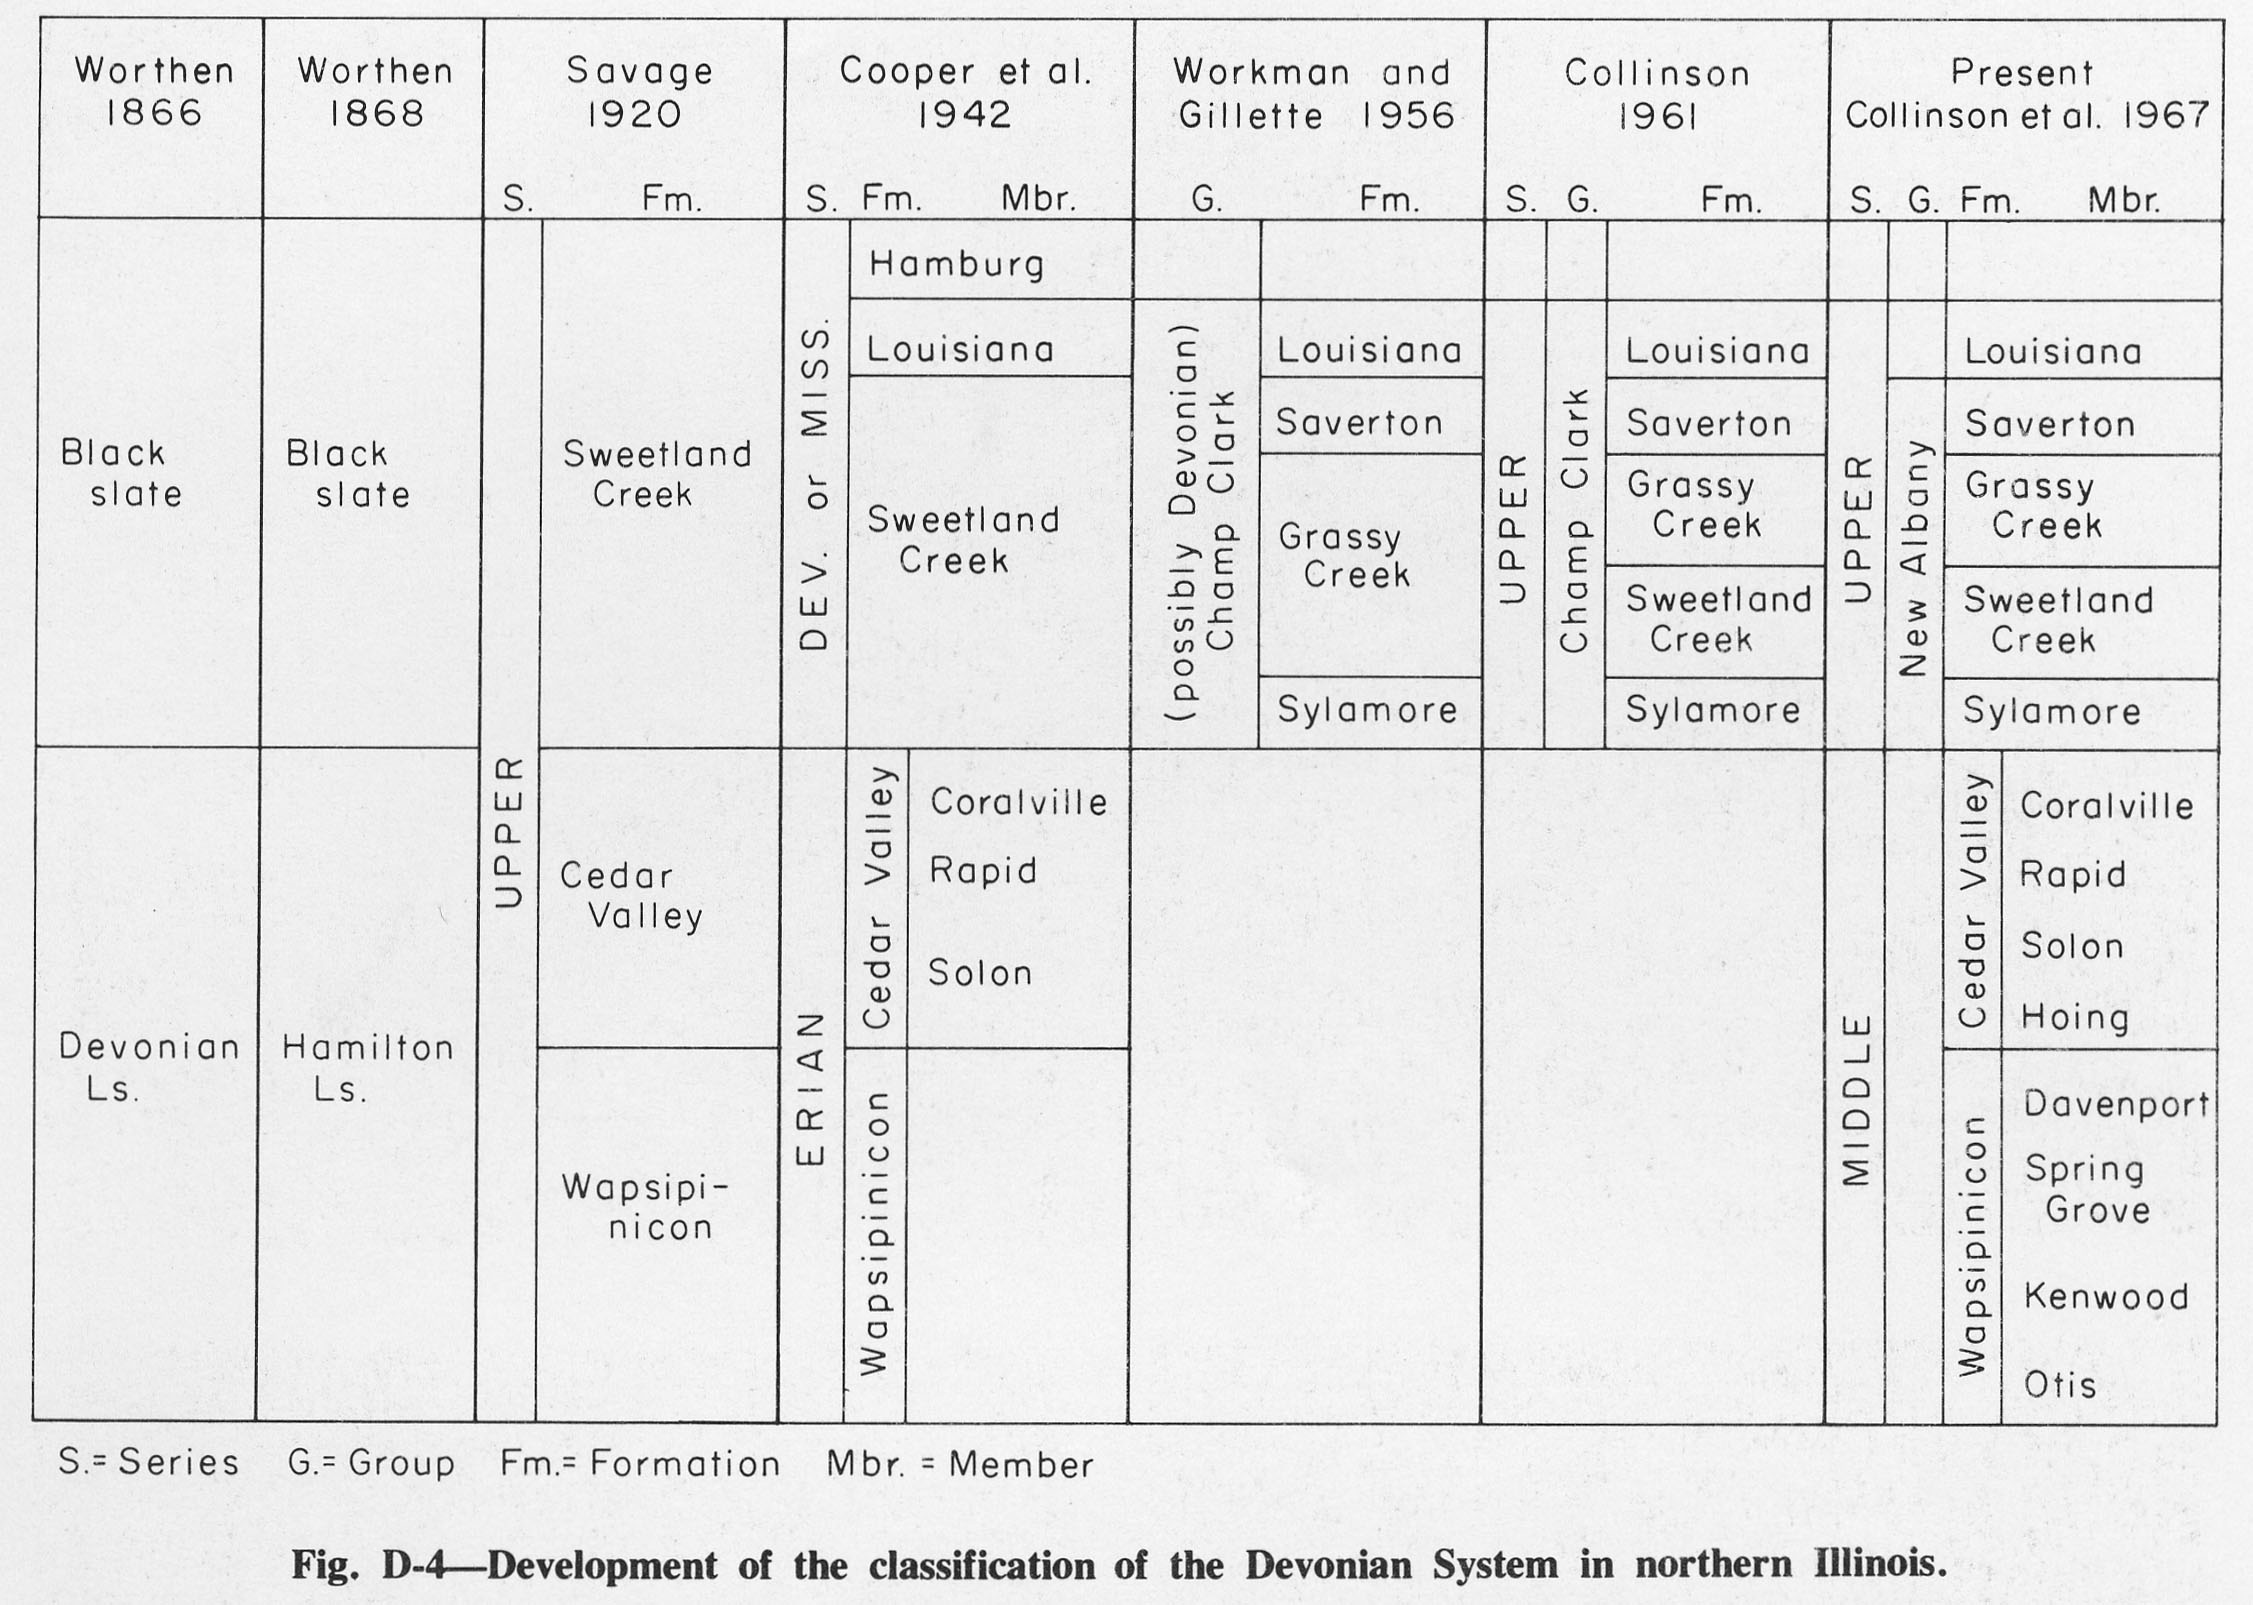
408 KB | Alan.Myers | Fig. D-4 -- Development of the classification of the Devonian System in northern Illinois. | 1 |
| 17:10, 18 April 2016 | 94-tb 5-a.jpg (file) |  |
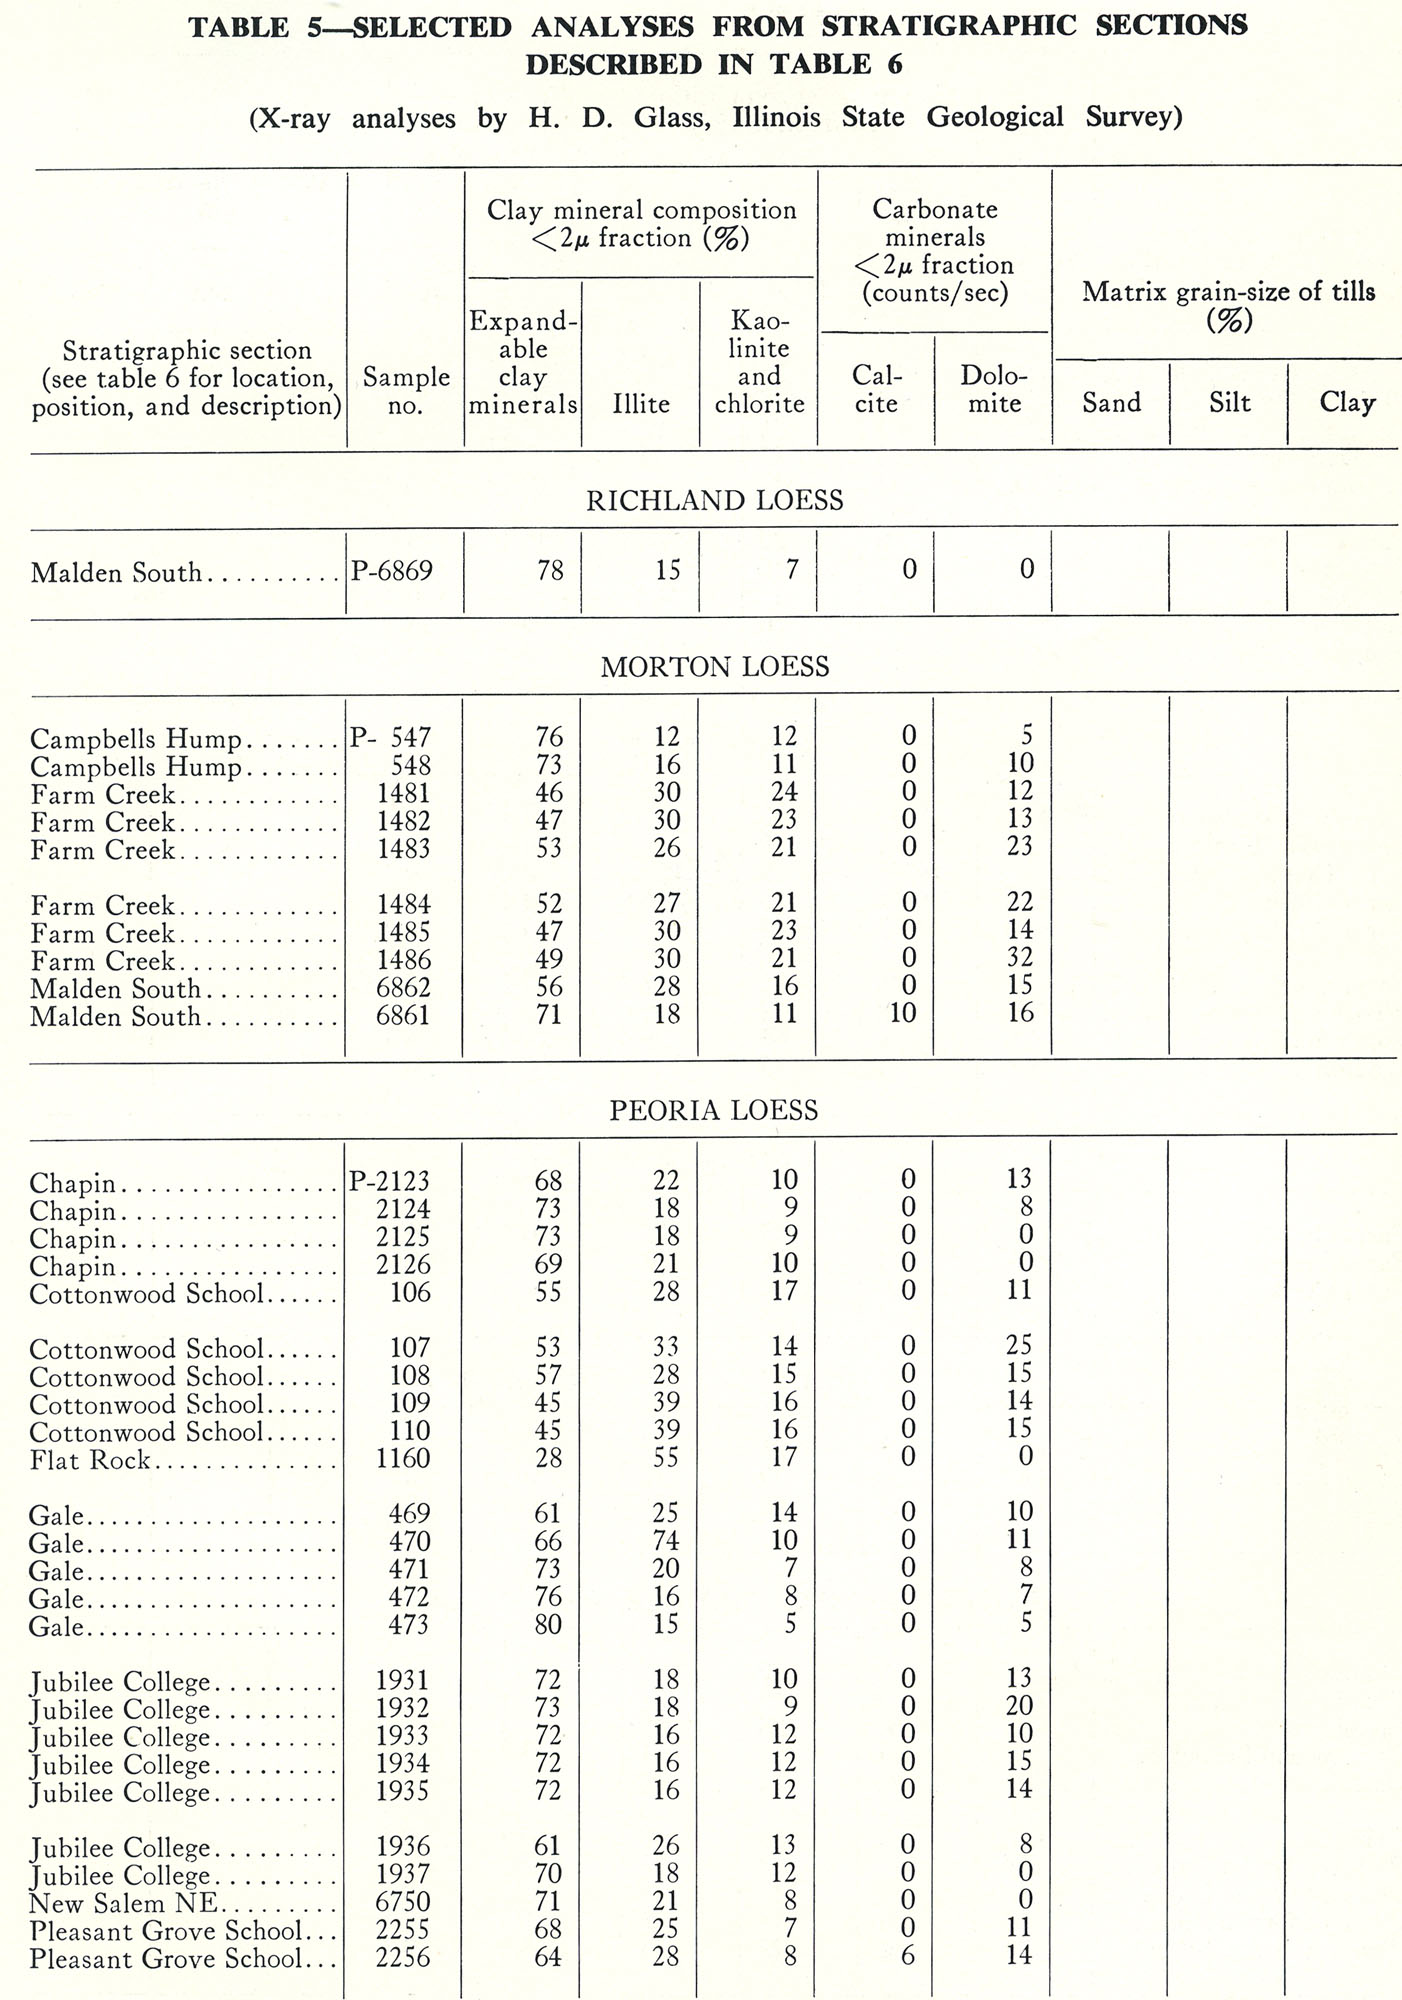
410 KB | Illex-gron | Table 5 -- Selected Analyses from Stratigraphic Sections Described in Table 6 (X-ray analyses by H. D. Glass, Illinois State Geological Survey). | 1 |
| 19:21, 10 July 2020 | C605-Figure-32.jpg (file) |  |
411 KB | Alan.Myers | 1 | |
| 17:12, 18 April 2016 | 94-tb 5-d.jpg (file) |  |
414 KB | Illex-gron | Table 5 -- Continued. | 1 |
| 17:11, 18 April 2016 | 94-tb 5-c.jpg (file) |  |
414 KB | Illex-gron | Table 5 -- Continued. | 1 |
| 13:57, 4 April 2016 | Figure M-13.jpg (file) |  |
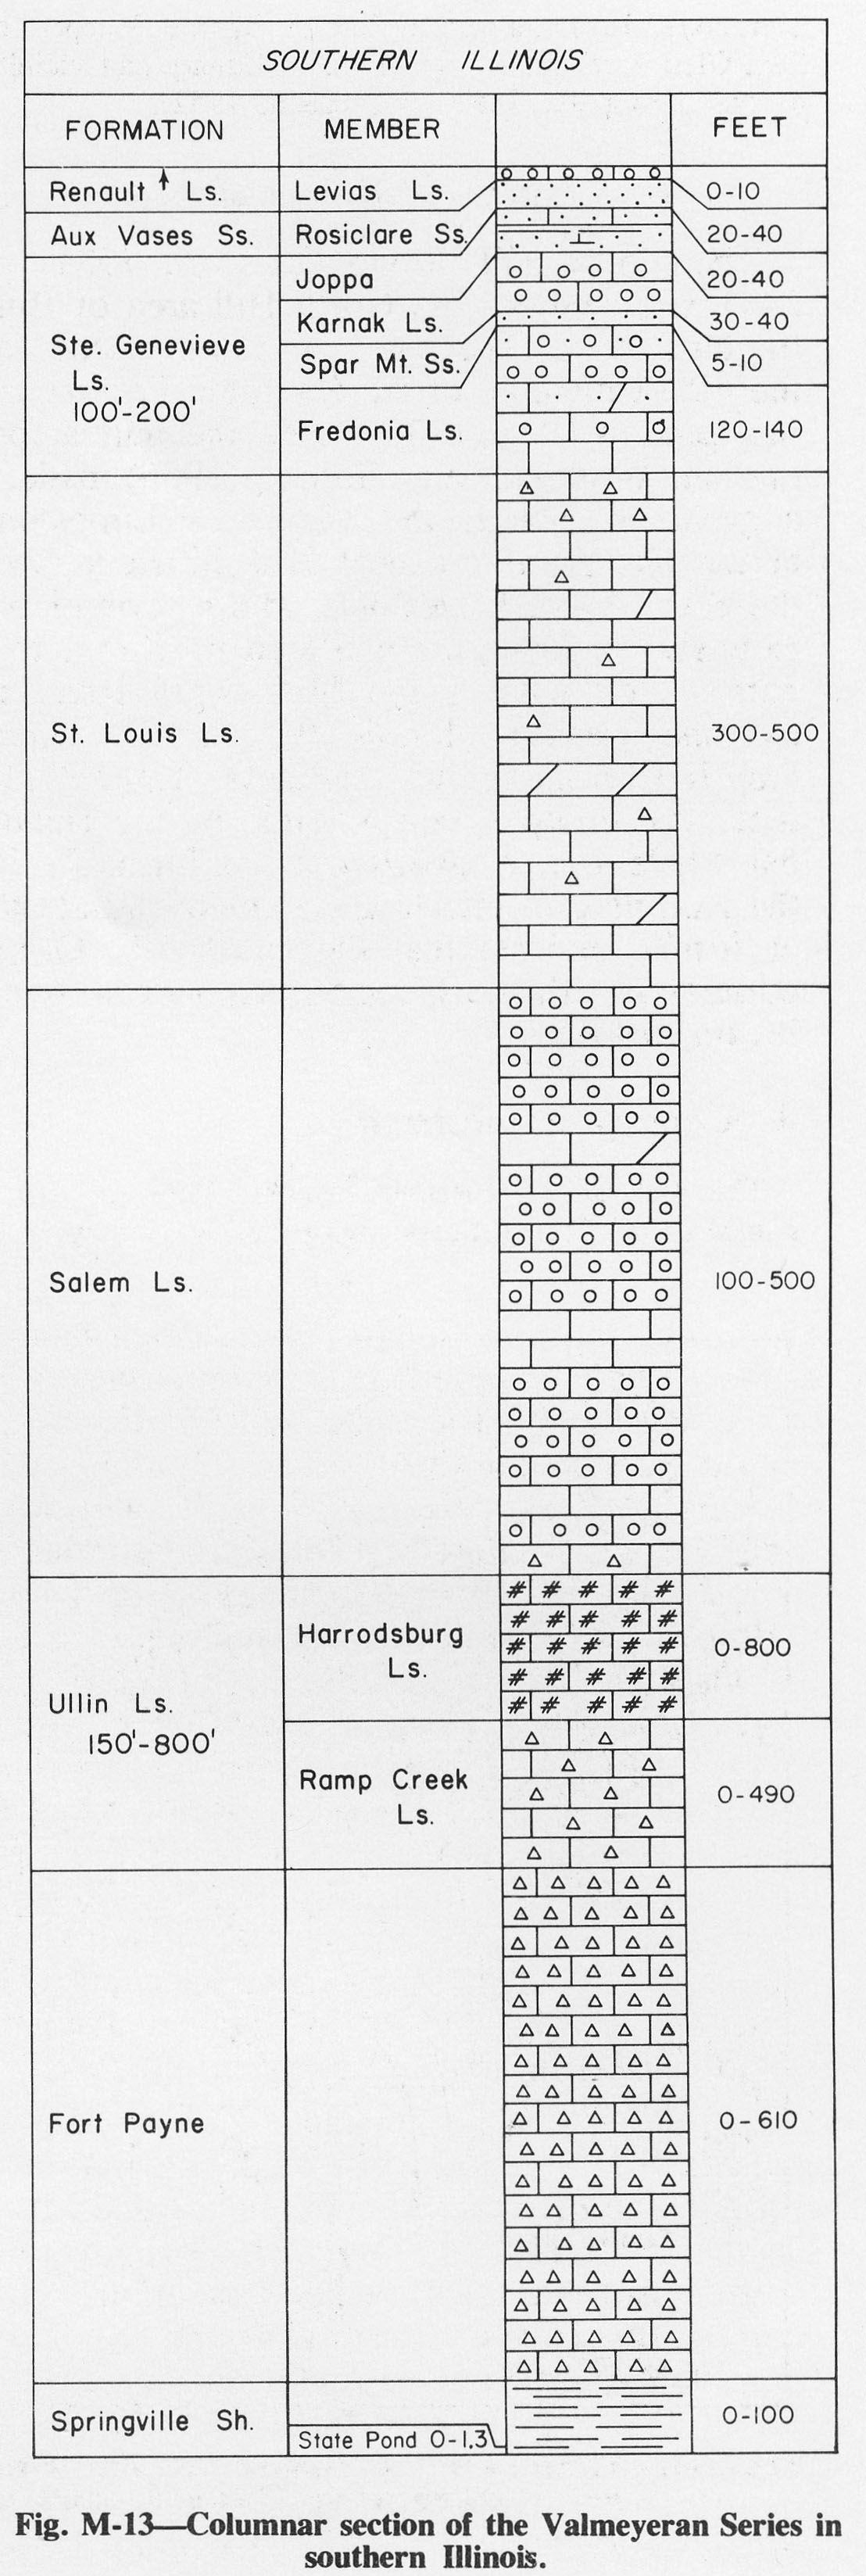
415 KB | Alan.Myers | Fig. M-13 -- Columnar section of the Valmeyeran Series in southern Illinois. | 1 |
| 16:17, 19 April 2016 | 104-Figure 6.jpg (file) |  |
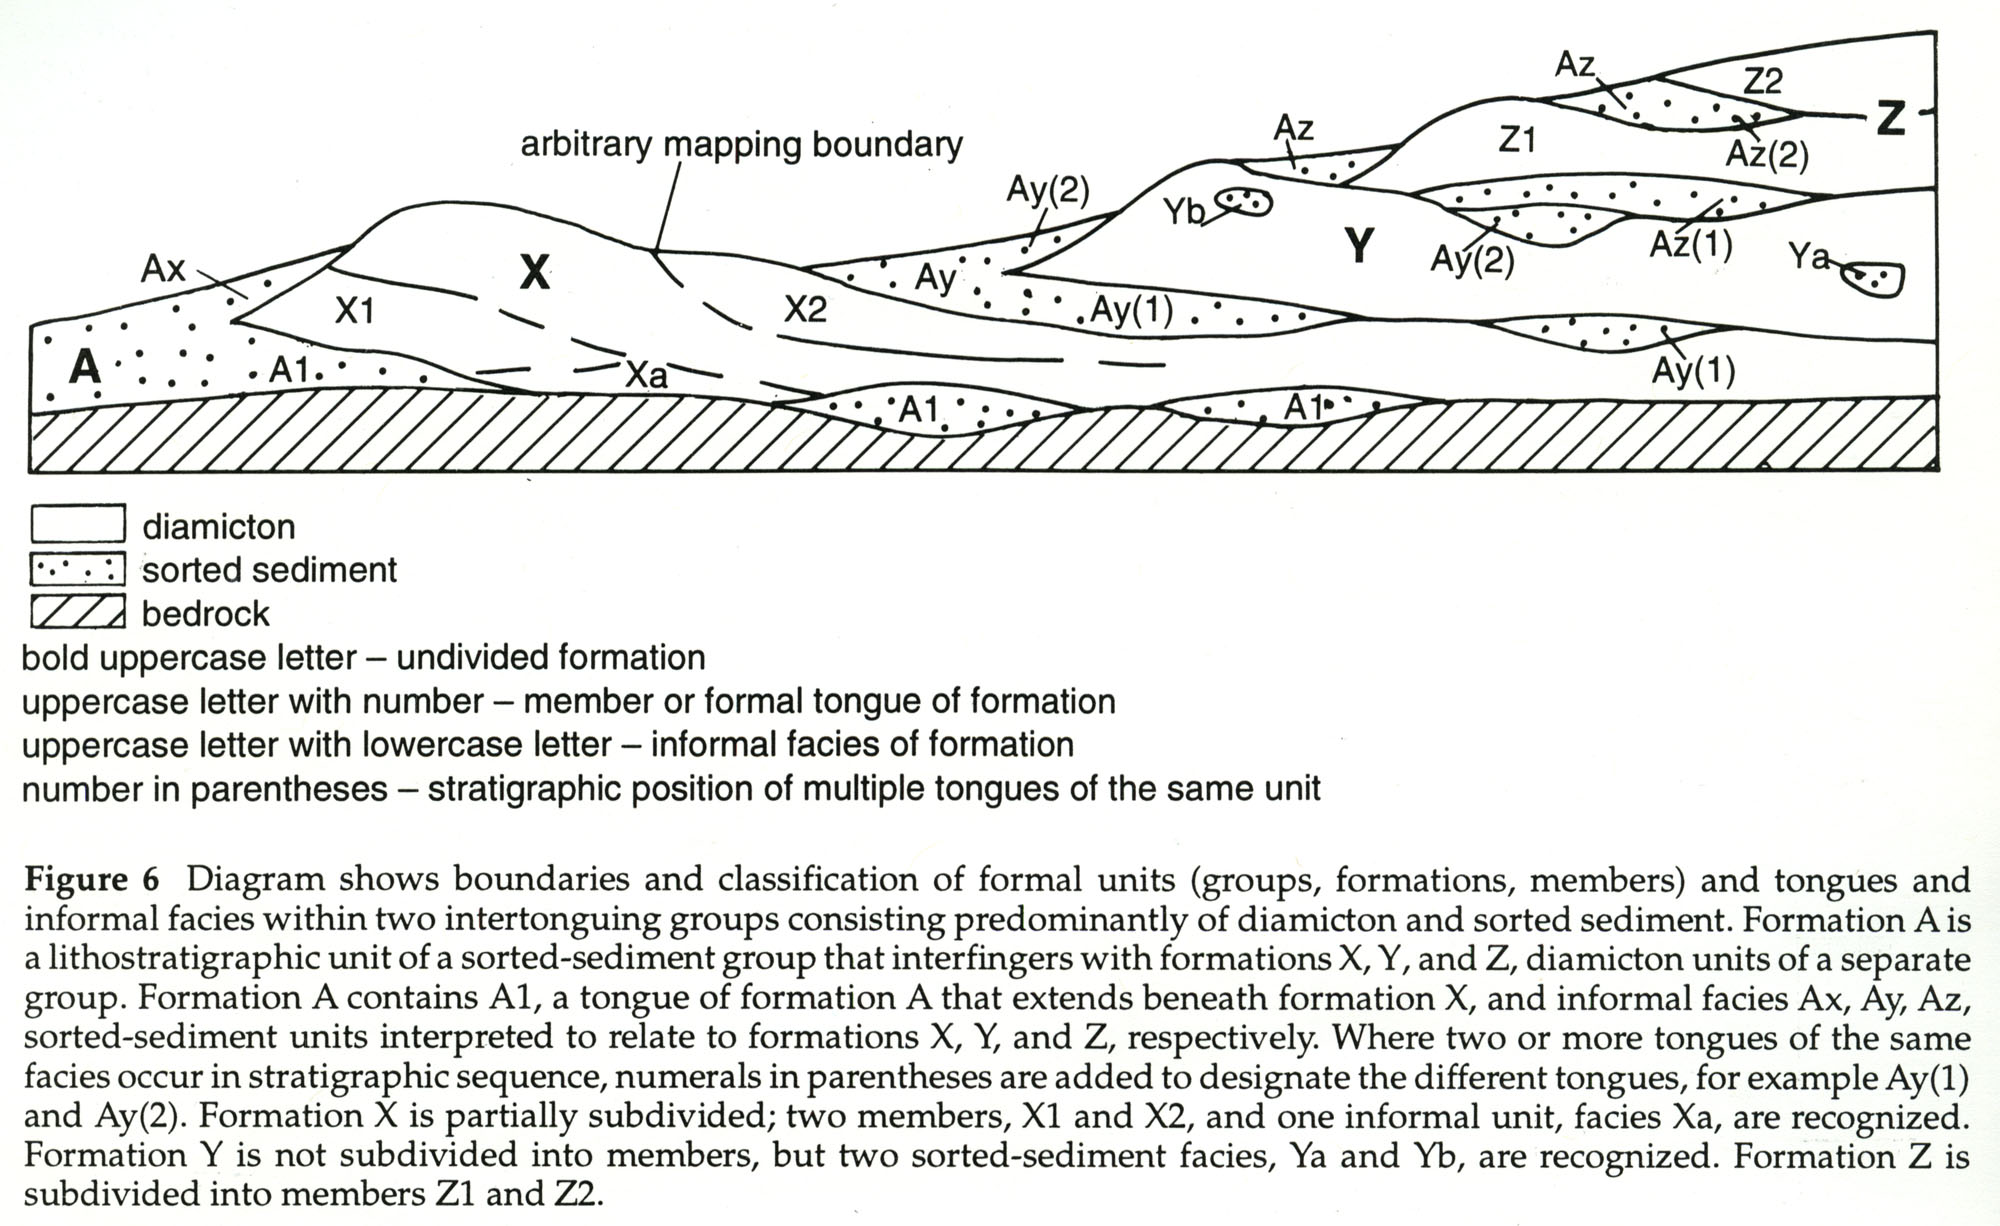
418 KB | Illex-gron | Figure 6 -- Diagram shows boundaries and classification of formal units (groups, formations, members) and tongues and informal facies within two intertonguing groups consisting predominantly of diamicton and sorted sediment. Formation A is a lithostrat... | 1 |
| 17:39, 11 July 2020 | C605-Figure-49.jpg (file) |  |
428 KB | Alan.Myers | 1 | |
| 20:05, 1 April 2016 | Figure D-11.jpg (file) |  |
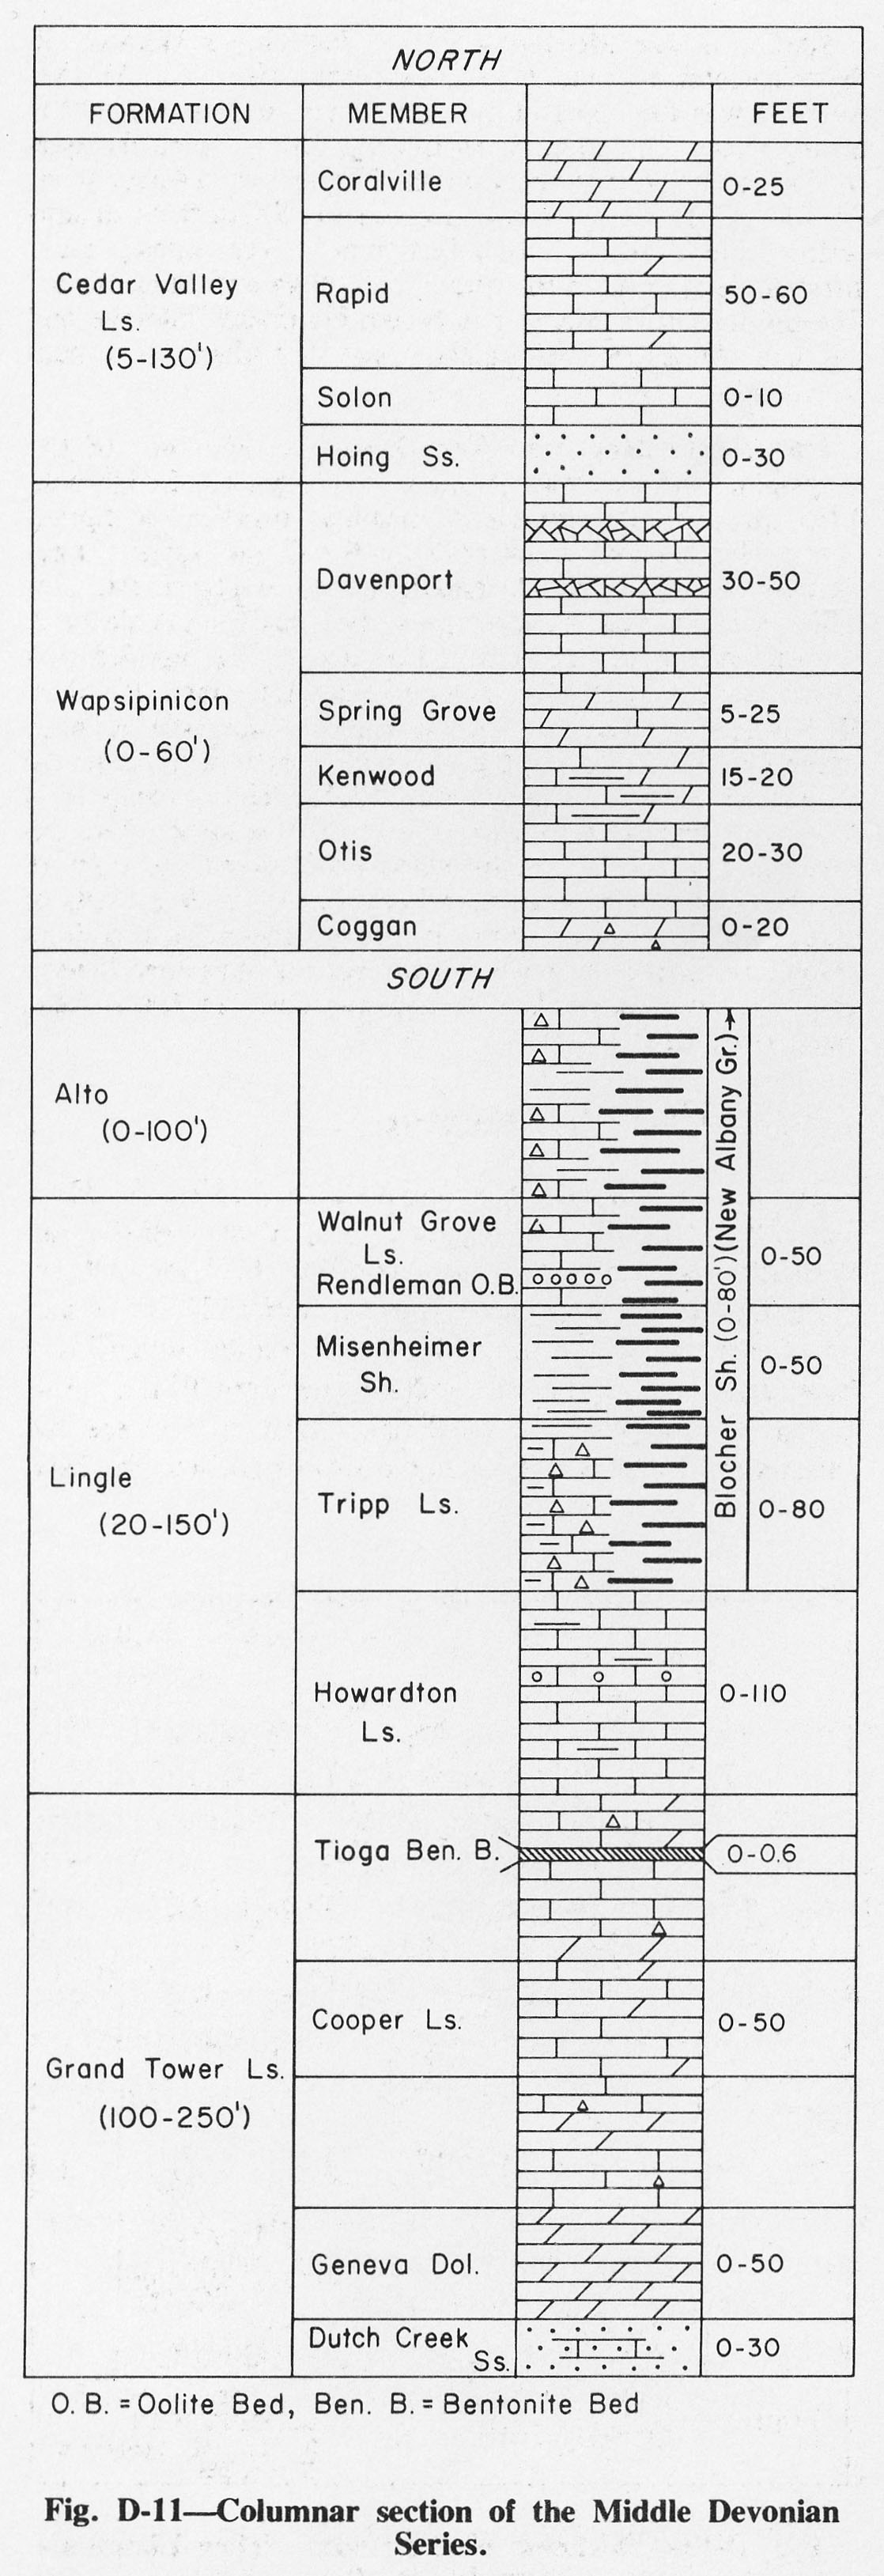
428 KB | Alan.Myers | Fig. D-11 -- Columnar section of the Middle Devonian Series. | 1 |
| 21:20, 17 July 2020 | C605-Figure-02.jpg (file) |  |
429 KB | Alan.Myers | 2 | |
| 16:44, 18 April 2016 | 94-fig 13.jpg (file) |  |
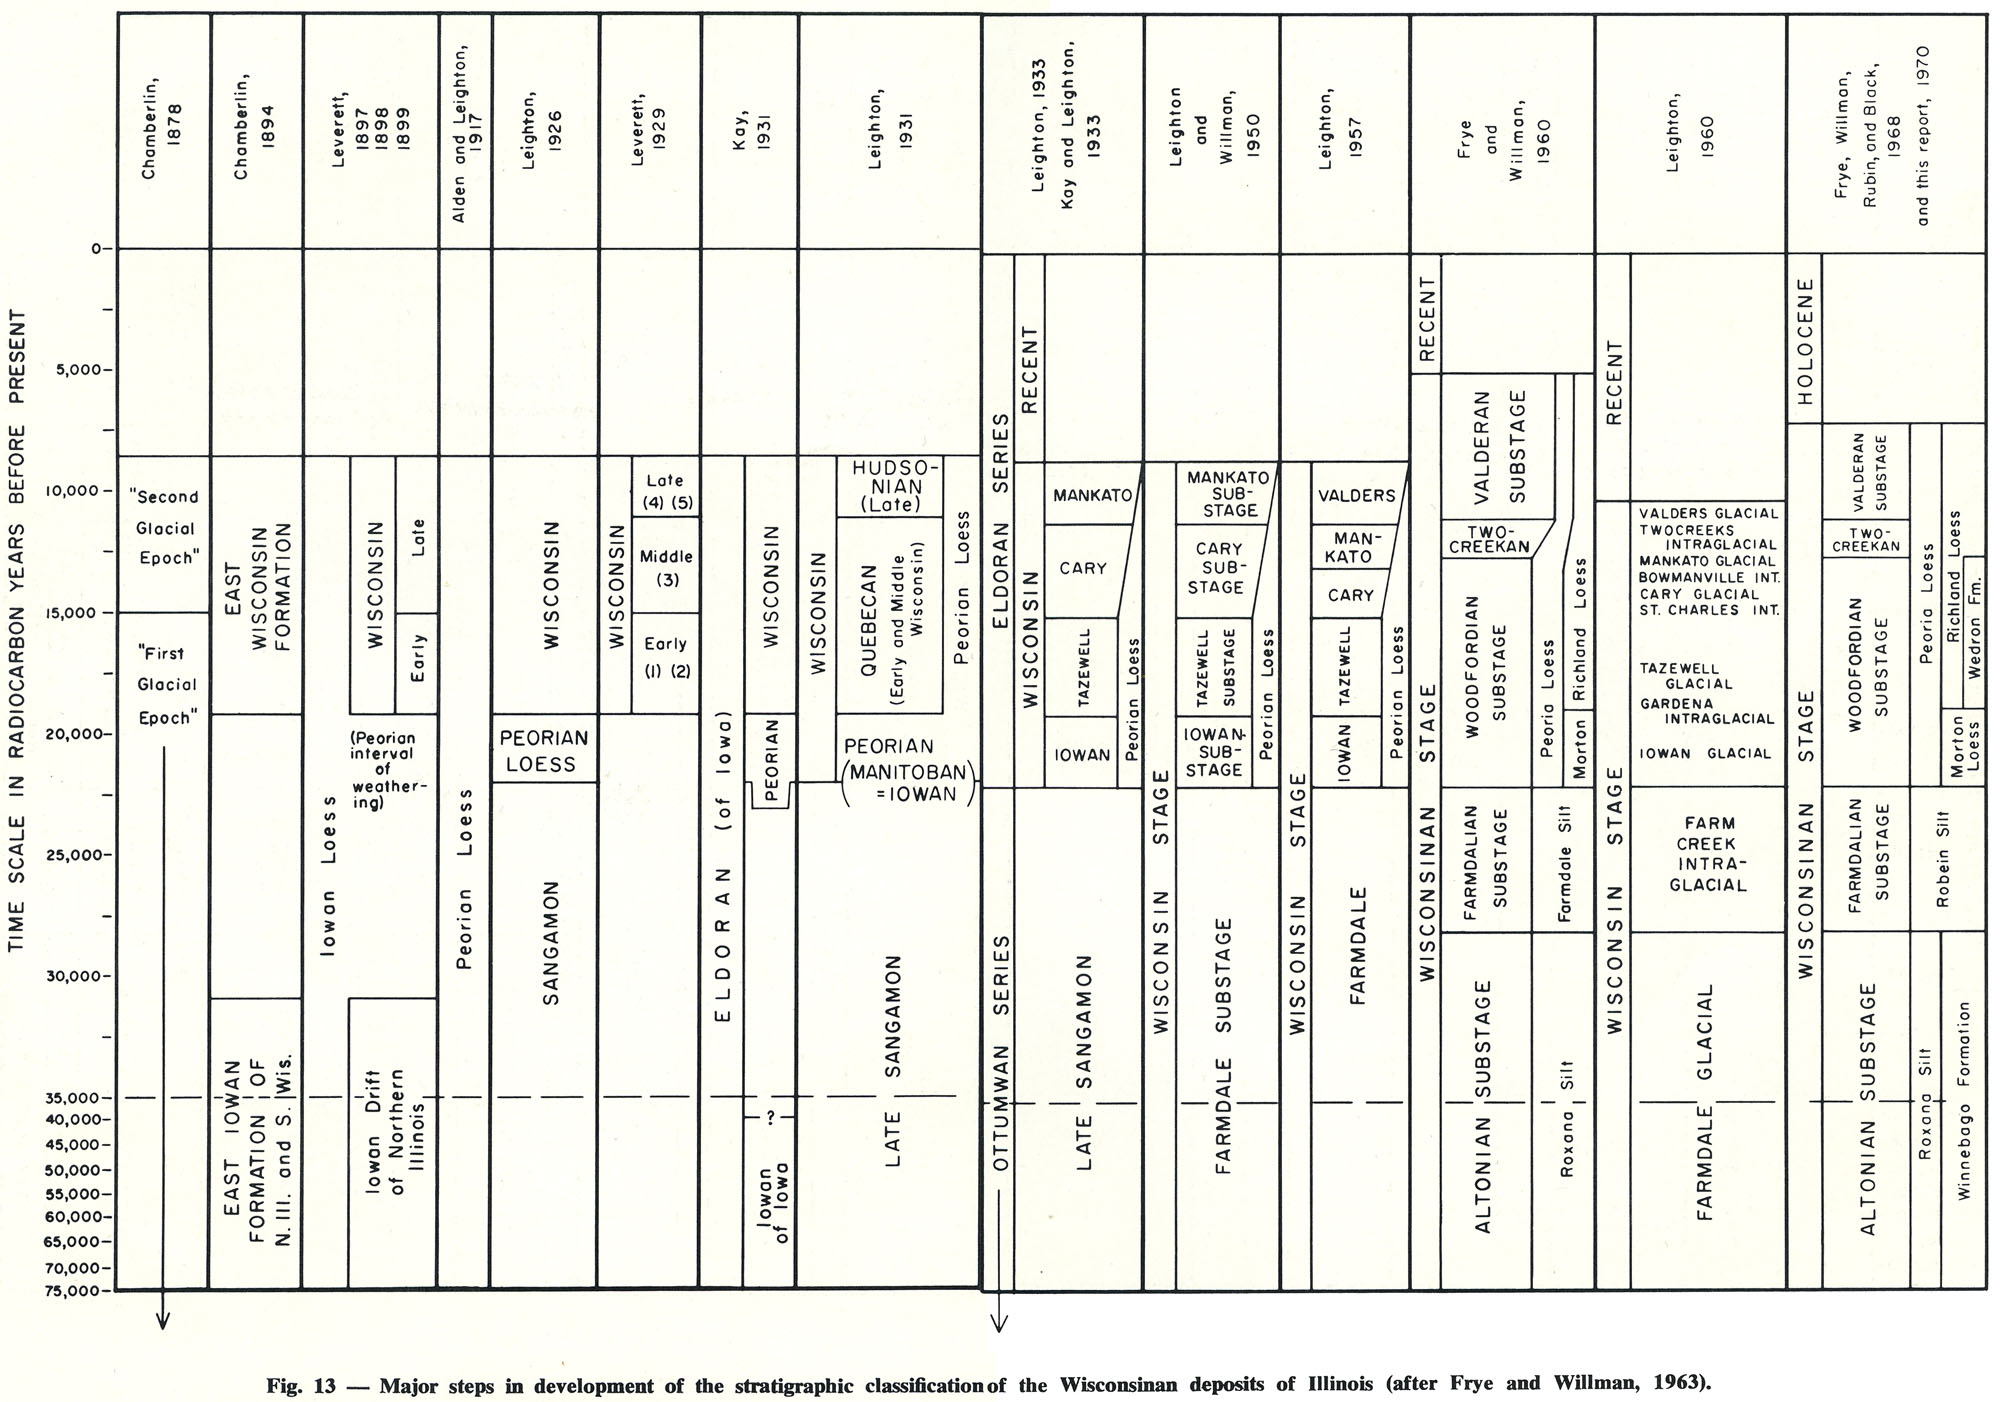
431 KB | Illex-gron | Fig. 13 -- Major steps in development of the stratigraphic classification of the Wisconsinan deposits of Illinois (after Frye and Willman, 1963). | 1 |
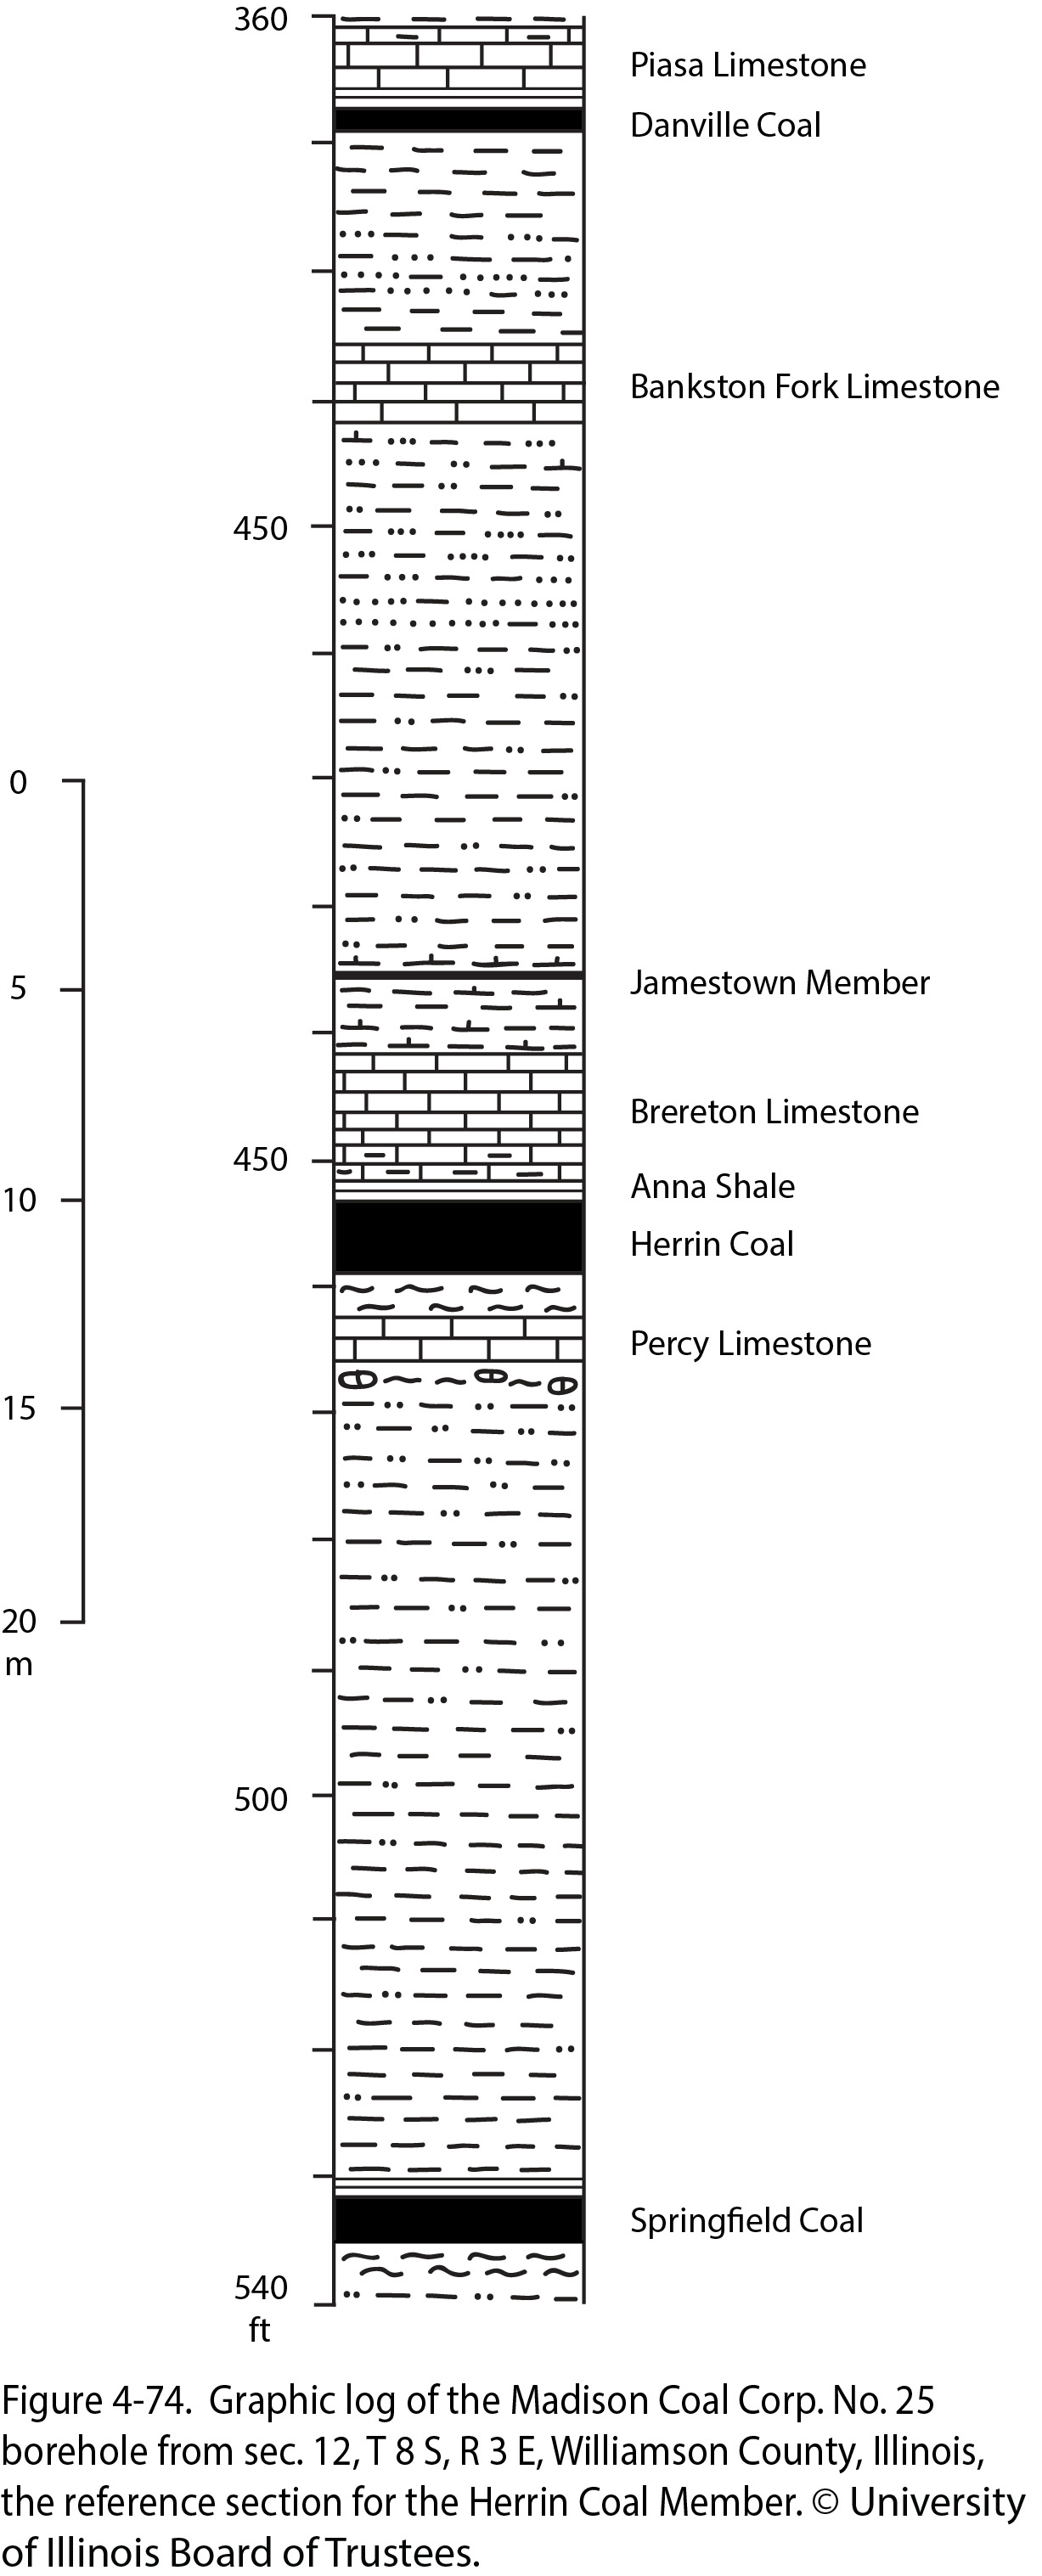
| 21:22, 4 January 2021 | Penn carbondale 4-74.jpg (file) |  |
433 KB | Jennifer.Obrad | 1 | |
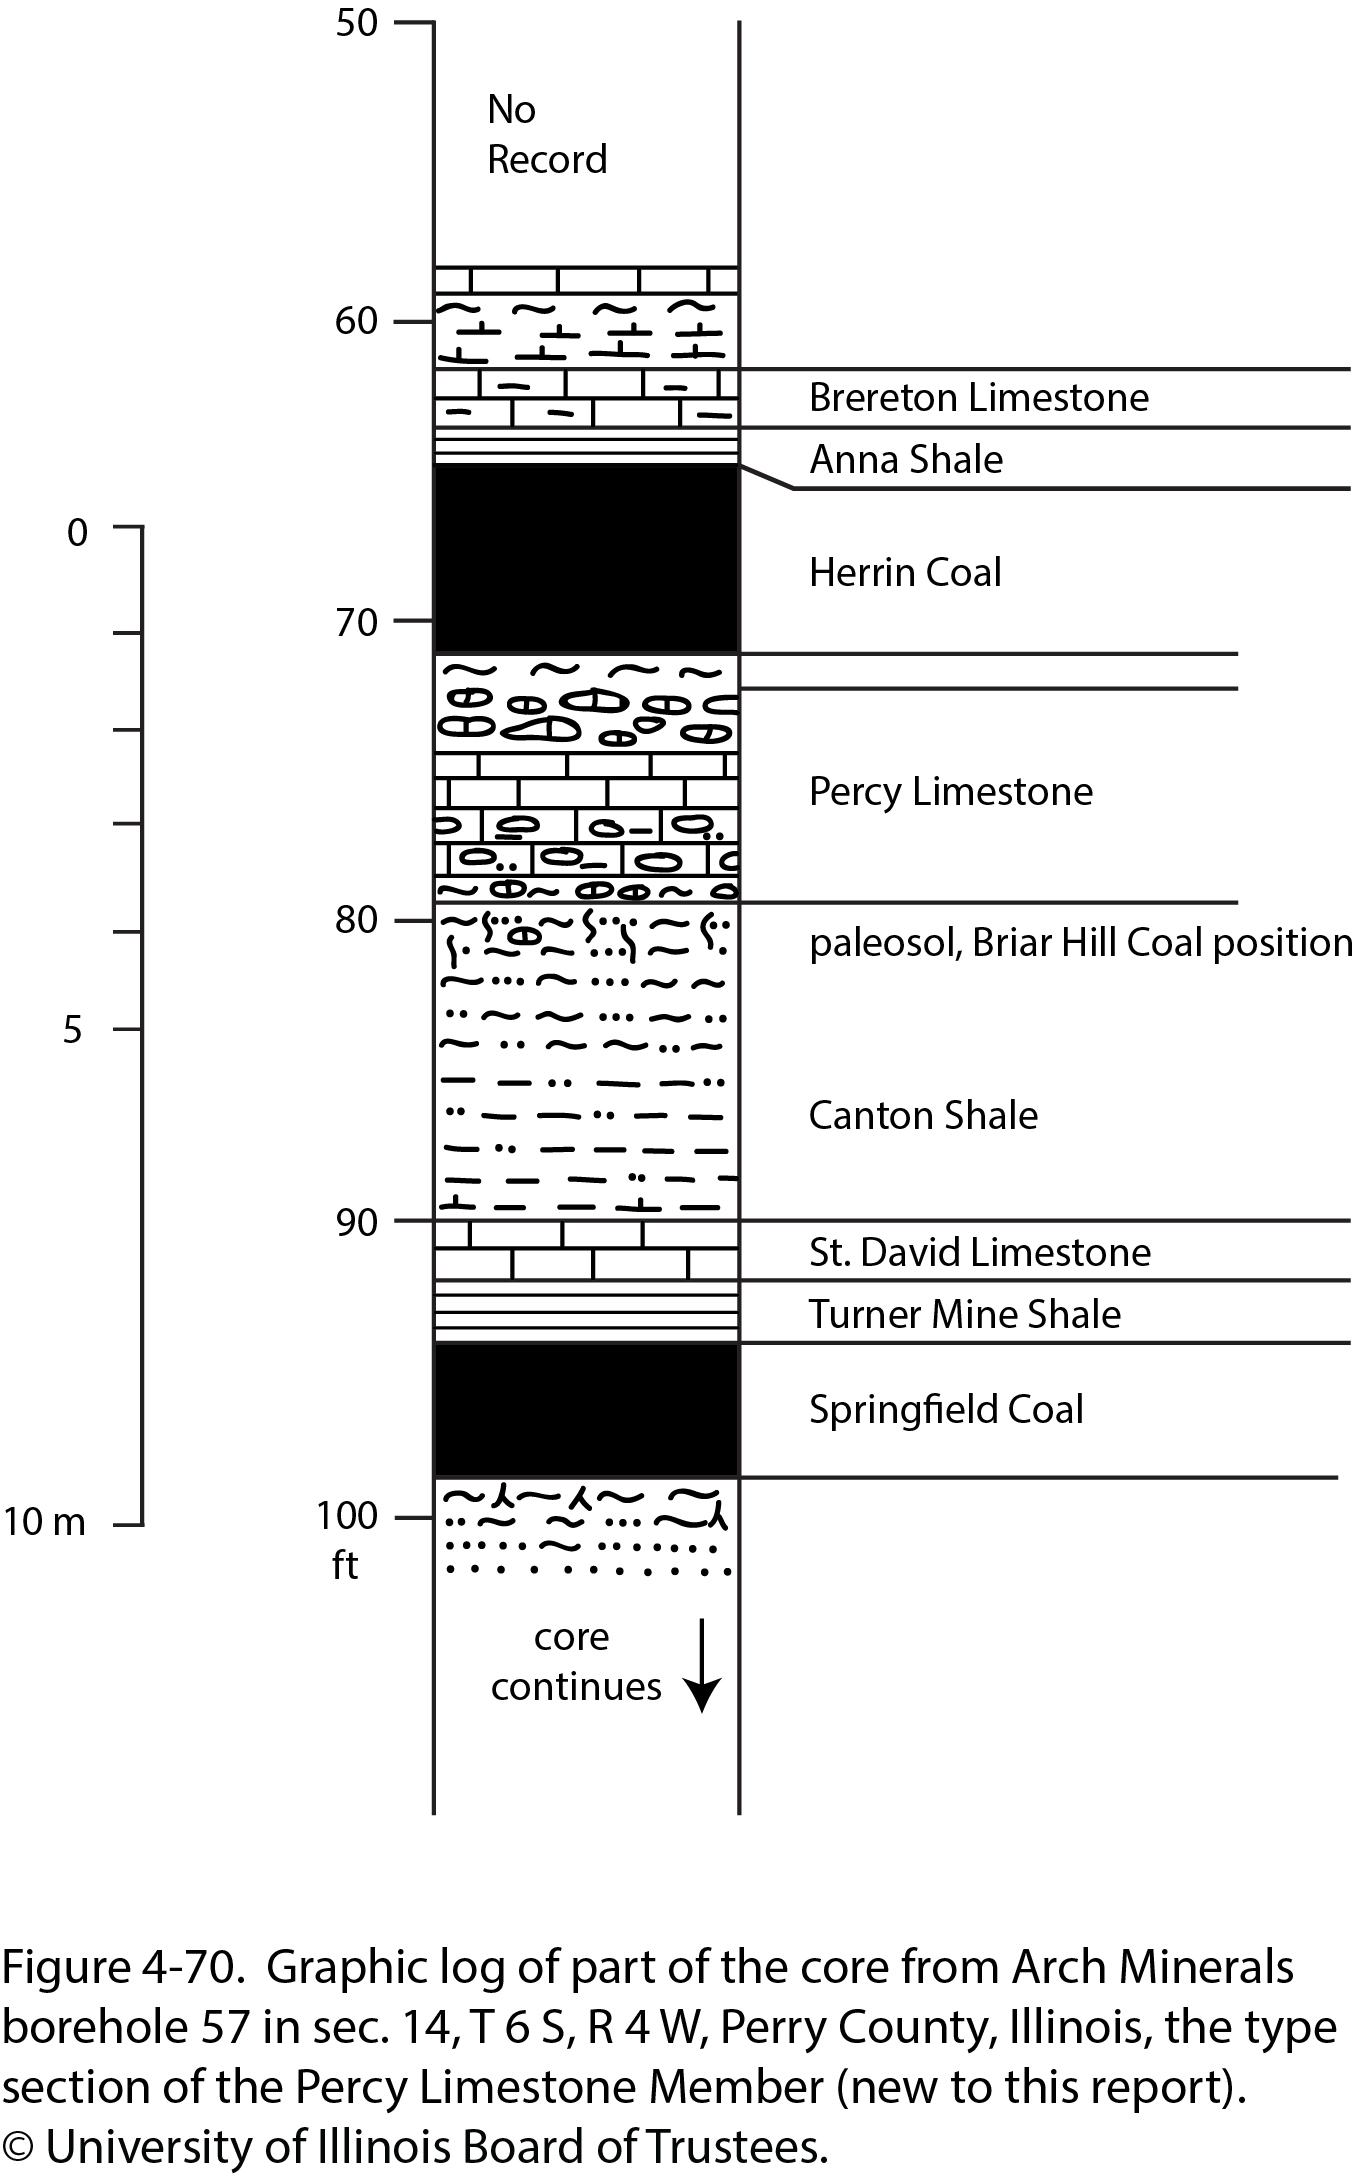
| 22:10, 23 December 2020 | Penn carbondale 4-70.jpg (file) |  |
437 KB | Jennifer.Obrad | 1 | |
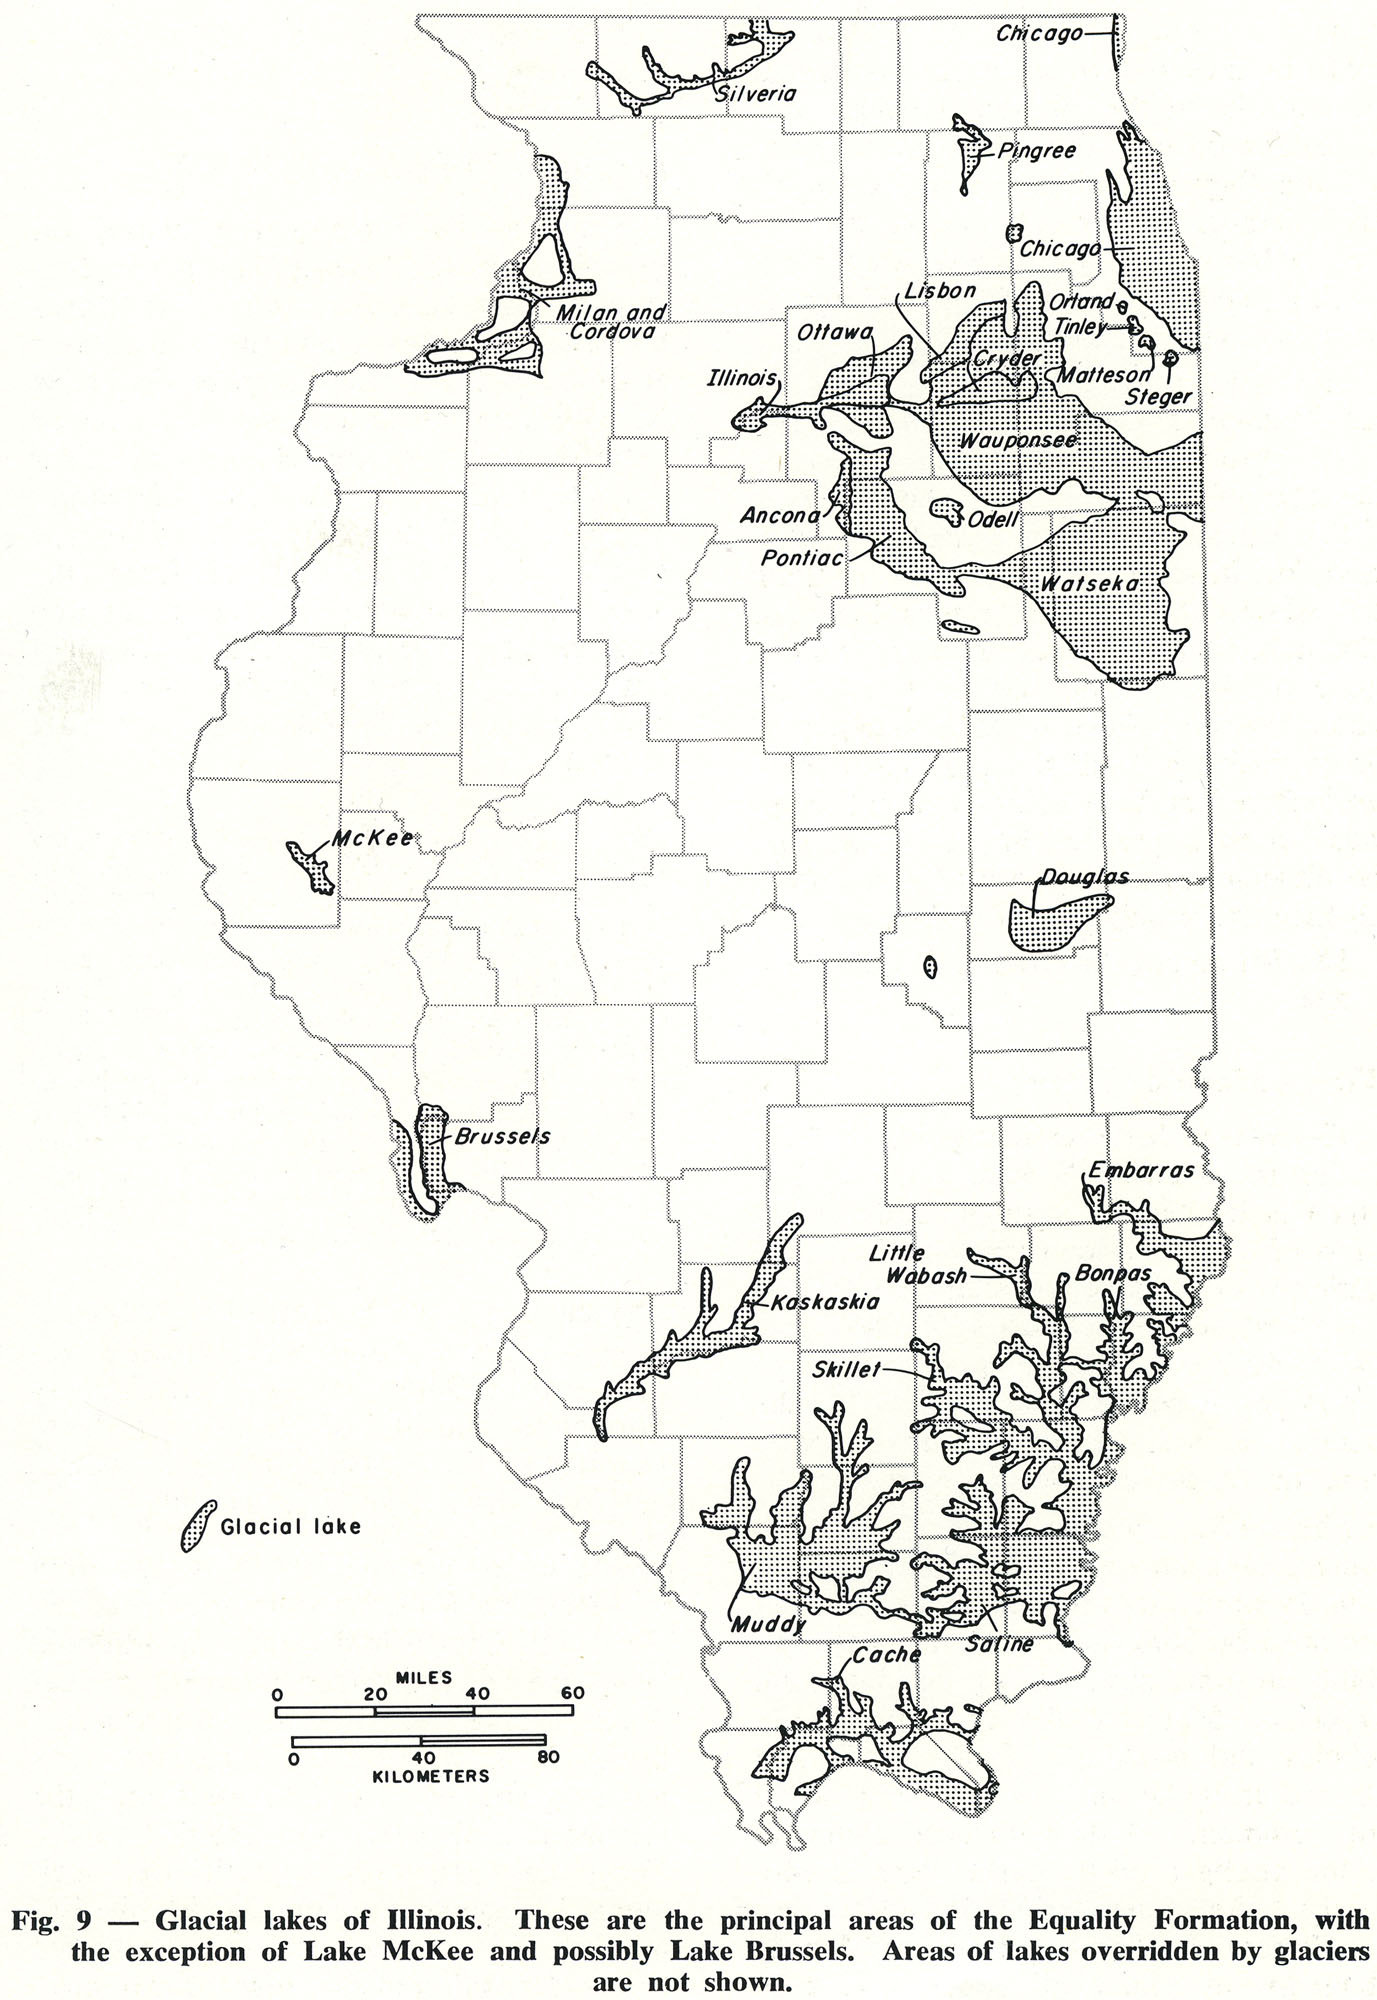
| 16:38, 18 April 2016 | 94-fig 9.jpg (file) |  |
438 KB | Illex-gron | Fig. 9 -- Glacial lakes of Illinois. These are the principal areas of the Equality Formation, with the exception of Lake McKee and possibly Lake Brussels. Areas of lakes overridden by glaciers are not shown. | 1 |
| 15:38, 11 July 2020 | C605-Figure-45.jpg (file) |  |
438 KB | Alan.Myers | 1 | |
| 15:19, 9 July 2020 | C605-Figure-22.jpg (file) |  |
440 KB | Alan.Myers | 1 | |
| 14:10, 9 July 2020 | C605-Figure-06.jpg (file) |  |
441 KB | Alan.Myers | 1 | |
| 16:31, 31 March 2016 | Figure O-2A.jpg (file) |  |
444 KB | Alan.Myers | Fig. O-2 A -- St. Peter Sandstone in Starved Rock along the Illinois River in Starved Rock State Park, 4 miles south-east of La Salle, La Salle County. | 1 |
| 15:46, 19 April 2016 | 104-Figure 1 1.jpg (file) |  |
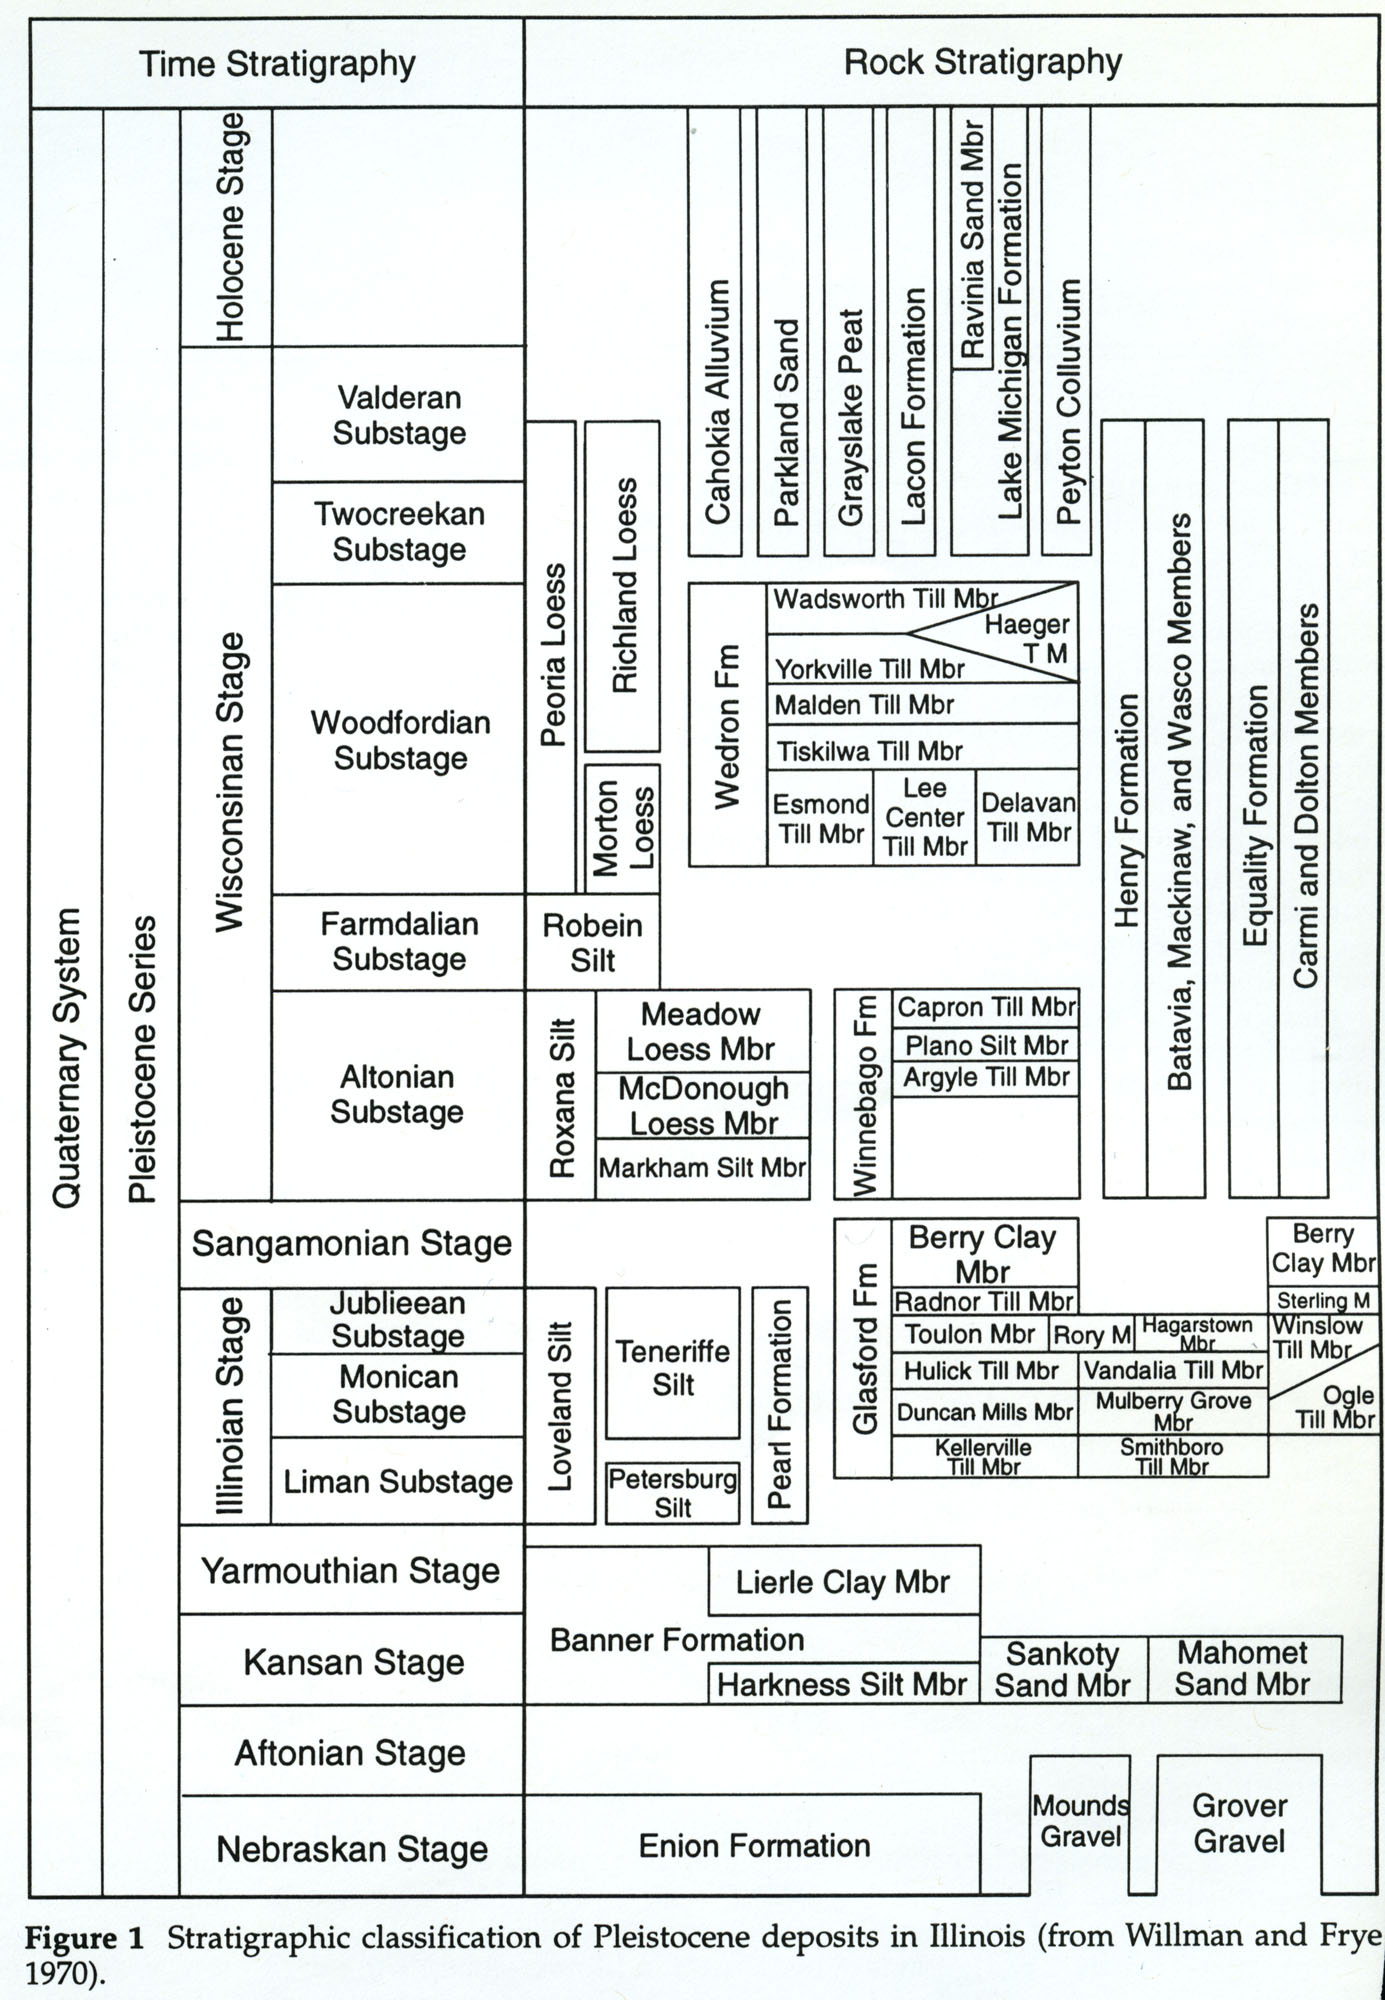
445 KB | Illex-gron | Figure 1 -- Stratigraphic classification of Pleistocene deposits in Illinois (from Willman and Frye 1970). | 1 |
| 17:13, 18 April 2016 | 94-tb 5-e.jpg (file) |  |
449 KB | Illex-gron | Table 5 -- Continued. | 1 |
| 16:59, 18 April 2016 | 94-tb 4.jpg (file) |  |
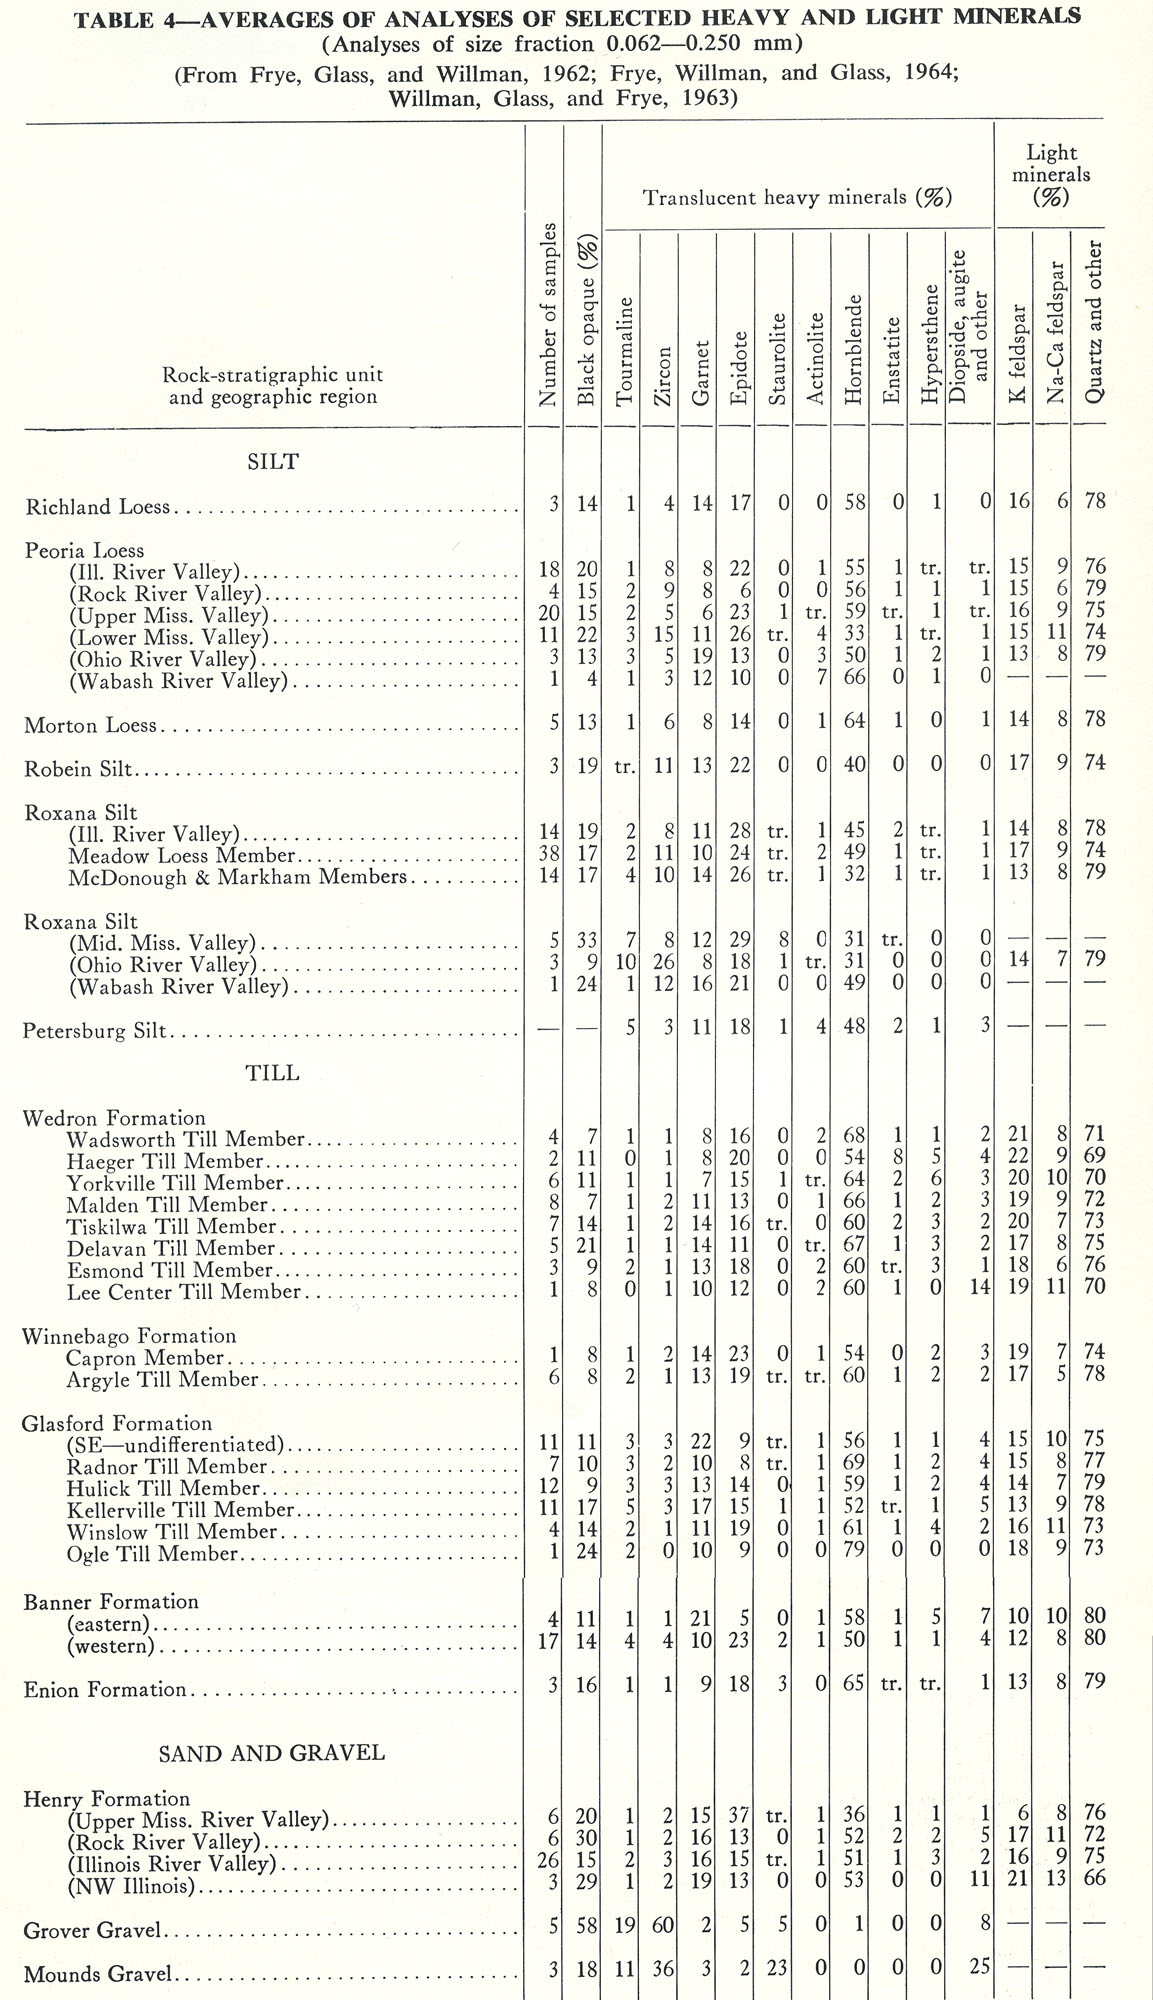
452 KB | Illex-gron | Table 4 -- Averages of Analyses of Selected Heavy and Light Minerals (Analyses of size fraction 0.062-0.250 mm). (From Frye, Glass, and Willman, 1962; Frye, Willman, and Glass, 1964; Willman, Glass, and Frye, 1963) | 1 |
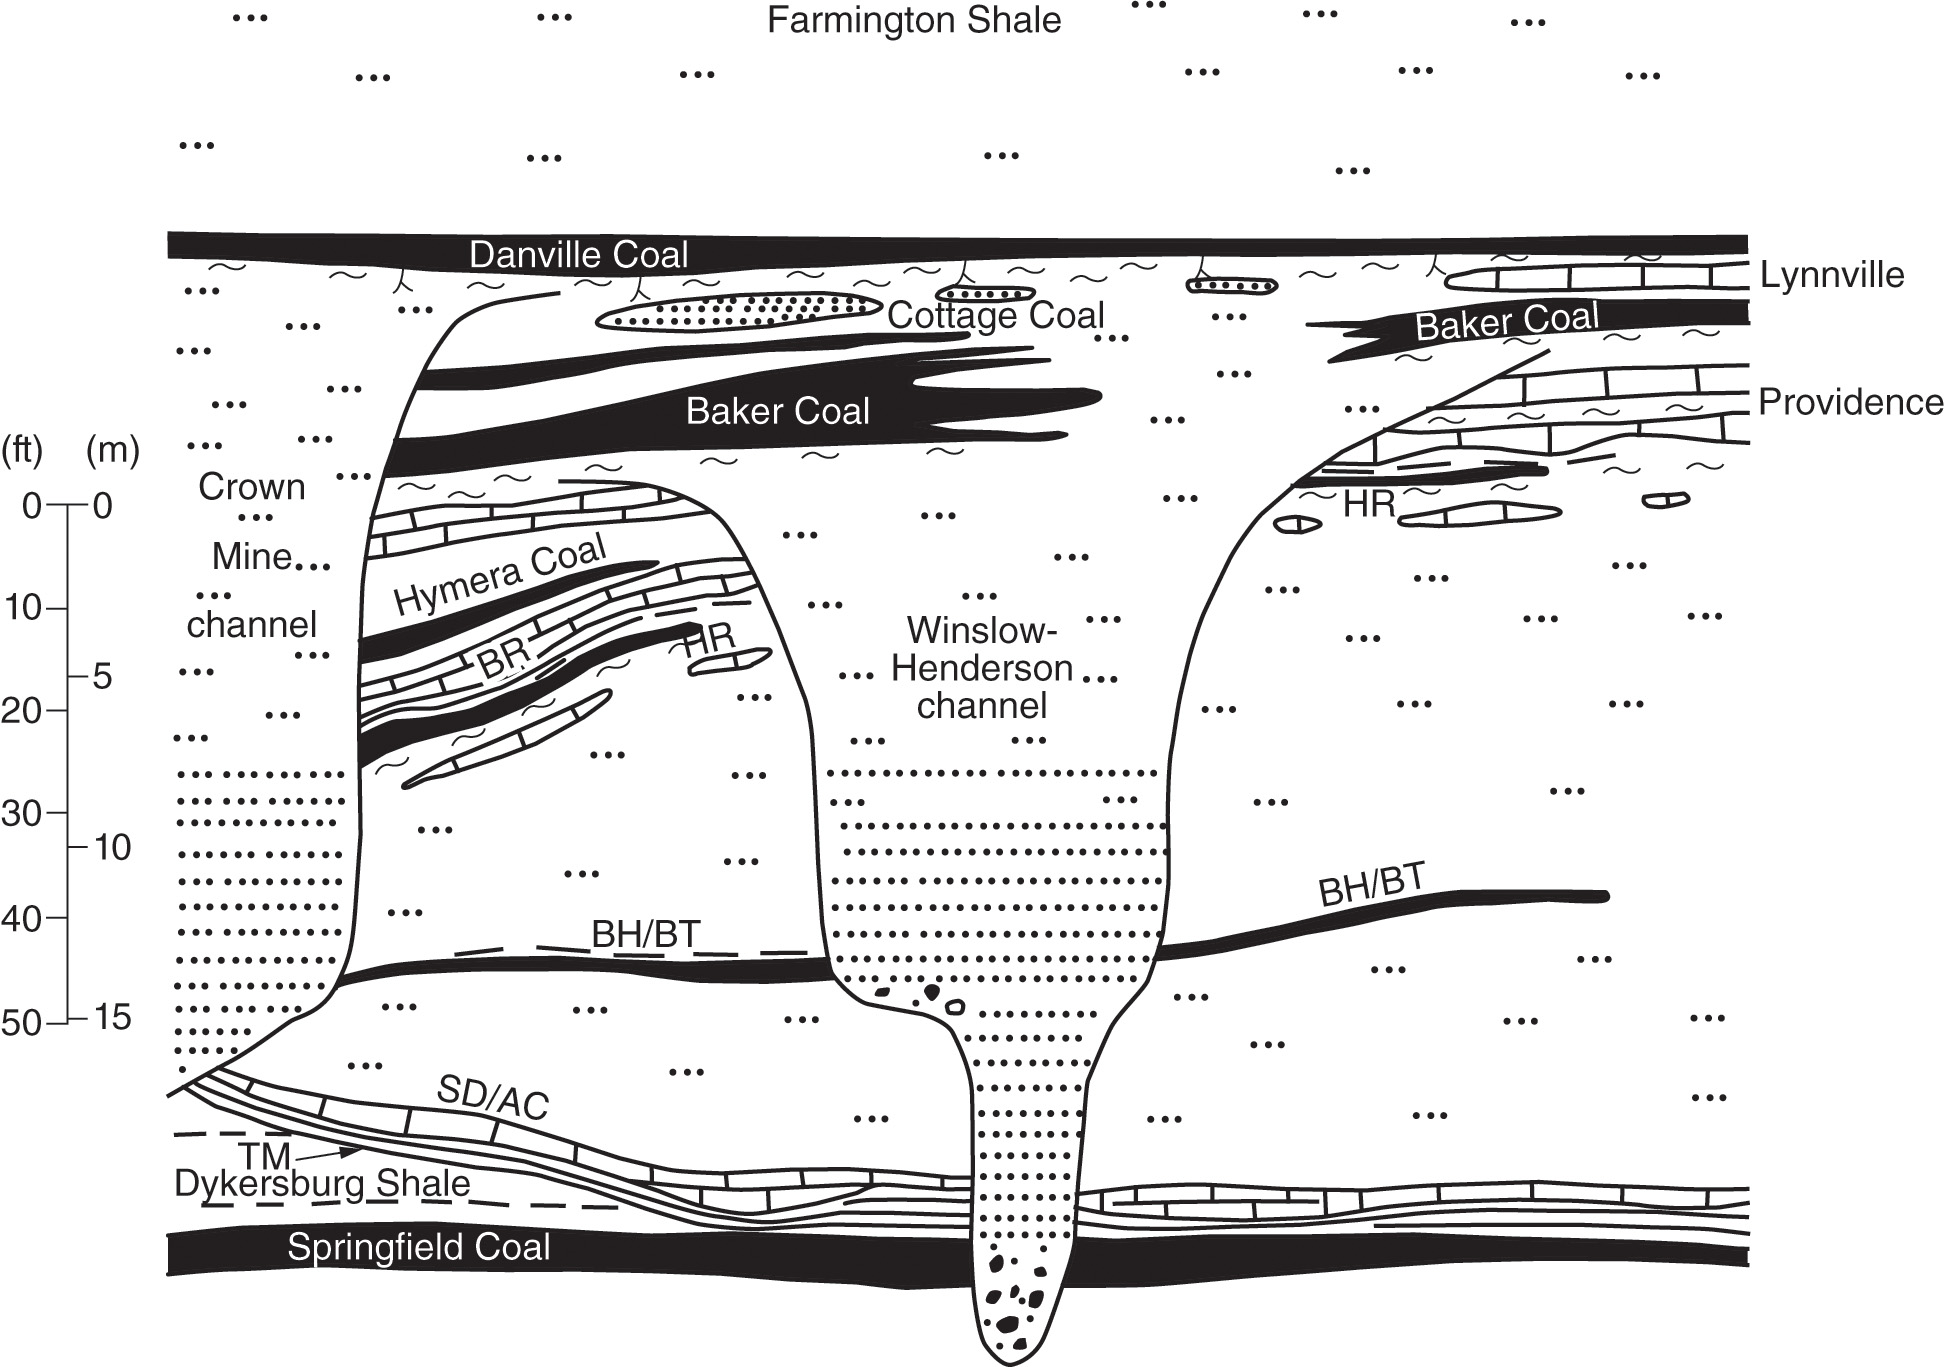
| 20:58, 26 January 2021 | Penn carbondale 4-7.jpg (file) |  |
456 KB | Jennifer.Obrad | 1 | |
| 15:41, 1 April 2016 | Figure P-15.jpg (file) |  |
457 KB | Illex-gron | Fig. P-15 -- Thickness of the Bond Formation (based on map by K. E. Clegg). | 1 |
| 15:52, 19 April 2016 | 104-Figure 3.jpg (file) |  |
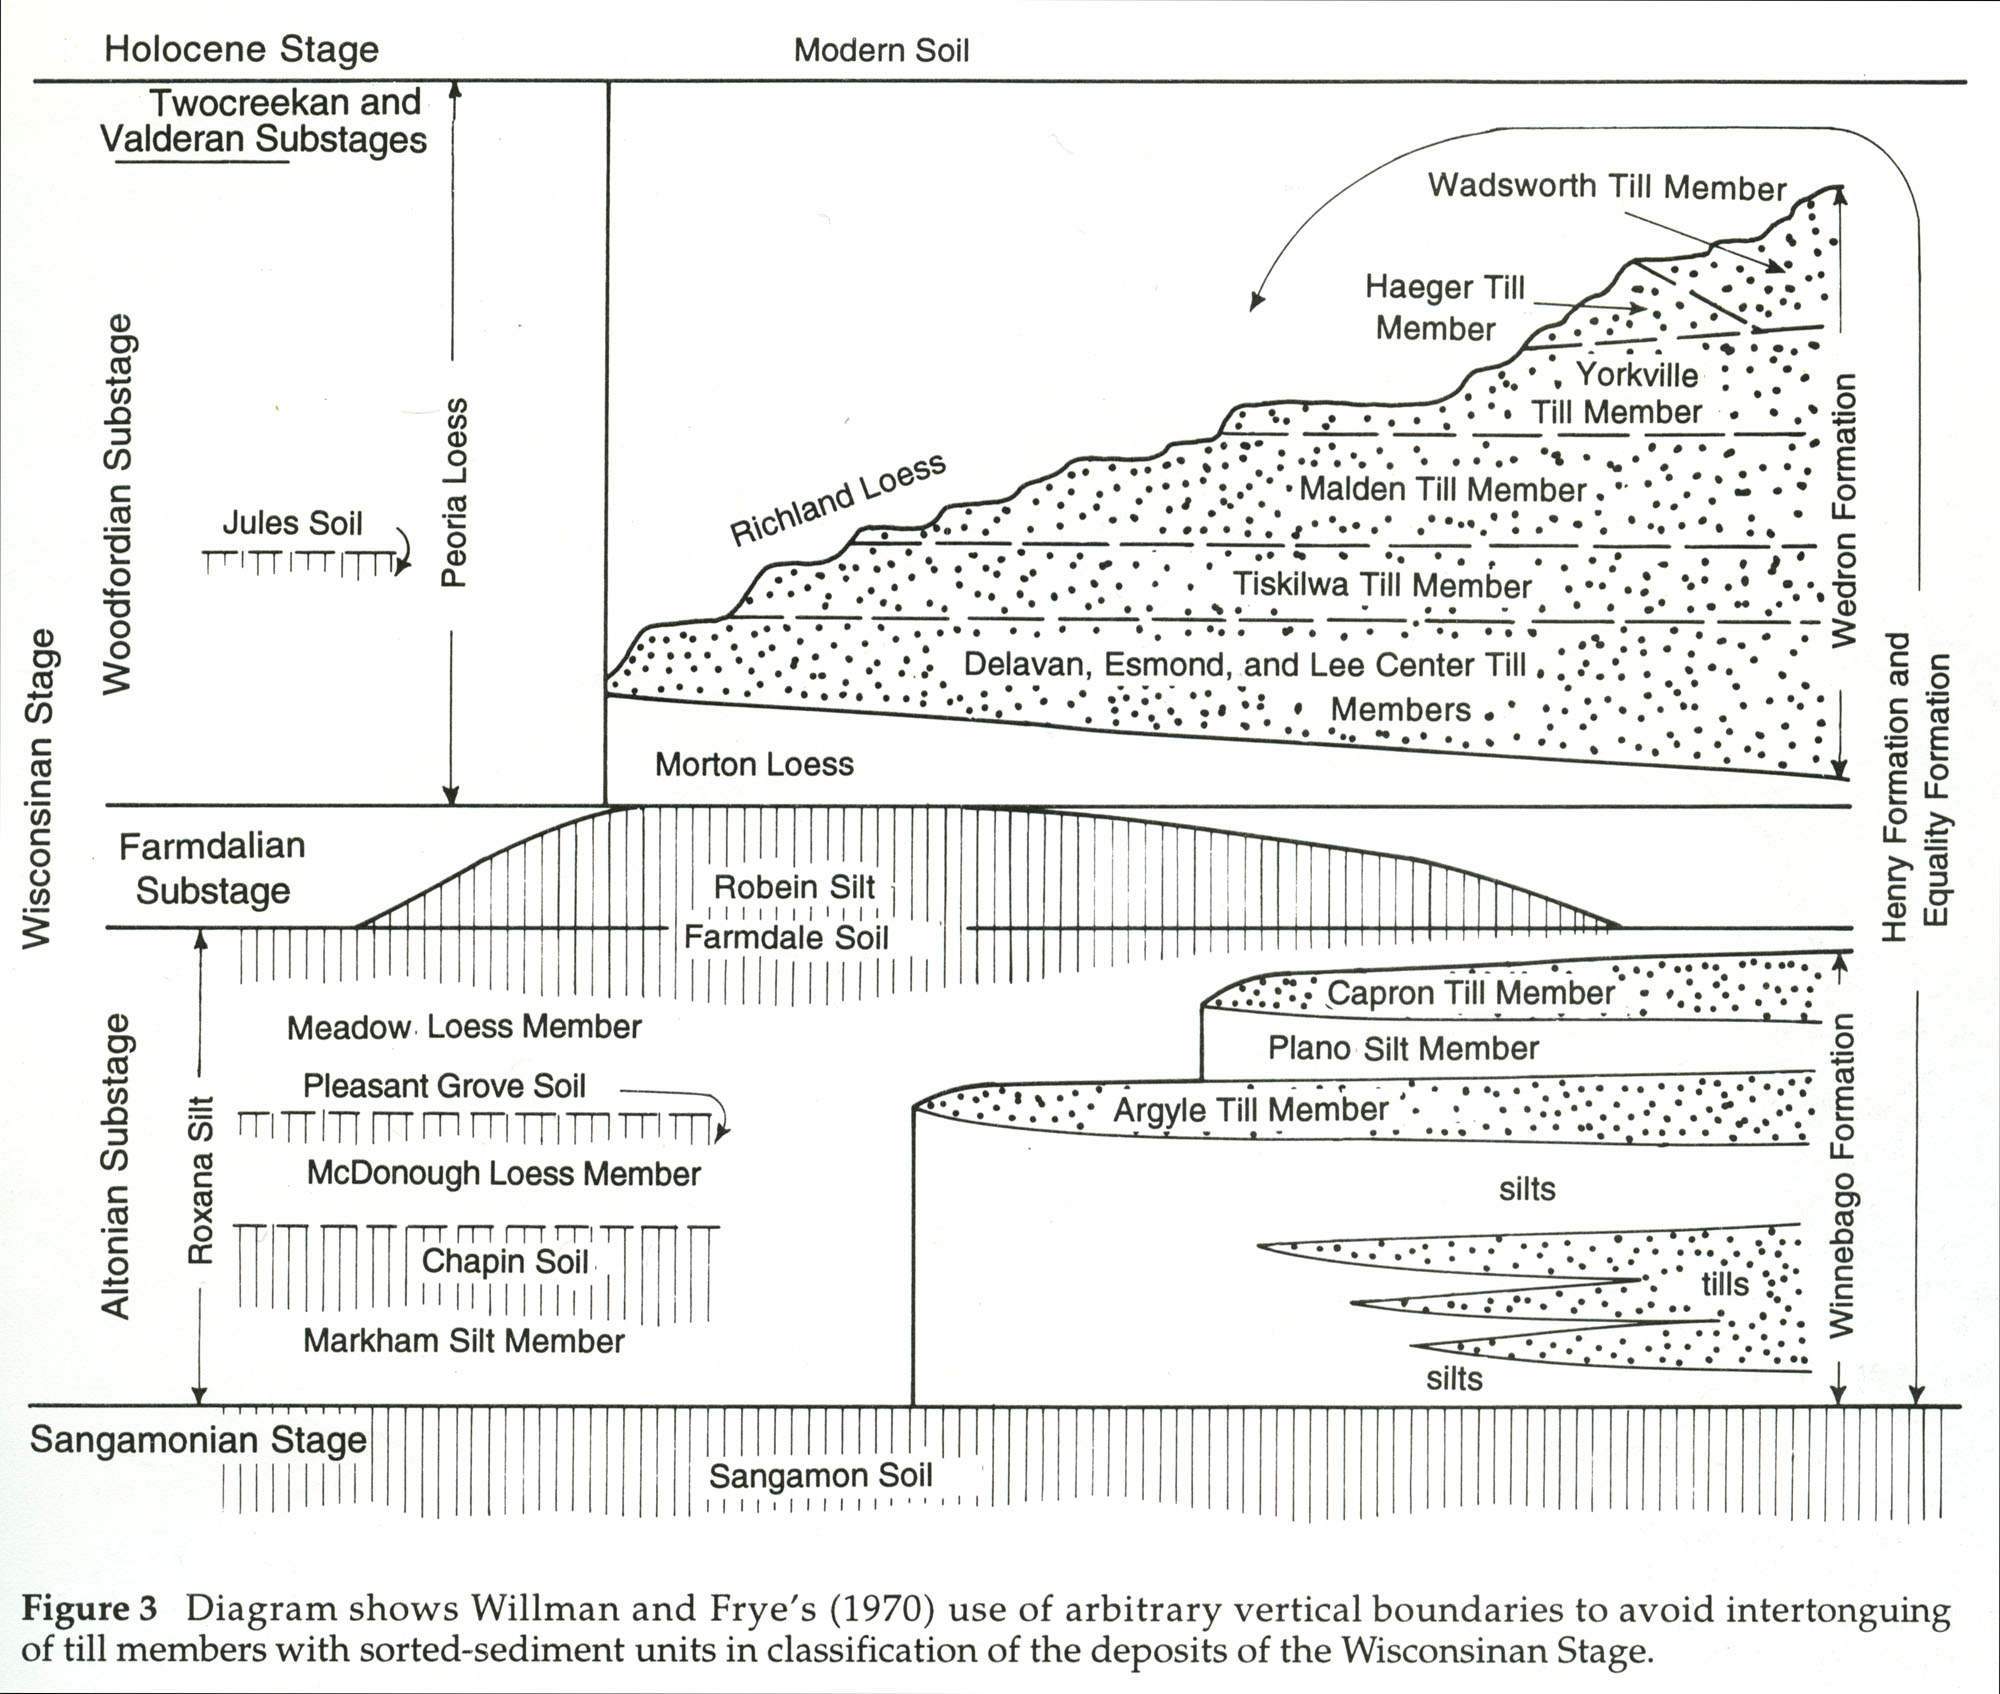
459 KB | Illex-gron | Figure 3 -- Diagram shows Willman and Frye's (1970) use of arbitrary vertical boundaries to avoid intertonguing of till members with sorted-sediment units in classification of the deposits of the Wisconsinan Stage. | 1 |
| 14:49, 9 July 2020 | C605-Figure-14.jpg (file) |  |
461 KB | Alan.Myers | 1 | |
| 20:11, 23 December 2020 | Penn carbondale 4-50.jpg (file) |  |
463 KB | Jennifer.Obrad | 1 | |
| 16:10, 19 April 2016 | 104-Figure 4b.jpg (file) |  |
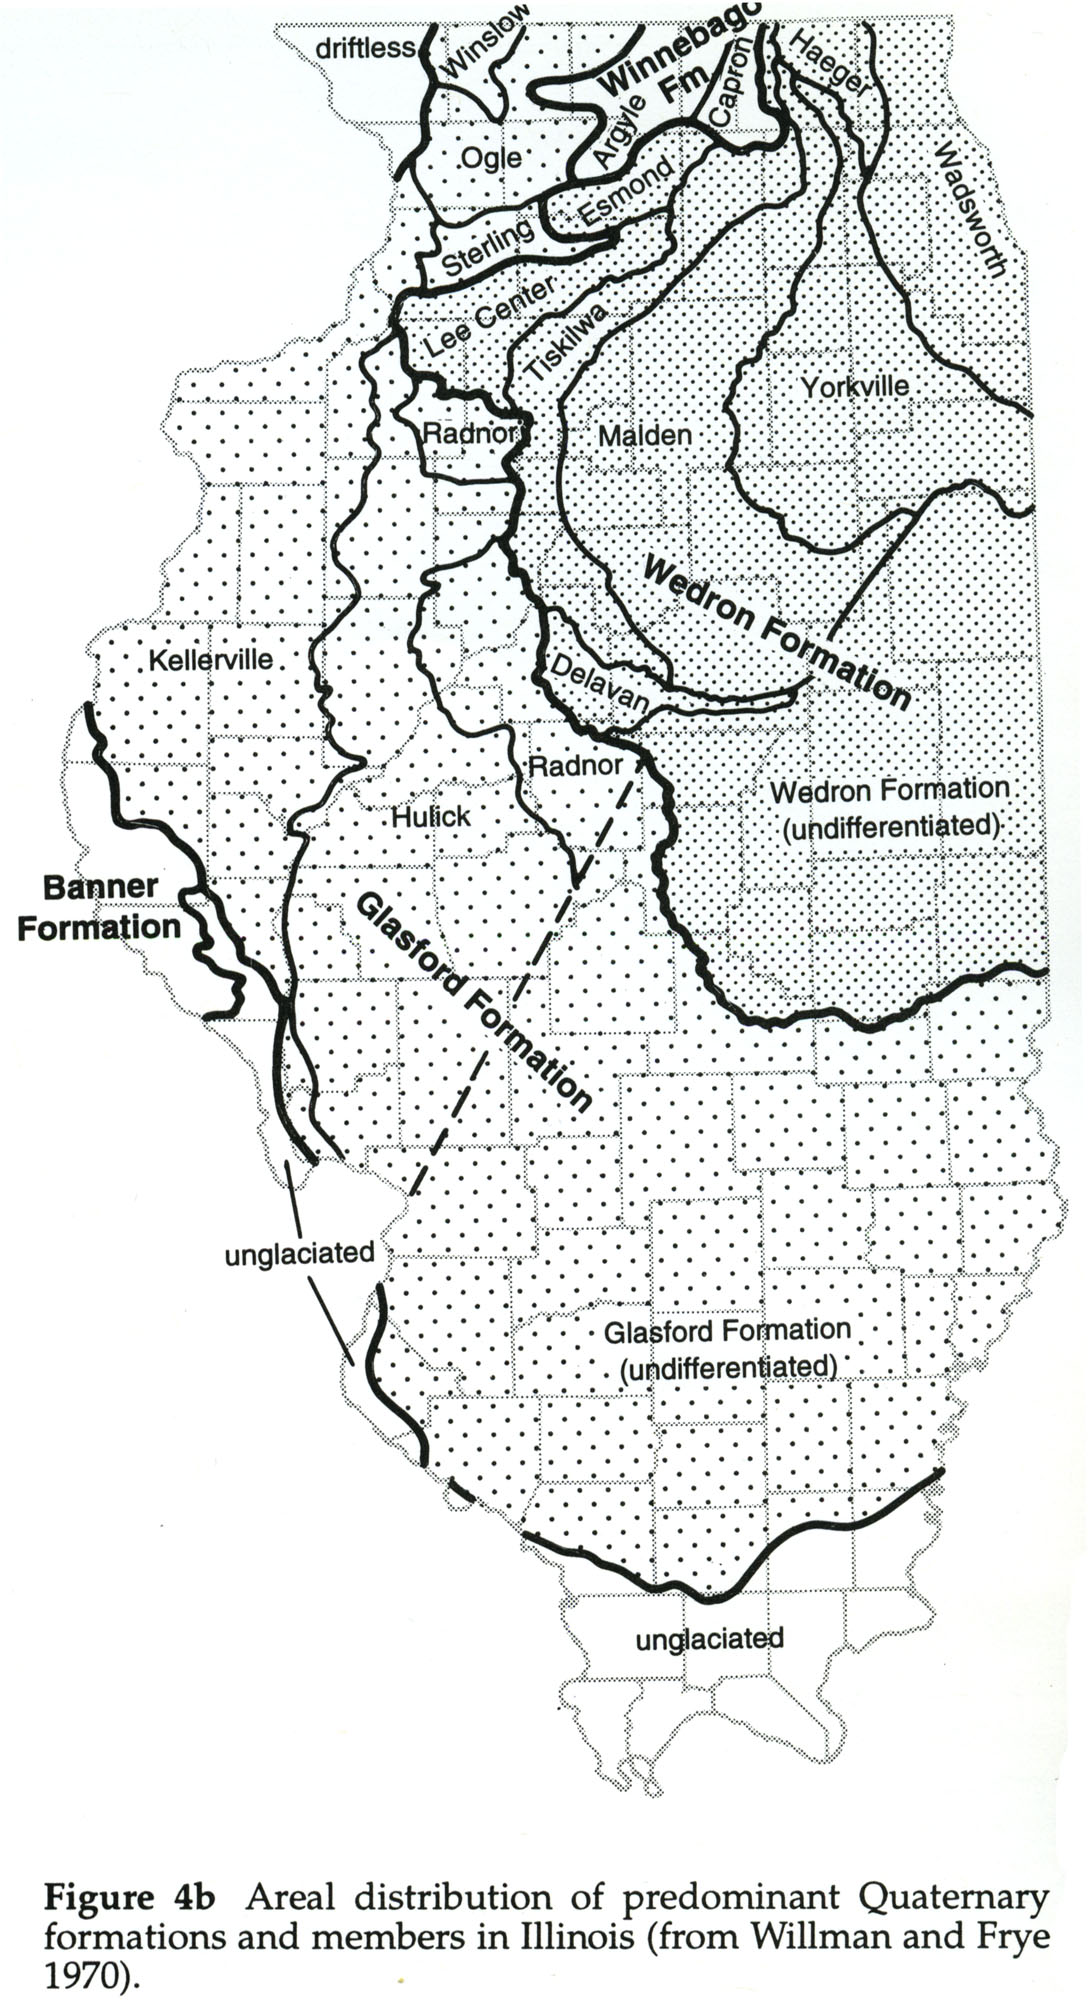
464 KB | Illex-gron | Figure 4b -- Areal distribution of predominant Quaternary formations and members in Illinois (from Willman and Frye 1970). | 1 |