File list
Jump to navigation
Jump to search
This special page shows all uploaded files.
| Date | Name | Thumbnail | Size | User | Description | Versions |
|---|---|---|---|---|---|---|
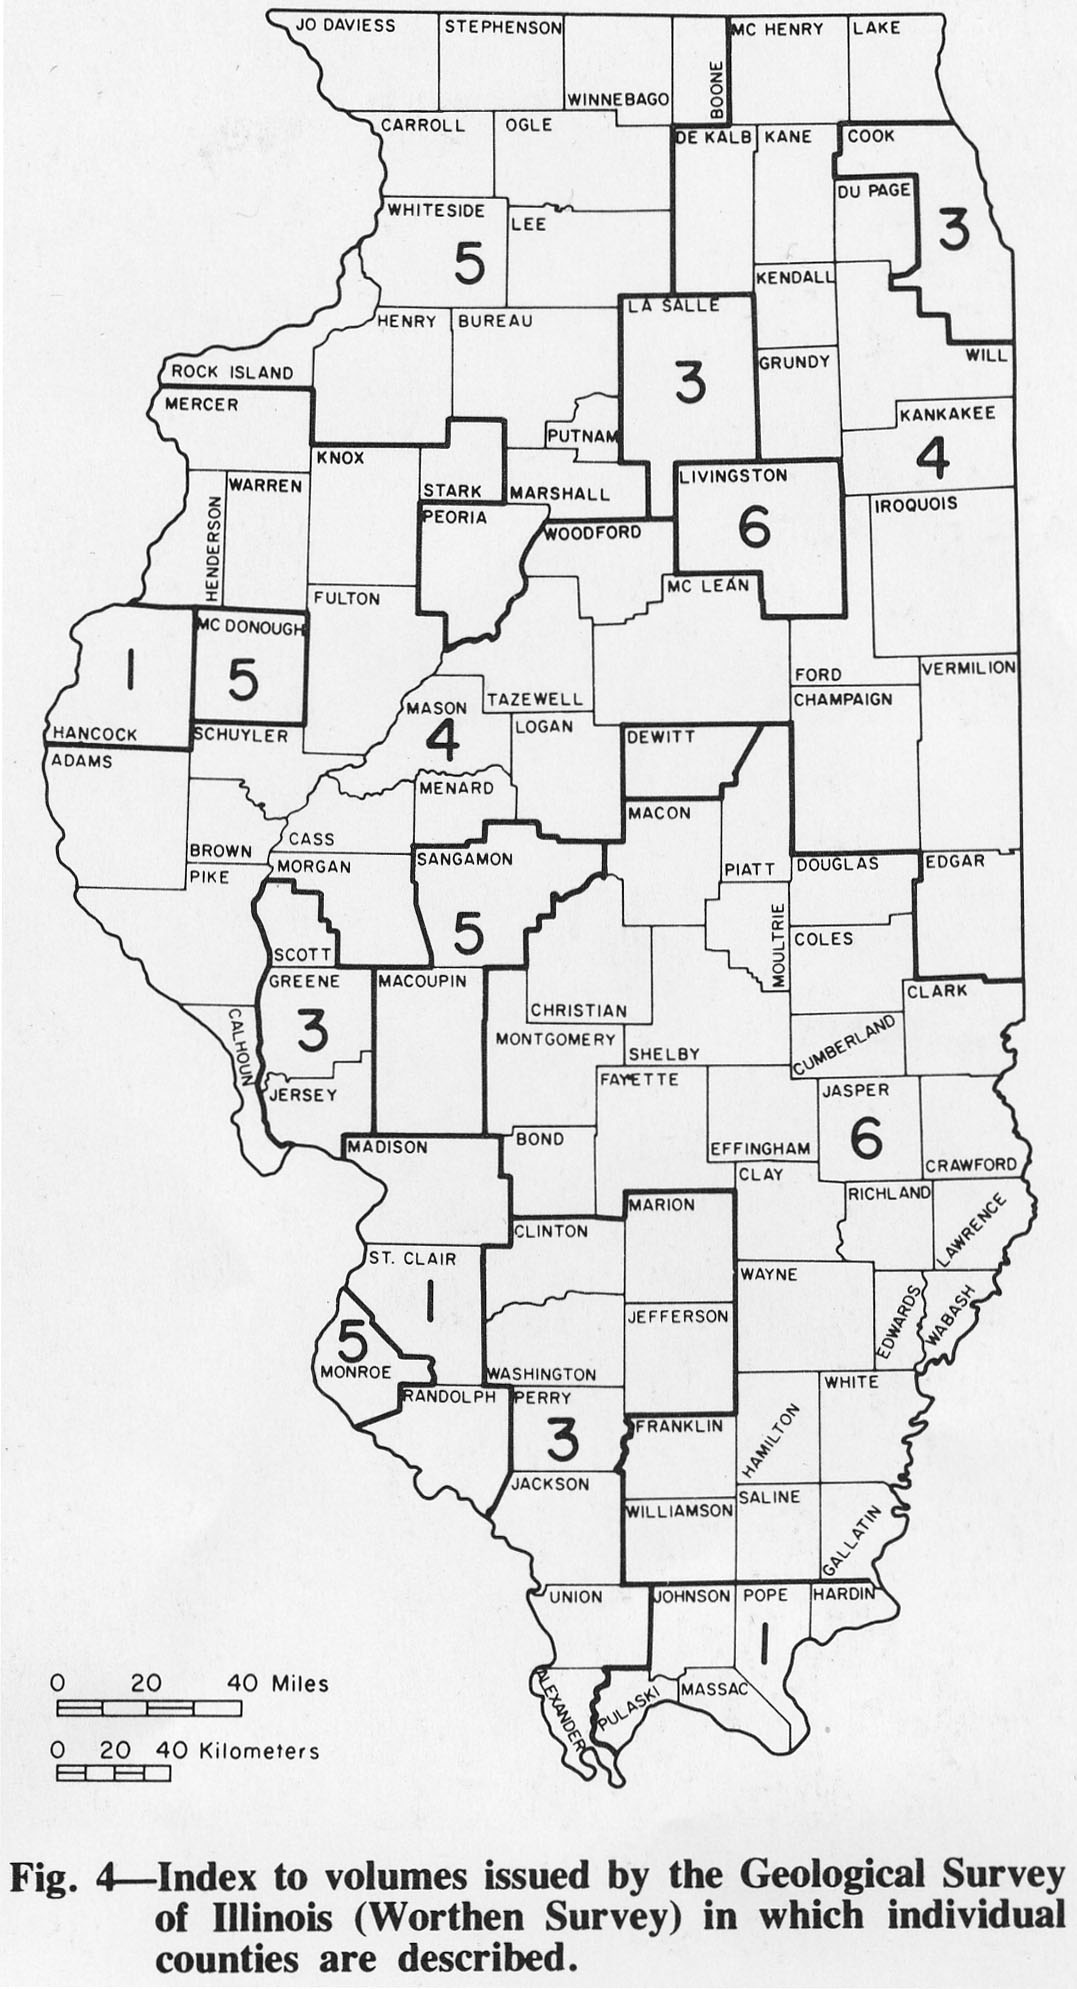
| 15:49, 1 April 2016 | Figure 4.jpg (file) |  |
274 KB | Alan.Myers | Fig. 4 -- Index to volumes issued by the Geological Survey of Illinois (Worthen Survey) in which individual counties are described. | 1 |
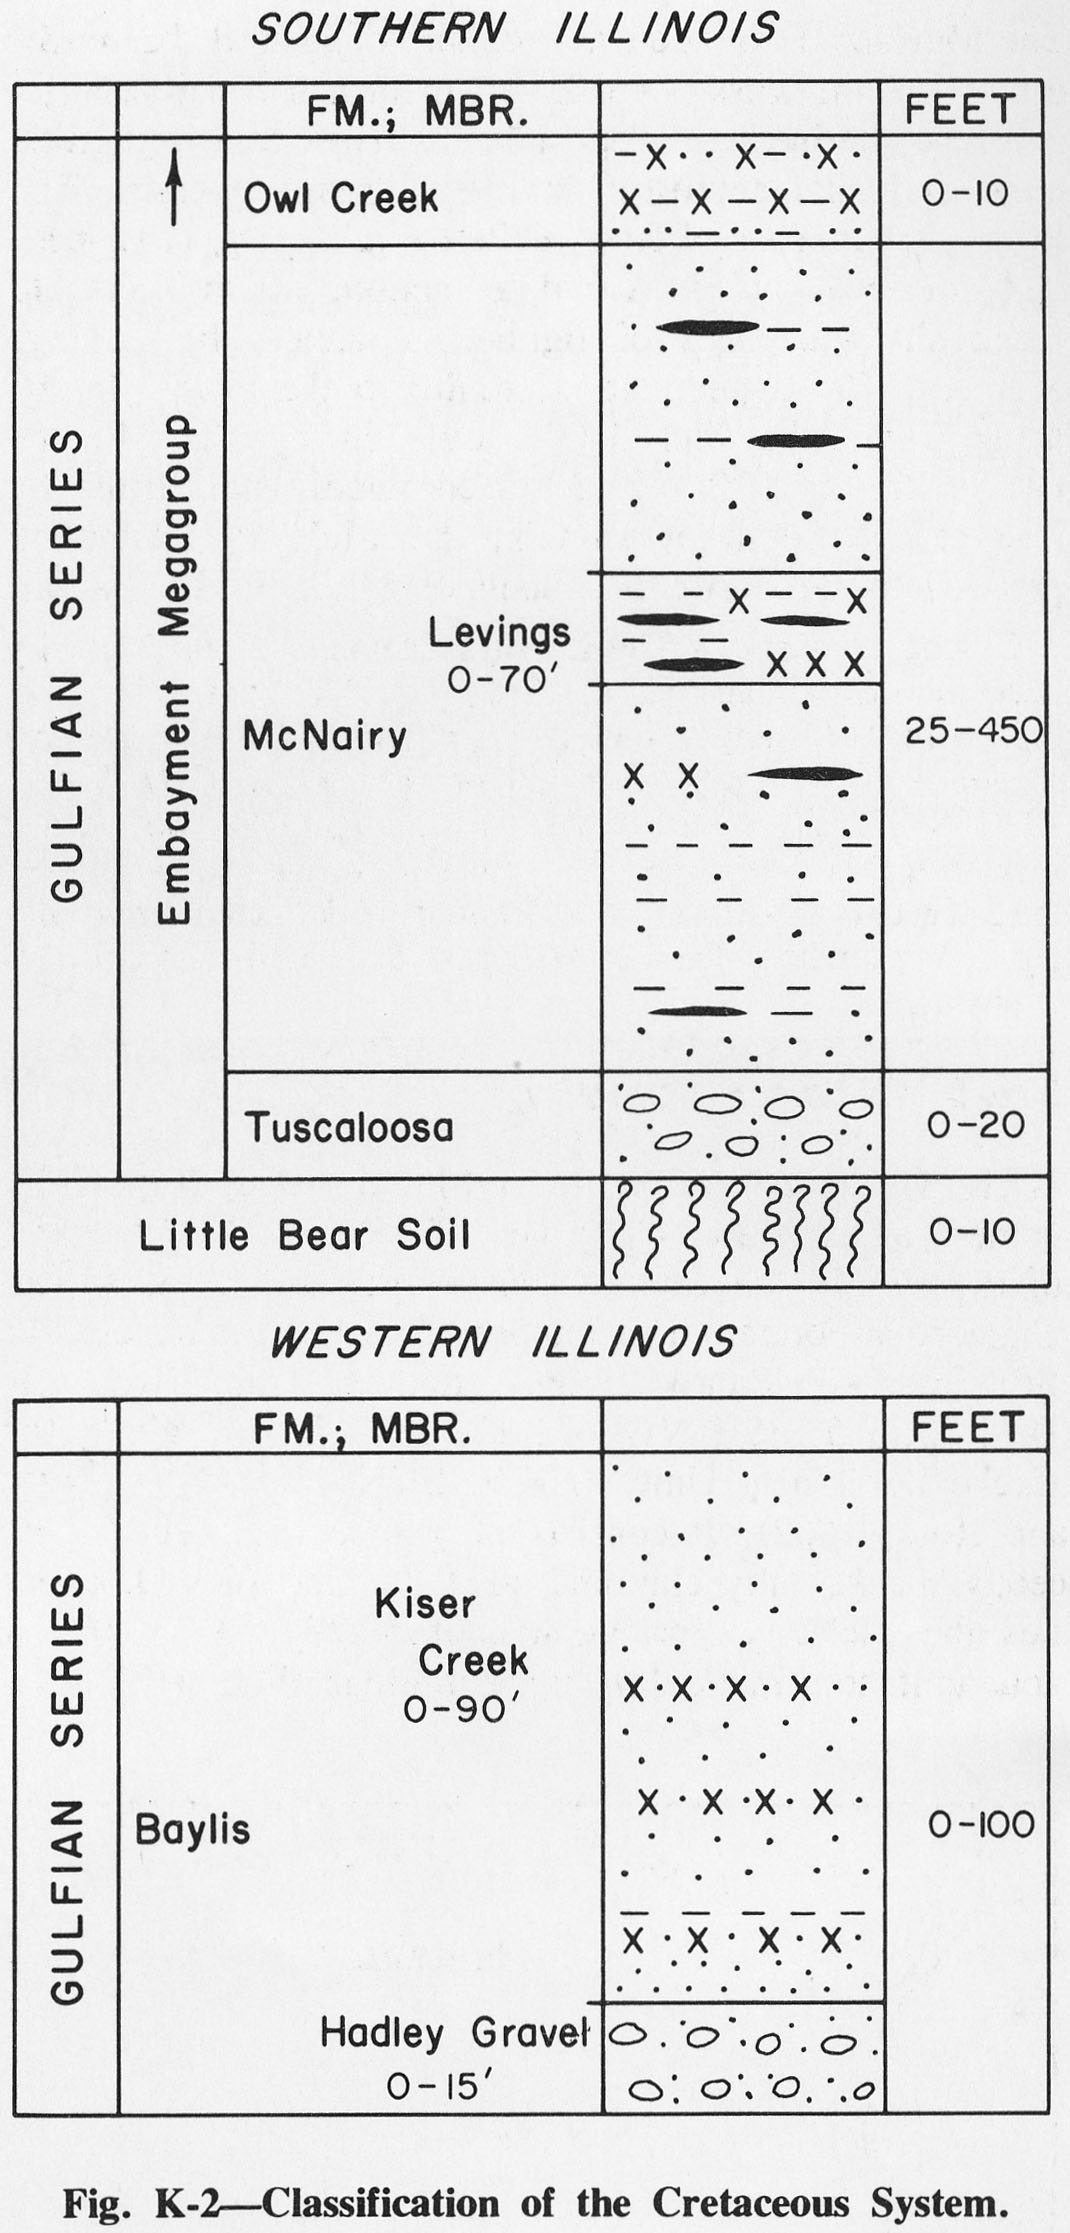
| 15:02, 6 August 2015 | Figure K-2.jpg (file) |  |
275 KB | Alan.Myers | Fig. K-2 -- Classification of the Cretaceous System | 1 |
| 15:31, 1 April 2016 | Figure P-7.jpg (file) |  |
276 KB | Illex-gron | Fig. P-7 -- Arrangement of lithologic units in a cyclothem (after Willman and Payne, 1942). | 1 |
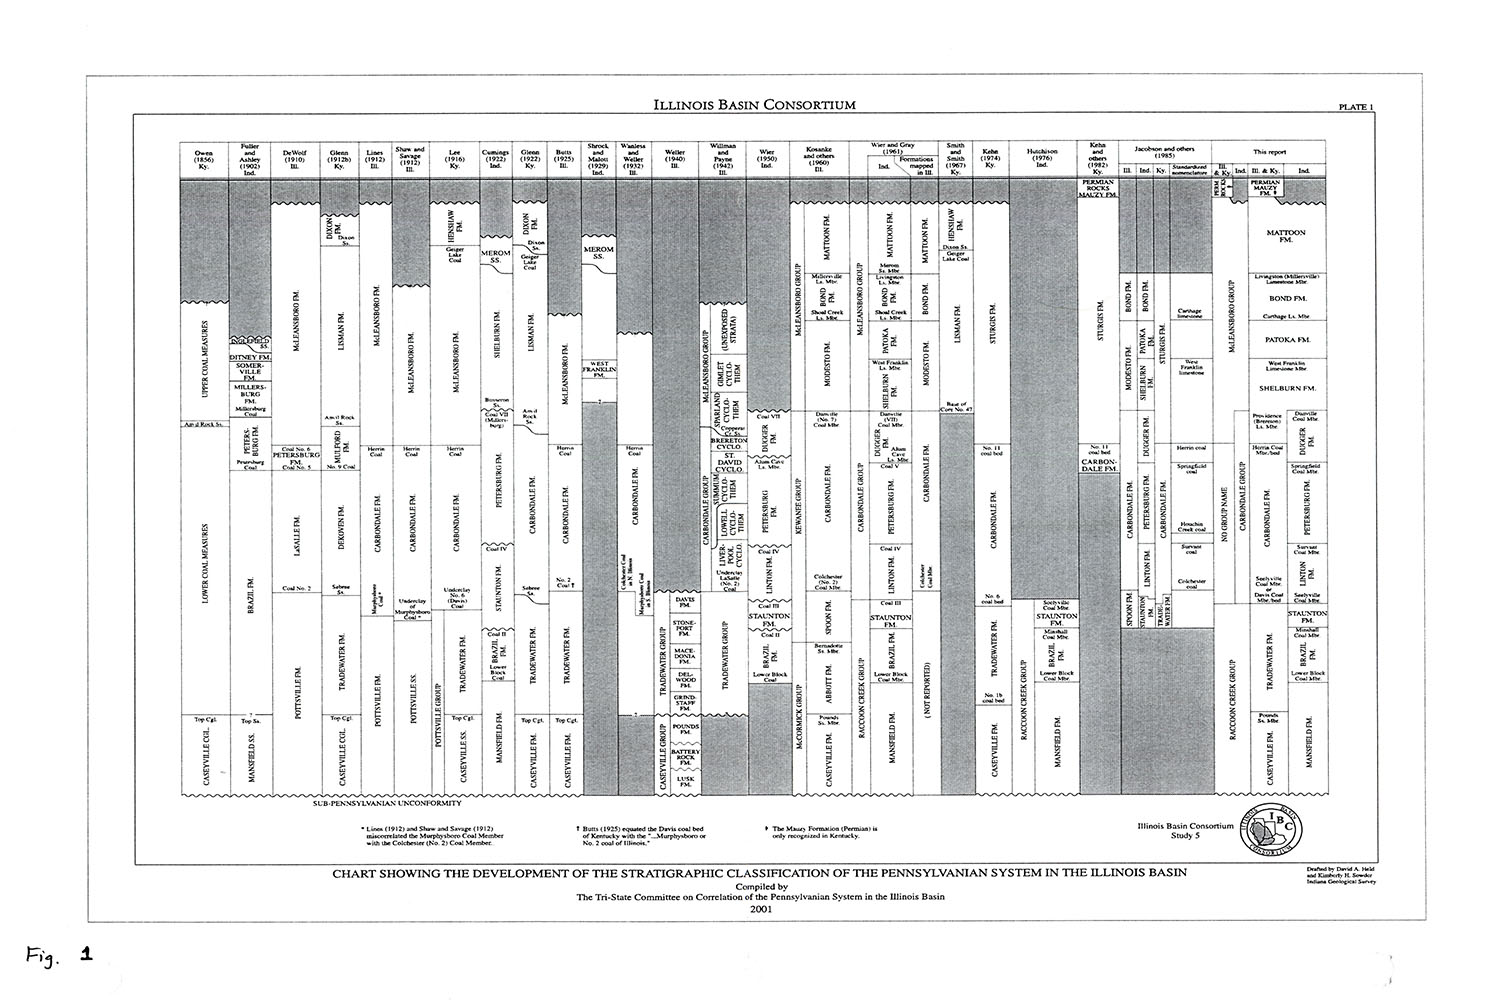
| 16:57, 8 March 2016 | Penn carb fig1.jpg (file) |  |
276 KB | Jennifer.Obrad | Chart Showing the Development of the Stratigraphic Classification of the Pennsylvanian System in the Illinois Basin. Compiled by the Tri-State Committee on Correlation of the Pennsylvanian System in the Illinois Basion, 2001. | 1 |
| 14:56, 4 April 2016 | Figure O-17.jpg (file) |  |
282 KB | Alan.Myers | Fig. O-17 -- Thickness of the St. Peter Sandstone. | 1 |
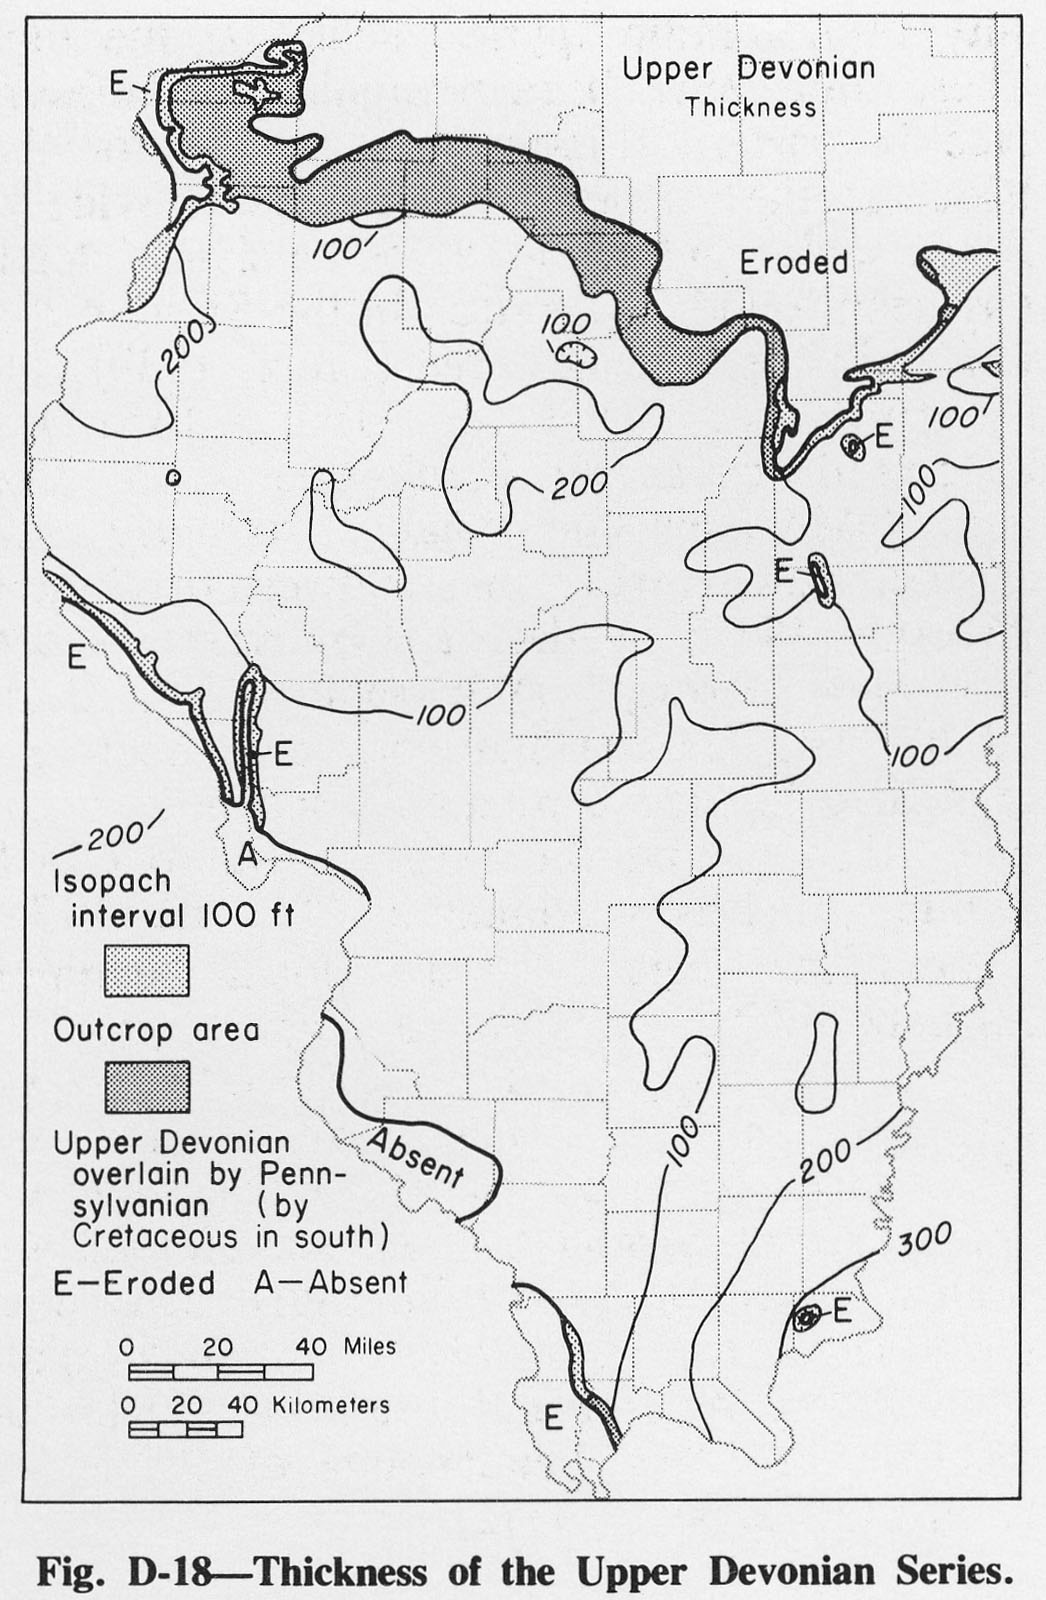
| 20:15, 1 April 2016 | Figure D-18.jpg (file) |  |
283 KB | Alan.Myers | 1 | |
| 14:02, 4 April 2016 | Figure M-19.jpg (file) |  |
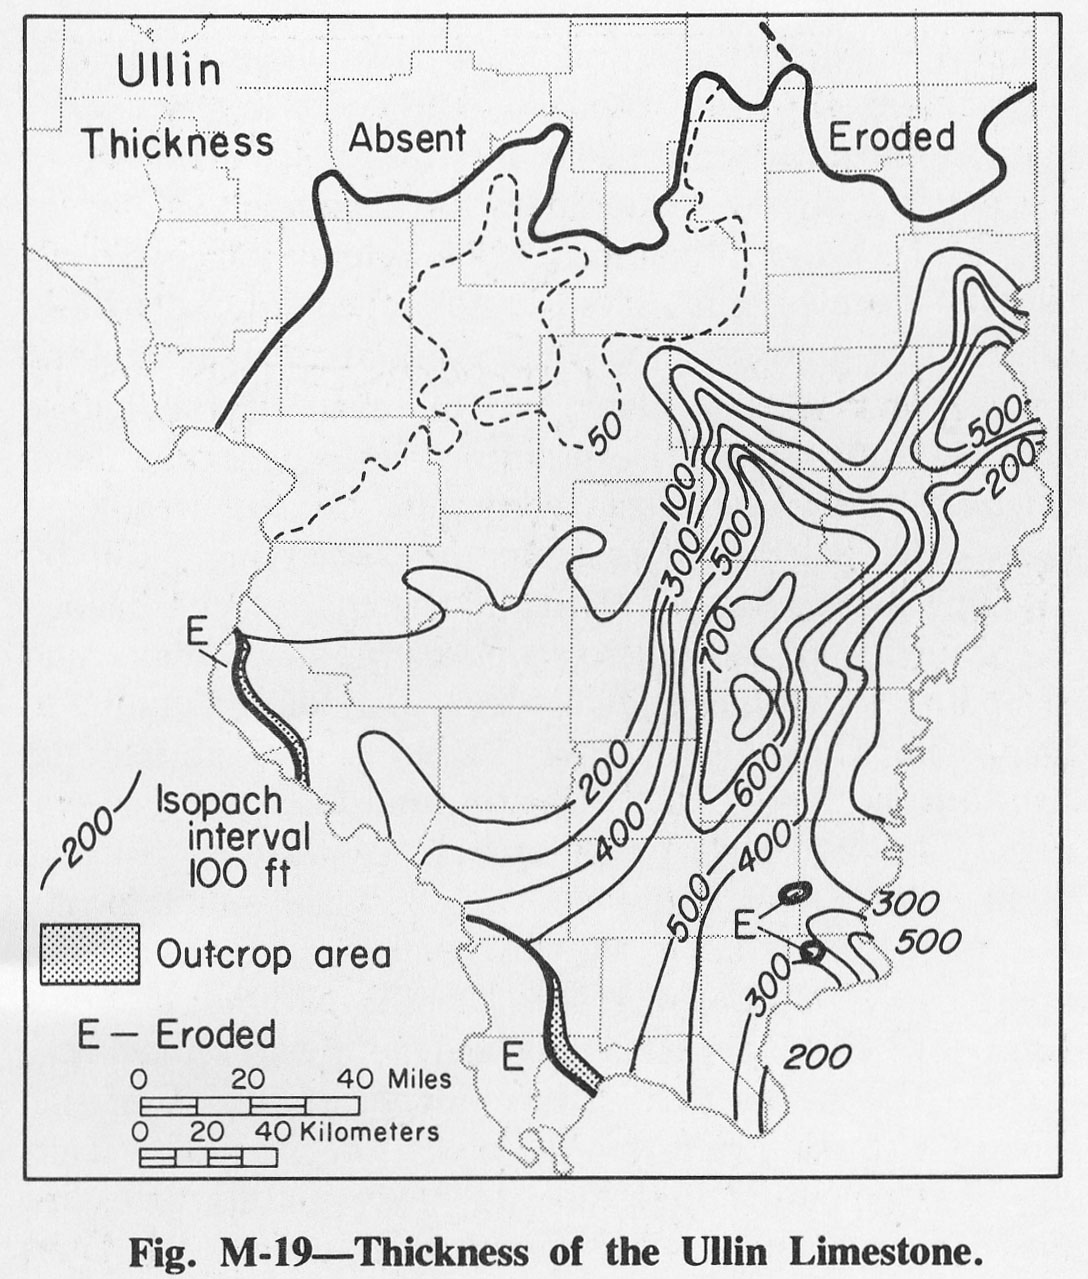
285 KB | Alan.Myers | Fig. M-19 -- Thickness of the Ullin Limestone. | 1 |
| 15:23, 9 July 2020 | C605-Figure-26.jpg (file) |  |
285 KB | Alan.Myers | 1 | |
| 14:51, 4 April 2016 | Figure O-10.jpg (file) |  |
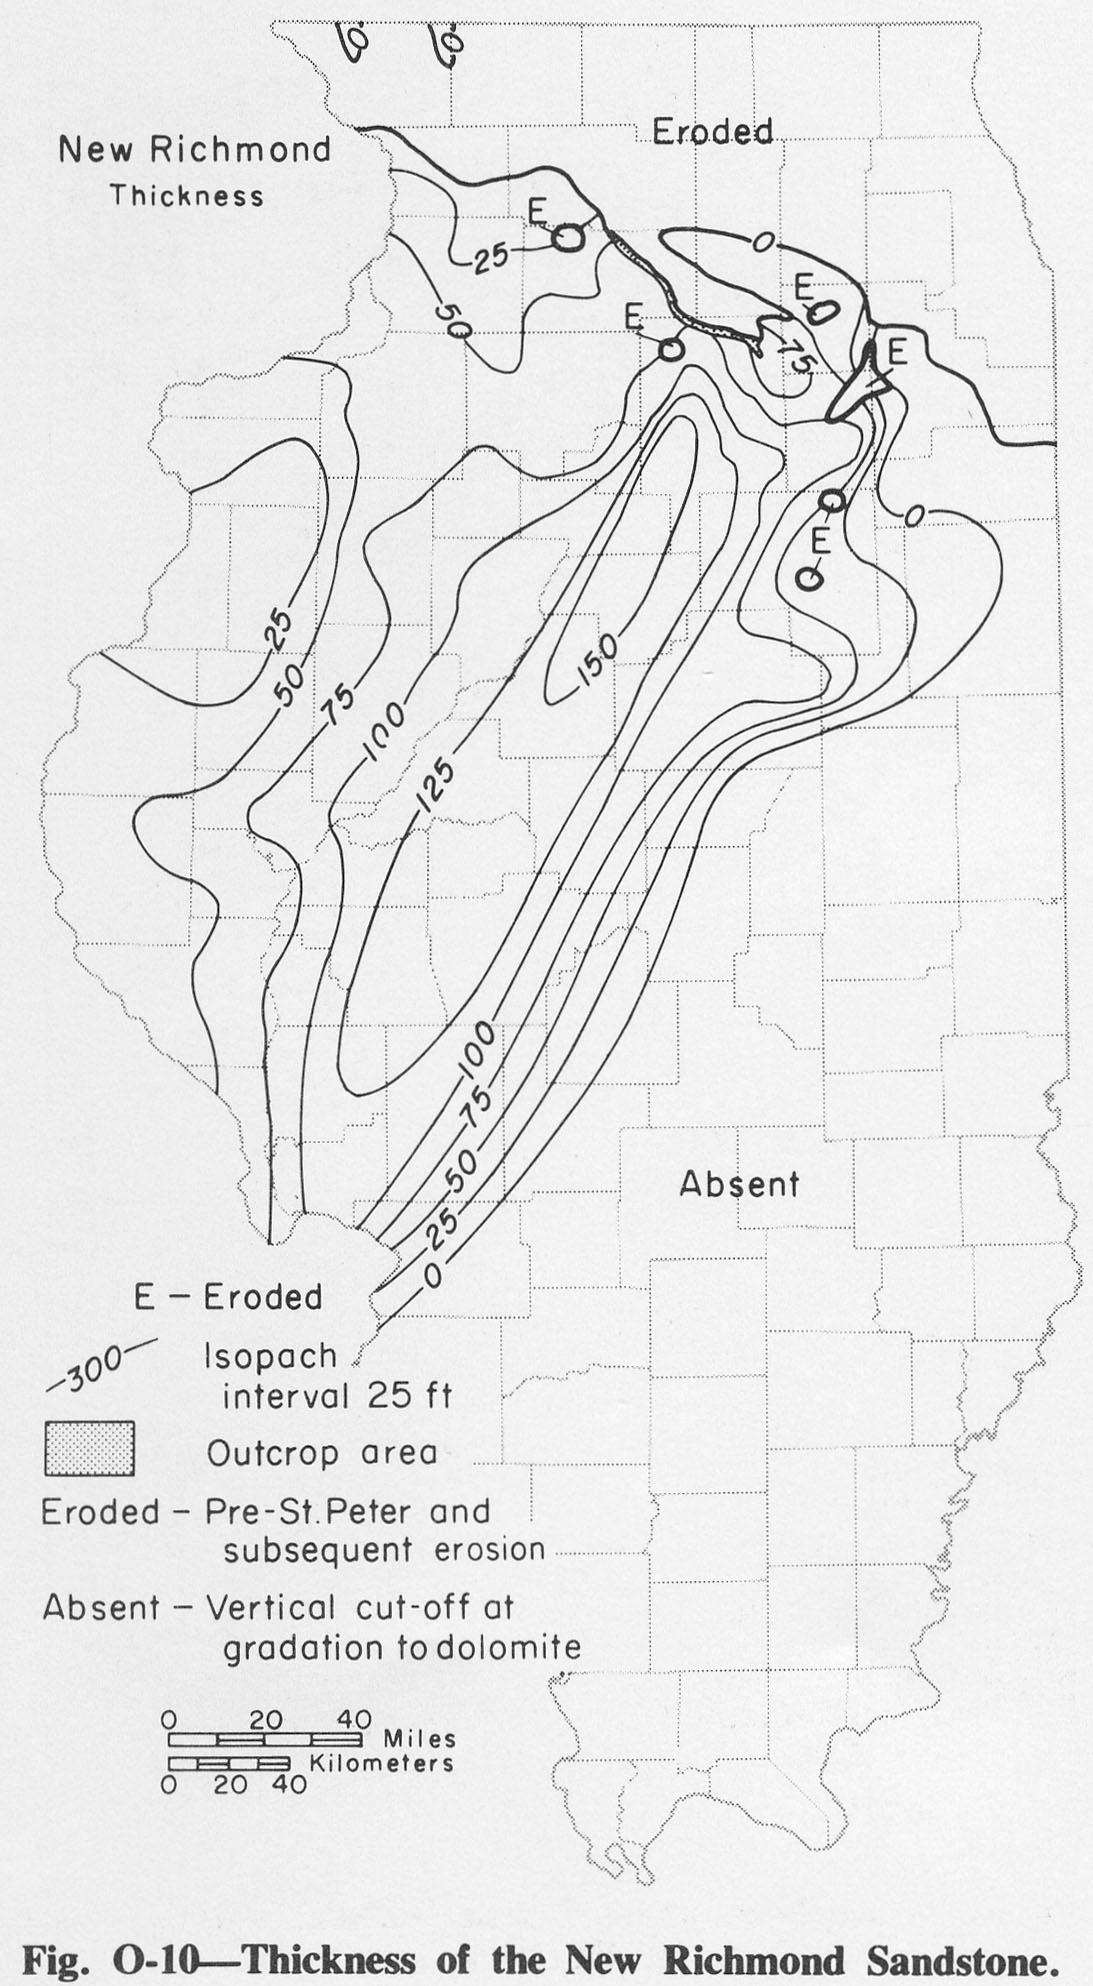
287 KB | Alan.Myers | Fig. O-10 -- Thickness of the New Richmond Sandstone. | 1 |
| 14:48, 4 April 2016 | Figure O-7.jpg (file) |  |
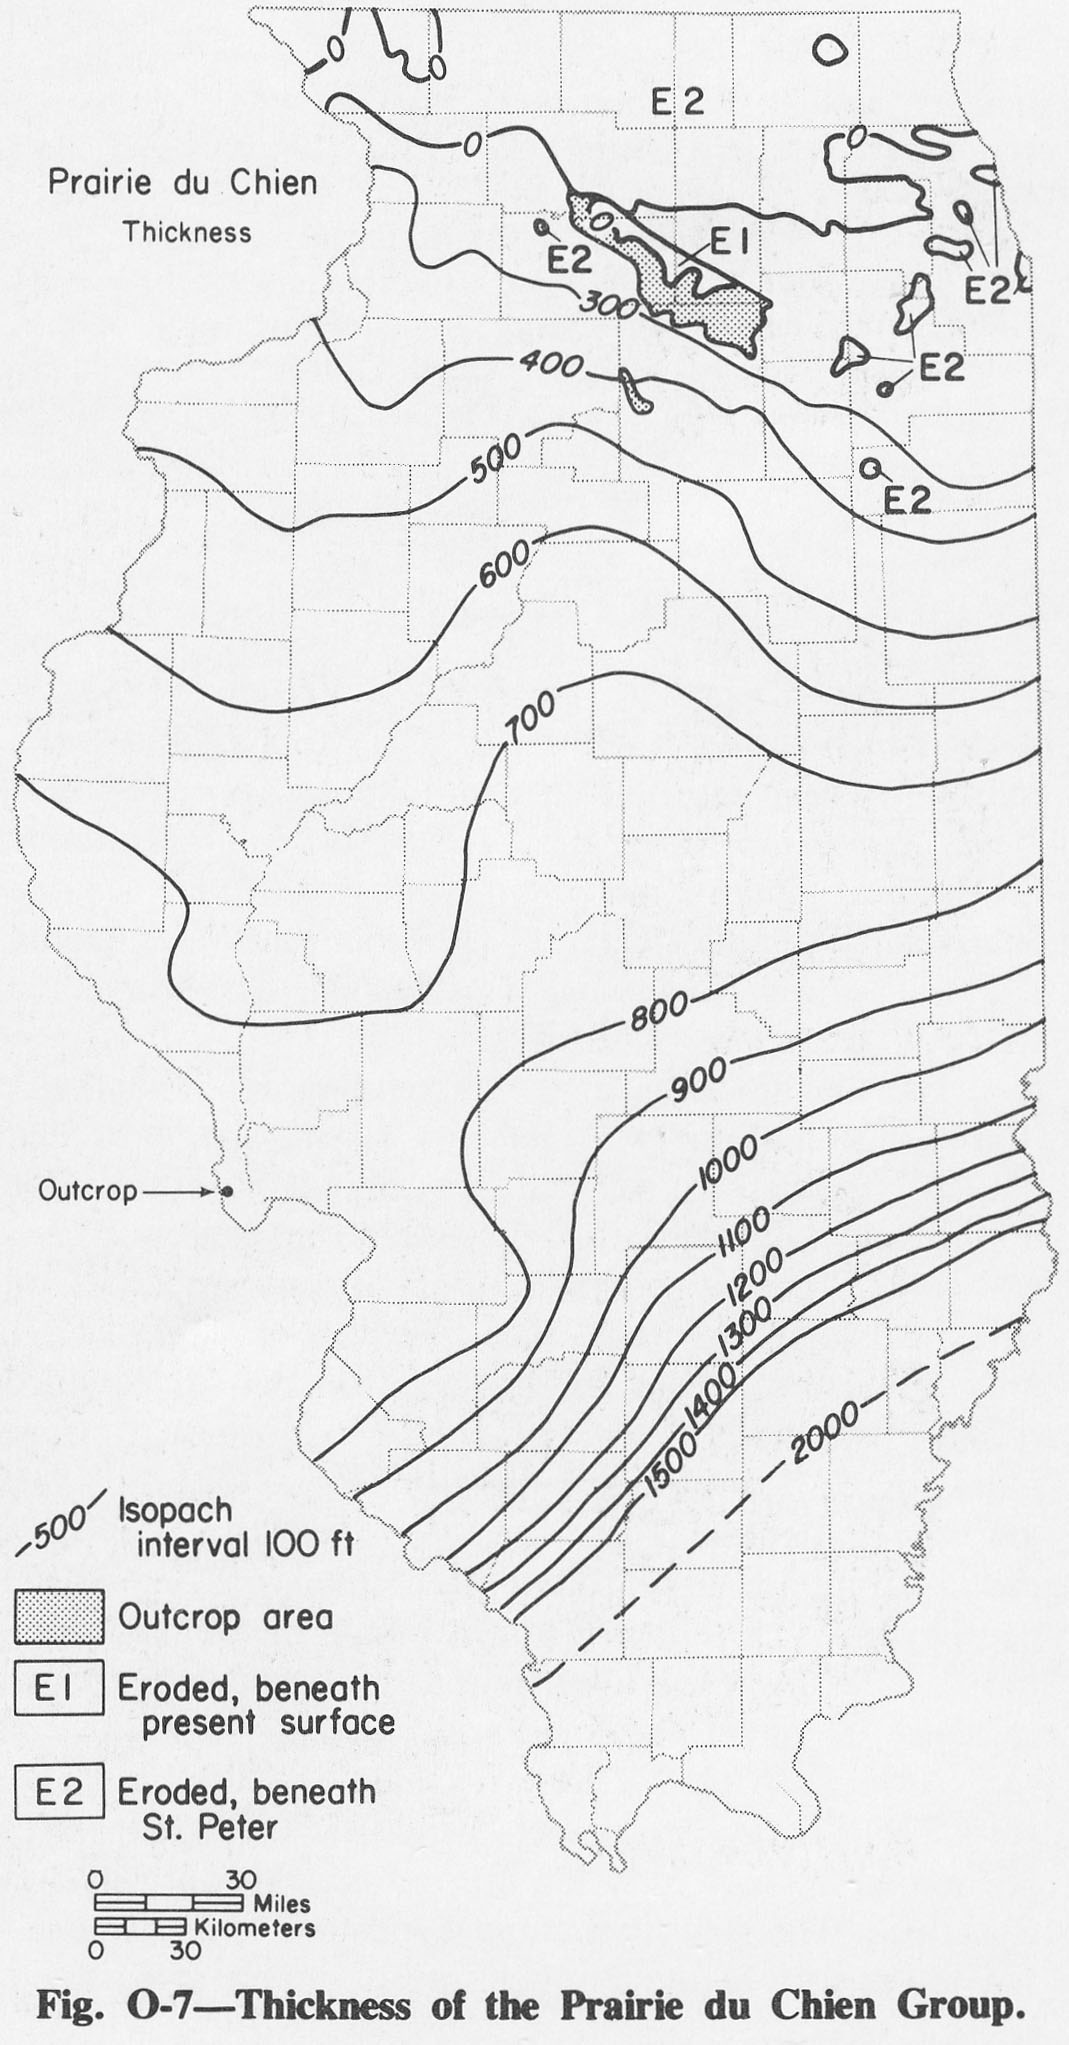
289 KB | Alan.Myers | Fig. O-7 -- Thickness of the Prairie du Chien Group. | 1 |
| 16:42, 18 April 2016 | 94-fig 12.jpg (file) |  |
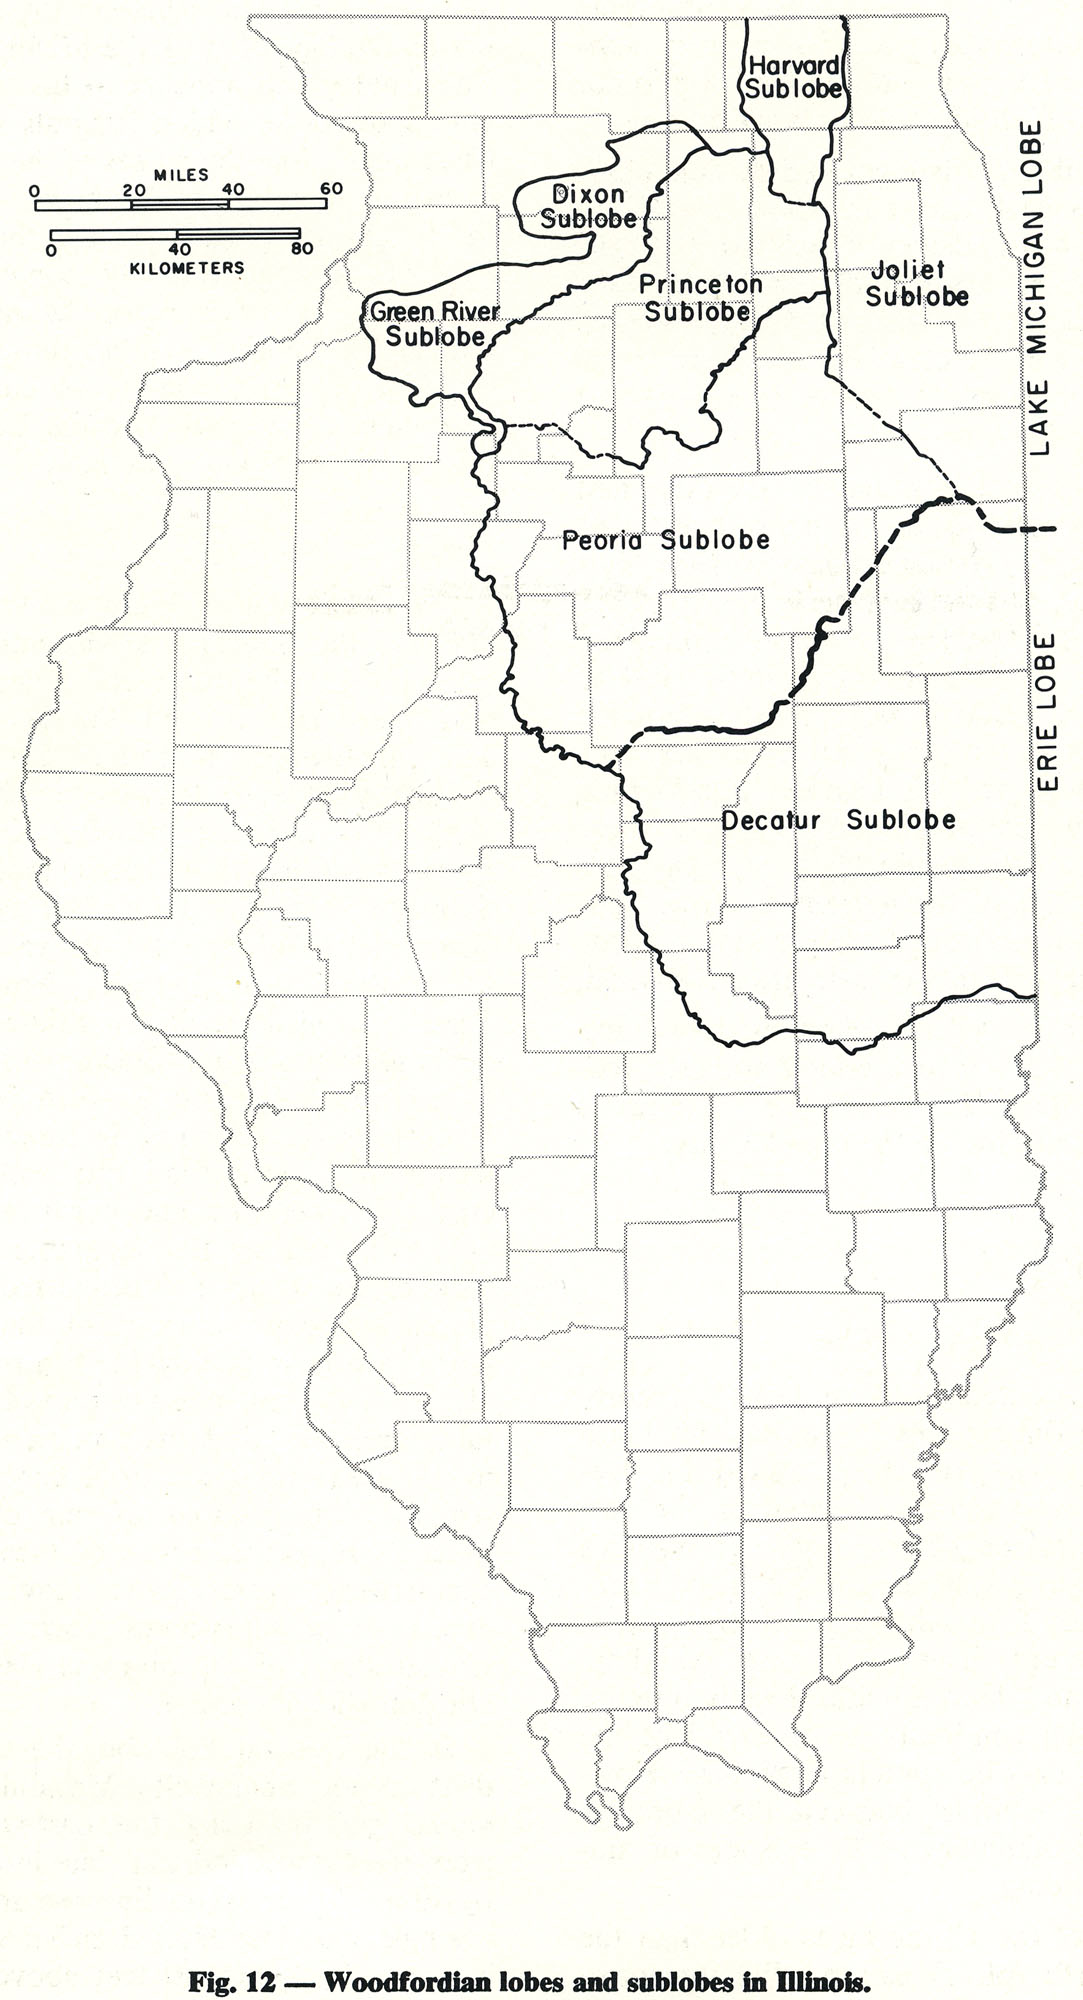
290 KB | Illex-gron | Fig. 12 -- Woodfordian lobes and sublobes in Illinois. | 1 |
| 20:08, 1 April 2016 | Figure D-13.jpg (file) |  |
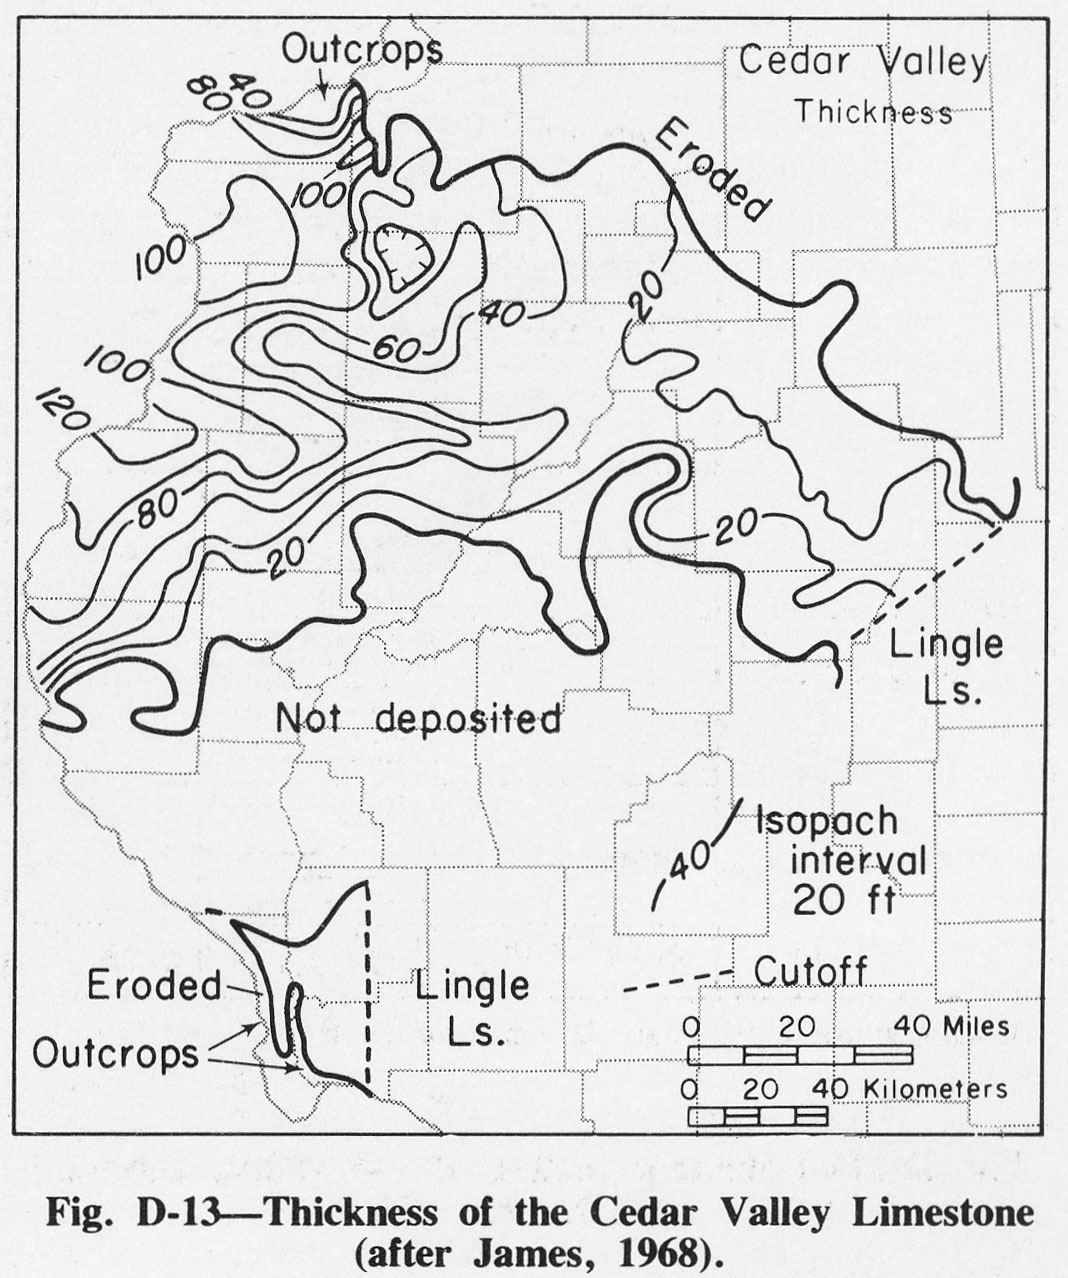
291 KB | Alan.Myers | Fig. D-13 -- Thickness of the Cedar Valley Limestone (after James, 1968). | 1 |
| 14:50, 4 April 2016 | Figure O-9.jpg (file) |  |
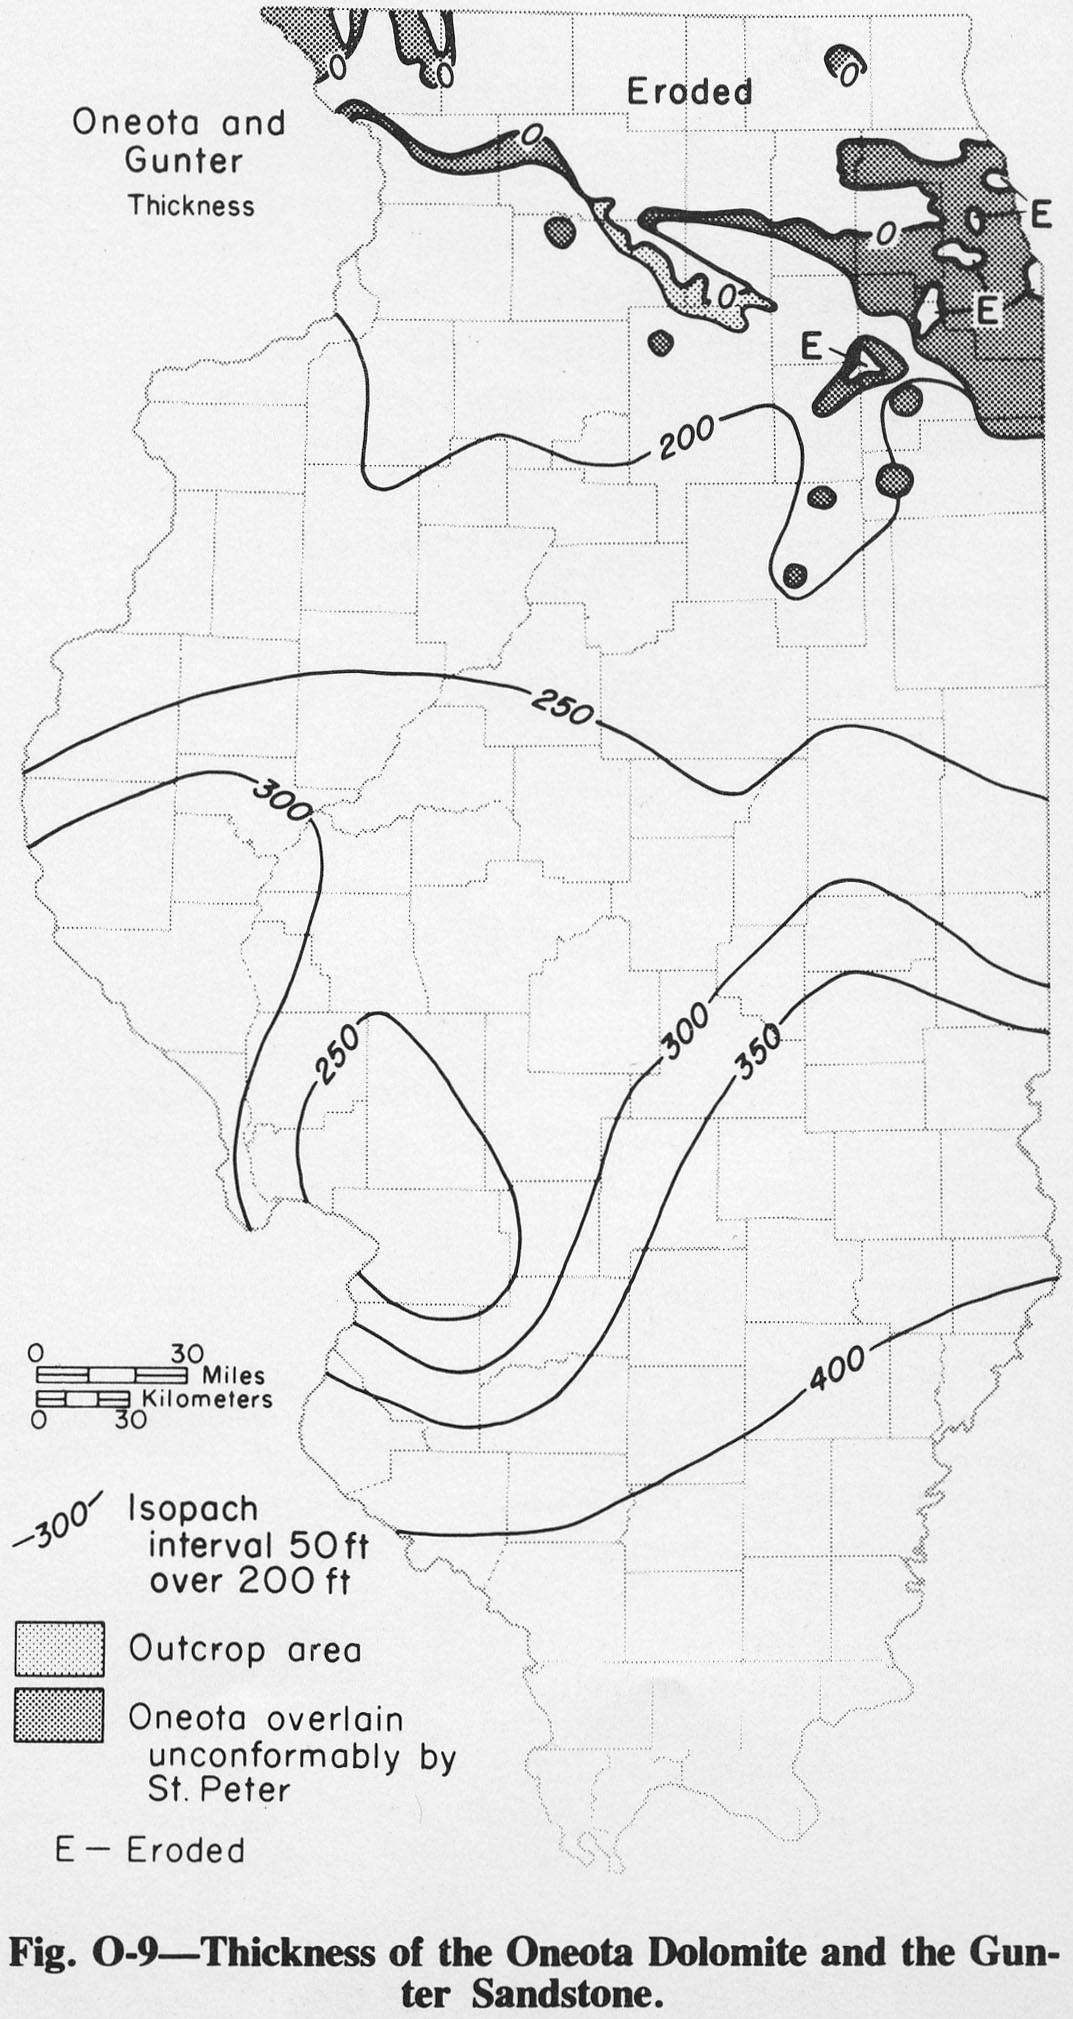
291 KB | Alan.Myers | Fig. O-9 -- Thickness of the Oneota Dolomite and the Gunter Sandstone. | 1 |
| 19:51, 1 April 2016 | Figure C-13.jpg (file) |  |
293 KB | Alan.Myers | Fig. C-13 -- Thickness of the Eminence Formation. | 1 |
| 19:50, 1 April 2016 | Figure C-12.jpg (file) |  |
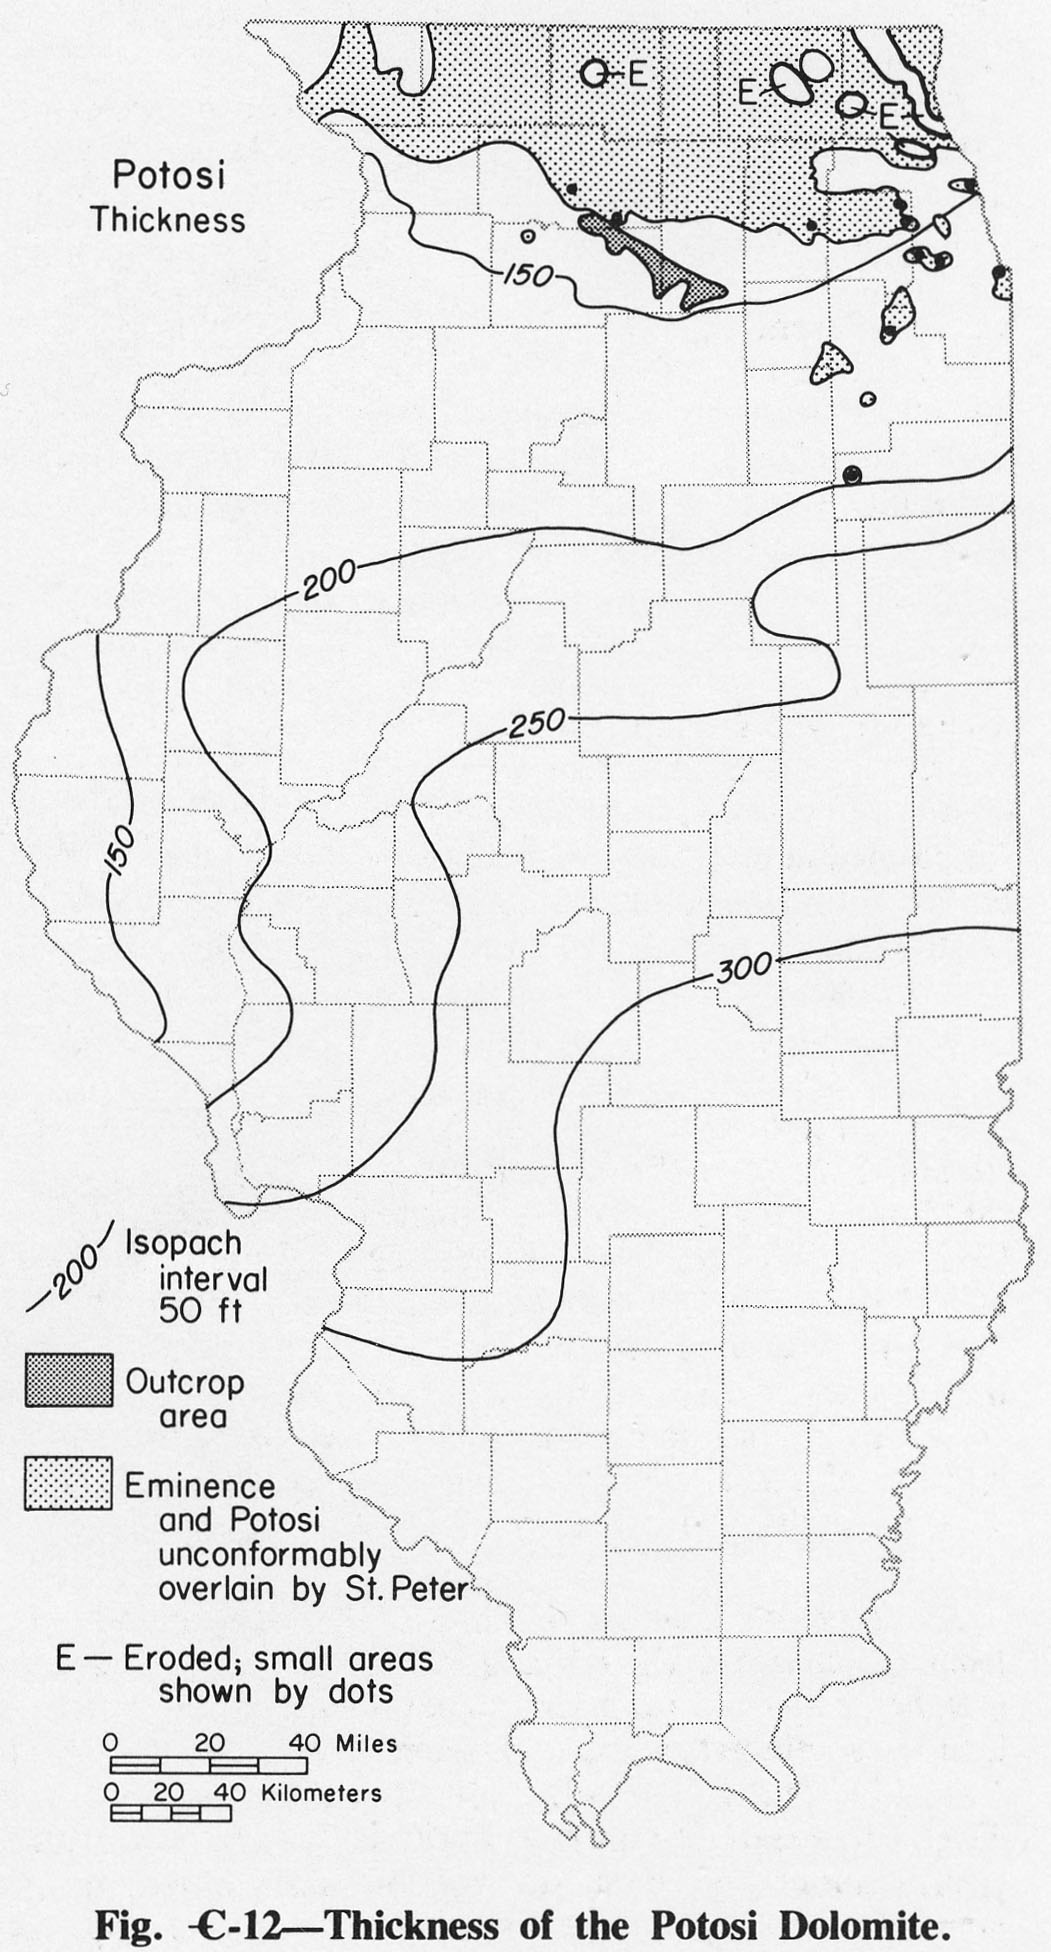
298 KB | Alan.Myers | Fig. C-12 -- Thickness of the Potosi Dolomite. | 1 |
| 14:17, 4 April 2016 | Figure M-32.jpg (file) |  |
299 KB | Alan.Myers | Fig. M-32 -- Changes in position of the shoreline and the position of the Michigan River during late Valmeyeran and Chesterian times (after Swann, 1963). | 1 |
| 19:40, 1 April 2016 | Figure 17.jpg (file) |  |
301 KB | Alan.Myers | Fig. 17 -- Patterns and symbols used in figures. | 1 |
| 14:51, 4 April 2016 | Figure O-11.jpg (file) |  |
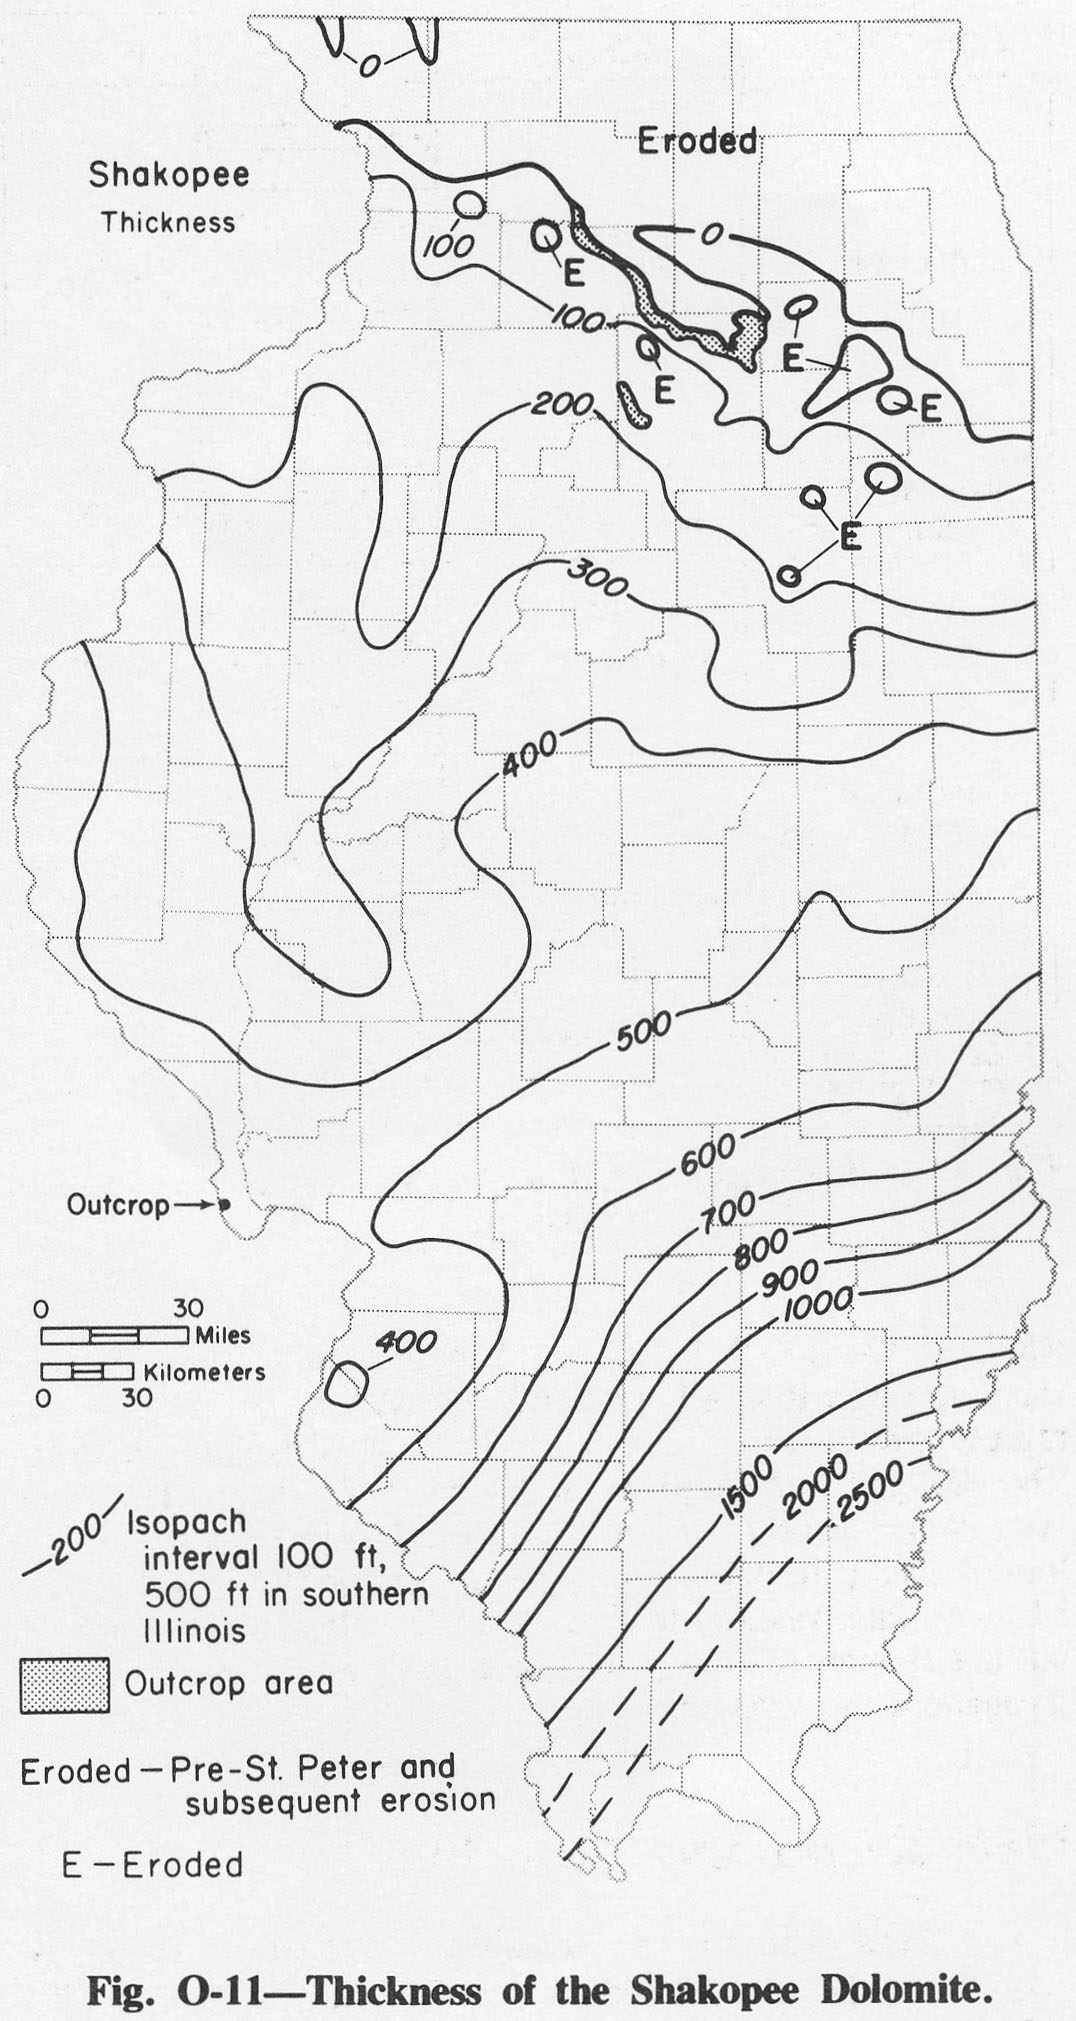
306 KB | Alan.Myers | Fig. O-11 -- Thickness of the Shakoppe Dolomite. | 1 |
| 14:58, 4 April 2016 | Figure O-18.jpg (file) |  |
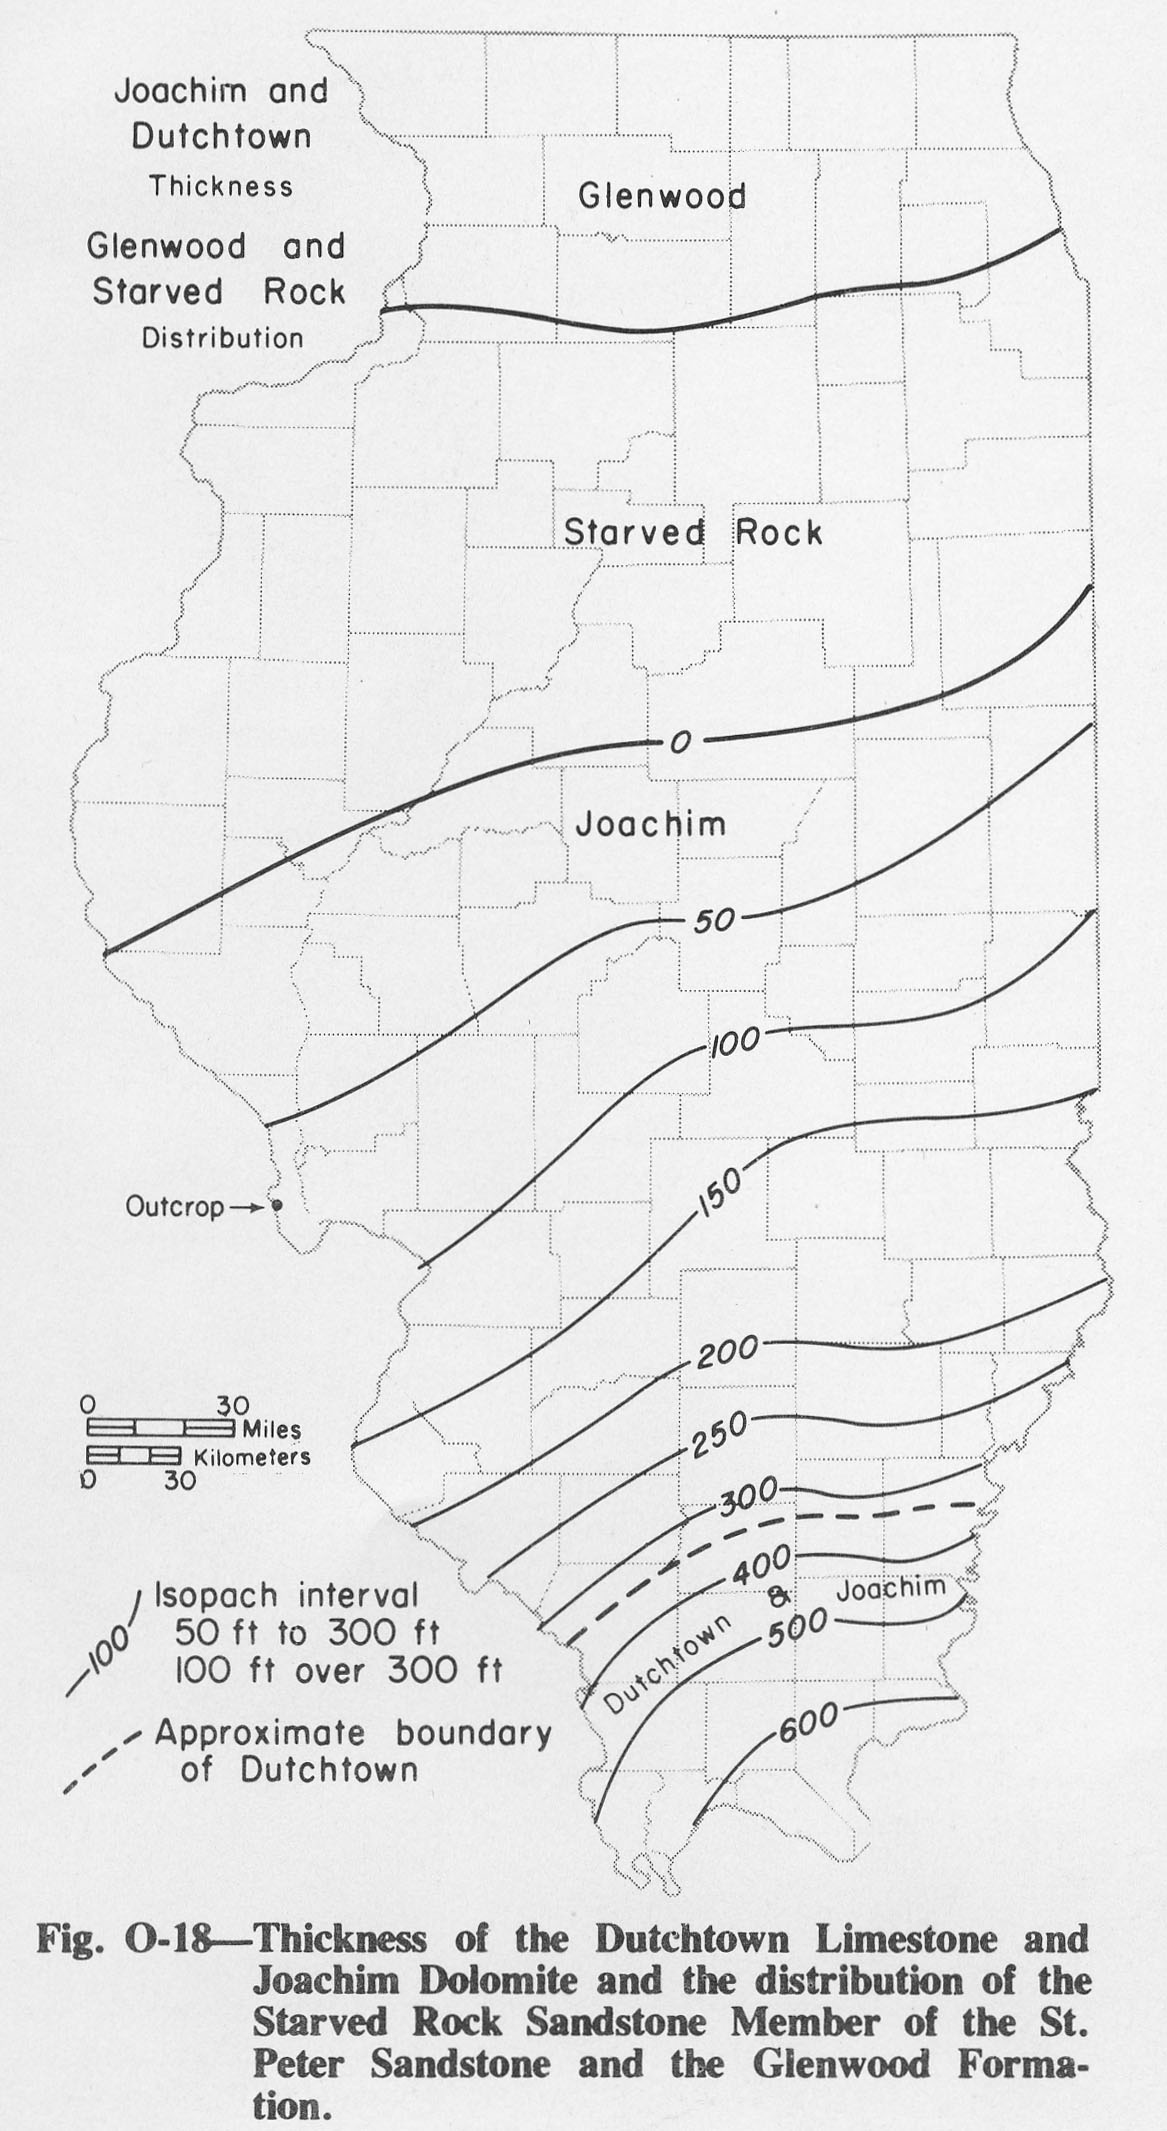
306 KB | Alan.Myers | Fig. O-18 -- Thickness of the Dutchtown Limestone and Joachim Dolomite and the distribution of the Starved Rock Sandstone Member of the St. Peter Sandstone and the Glenwood Formation. | 1 |
| 14:00, 4 April 2016 | Figure M-16.jpg (file) |  |
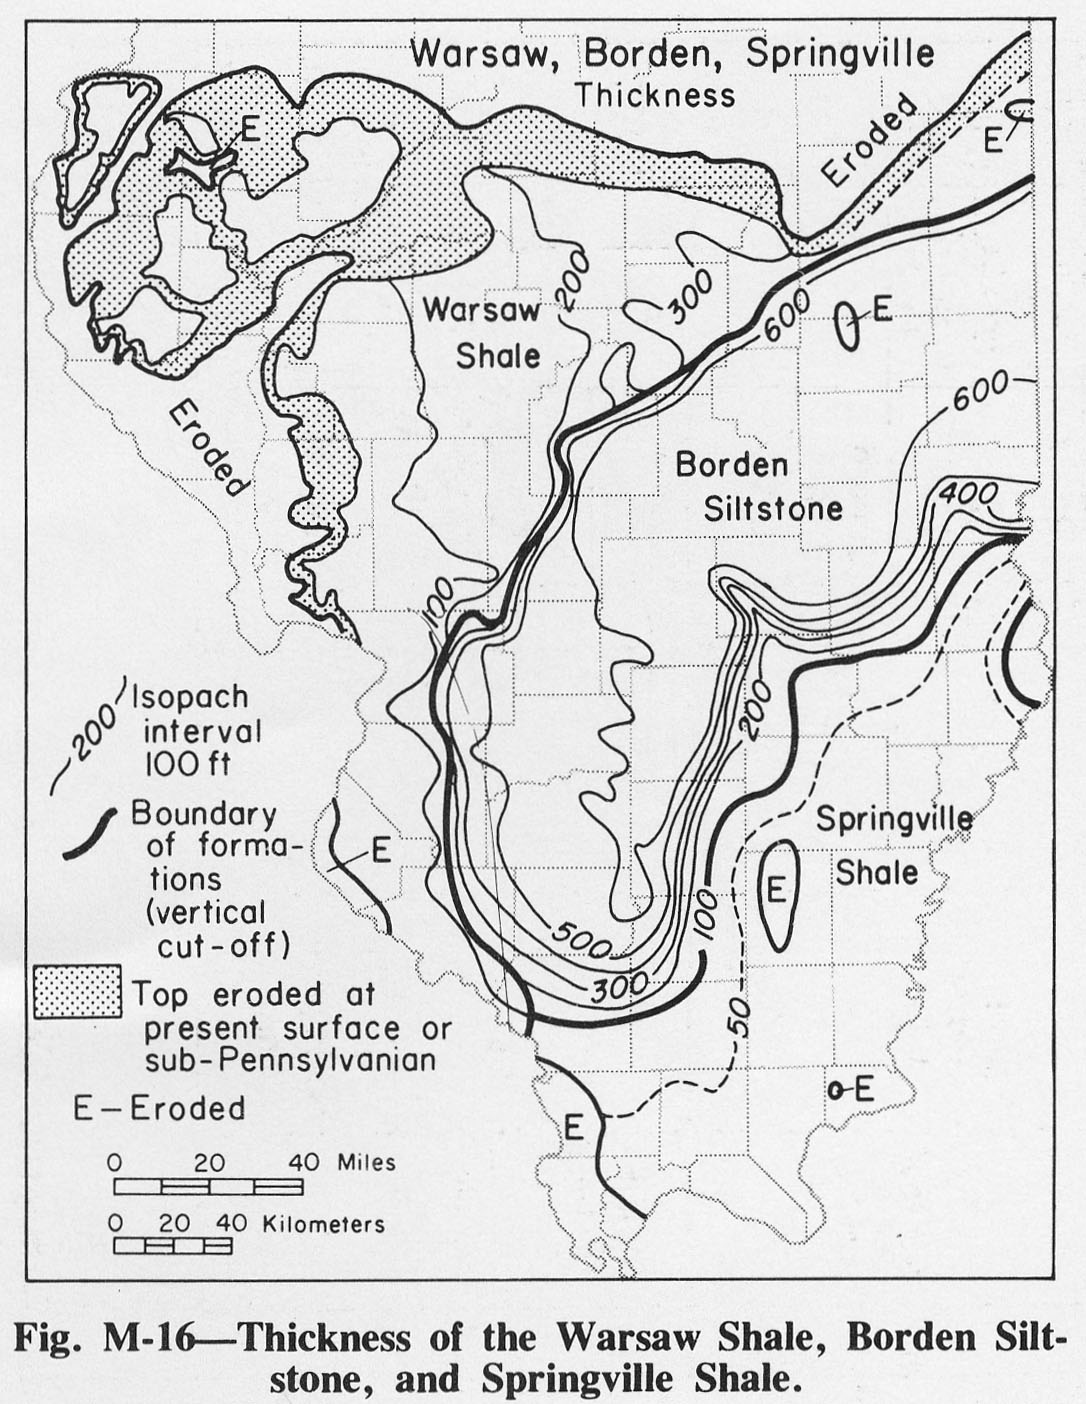
306 KB | Alan.Myers | Fig. M-16 -- Thickness of the Warsaw Shale, Borden Siltstone, and Springville Shale. | 1 |
| 15:47, 19 April 2016 | 104-Figure 1 2.jpg (file) |  |
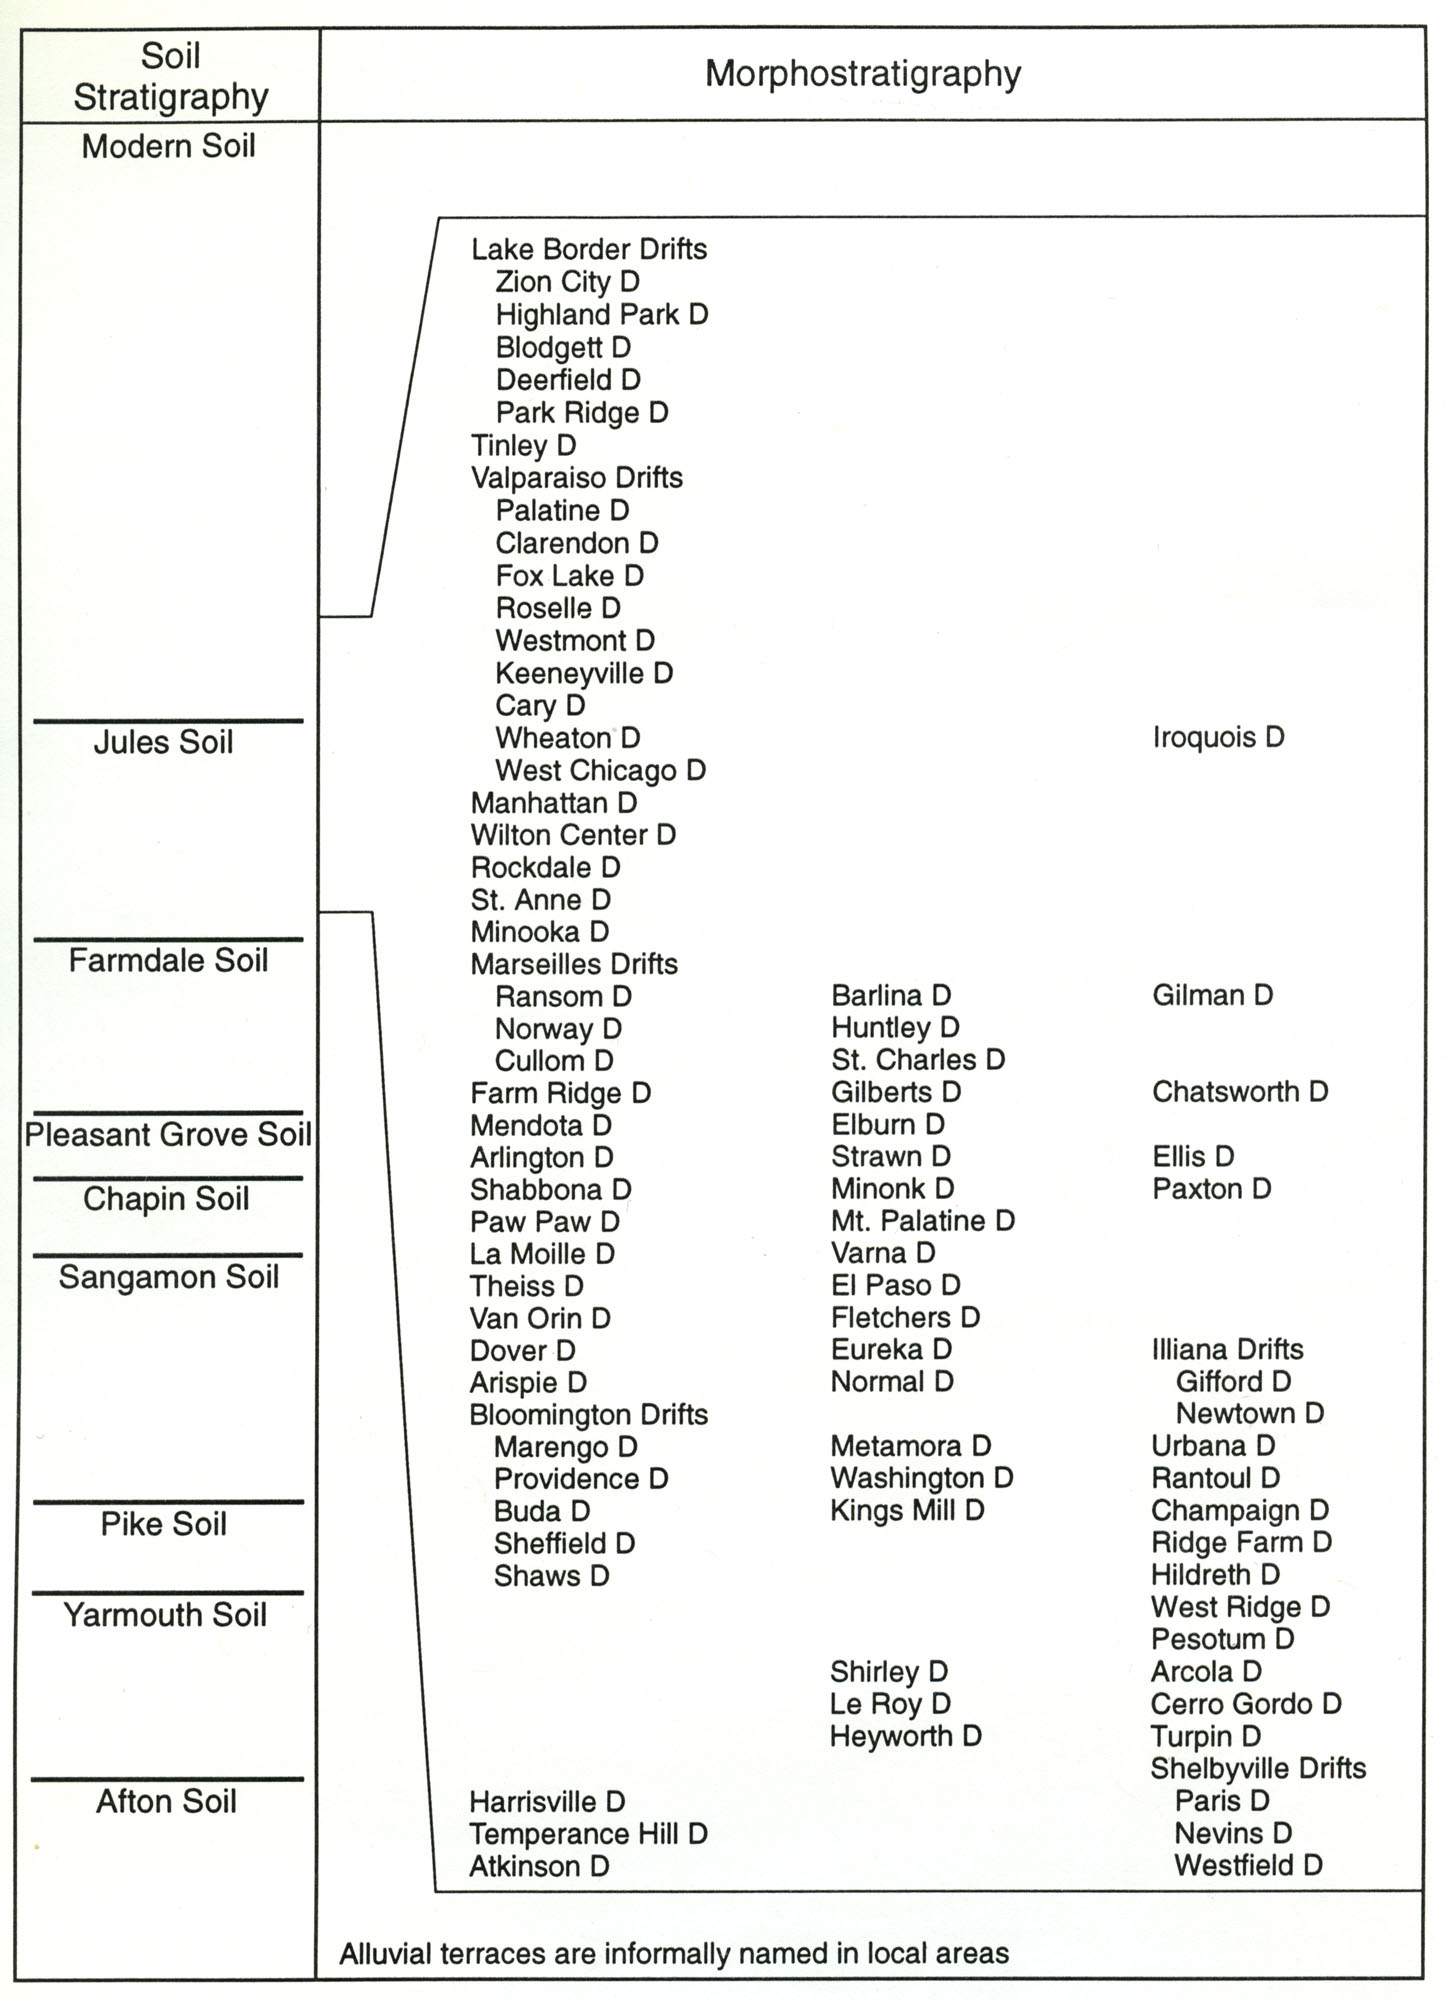
307 KB | Illex-gron | Soil Stratigraphy | 1 |
| 16:41, 18 April 2016 | 94-fig 11.jpg (file) |  |
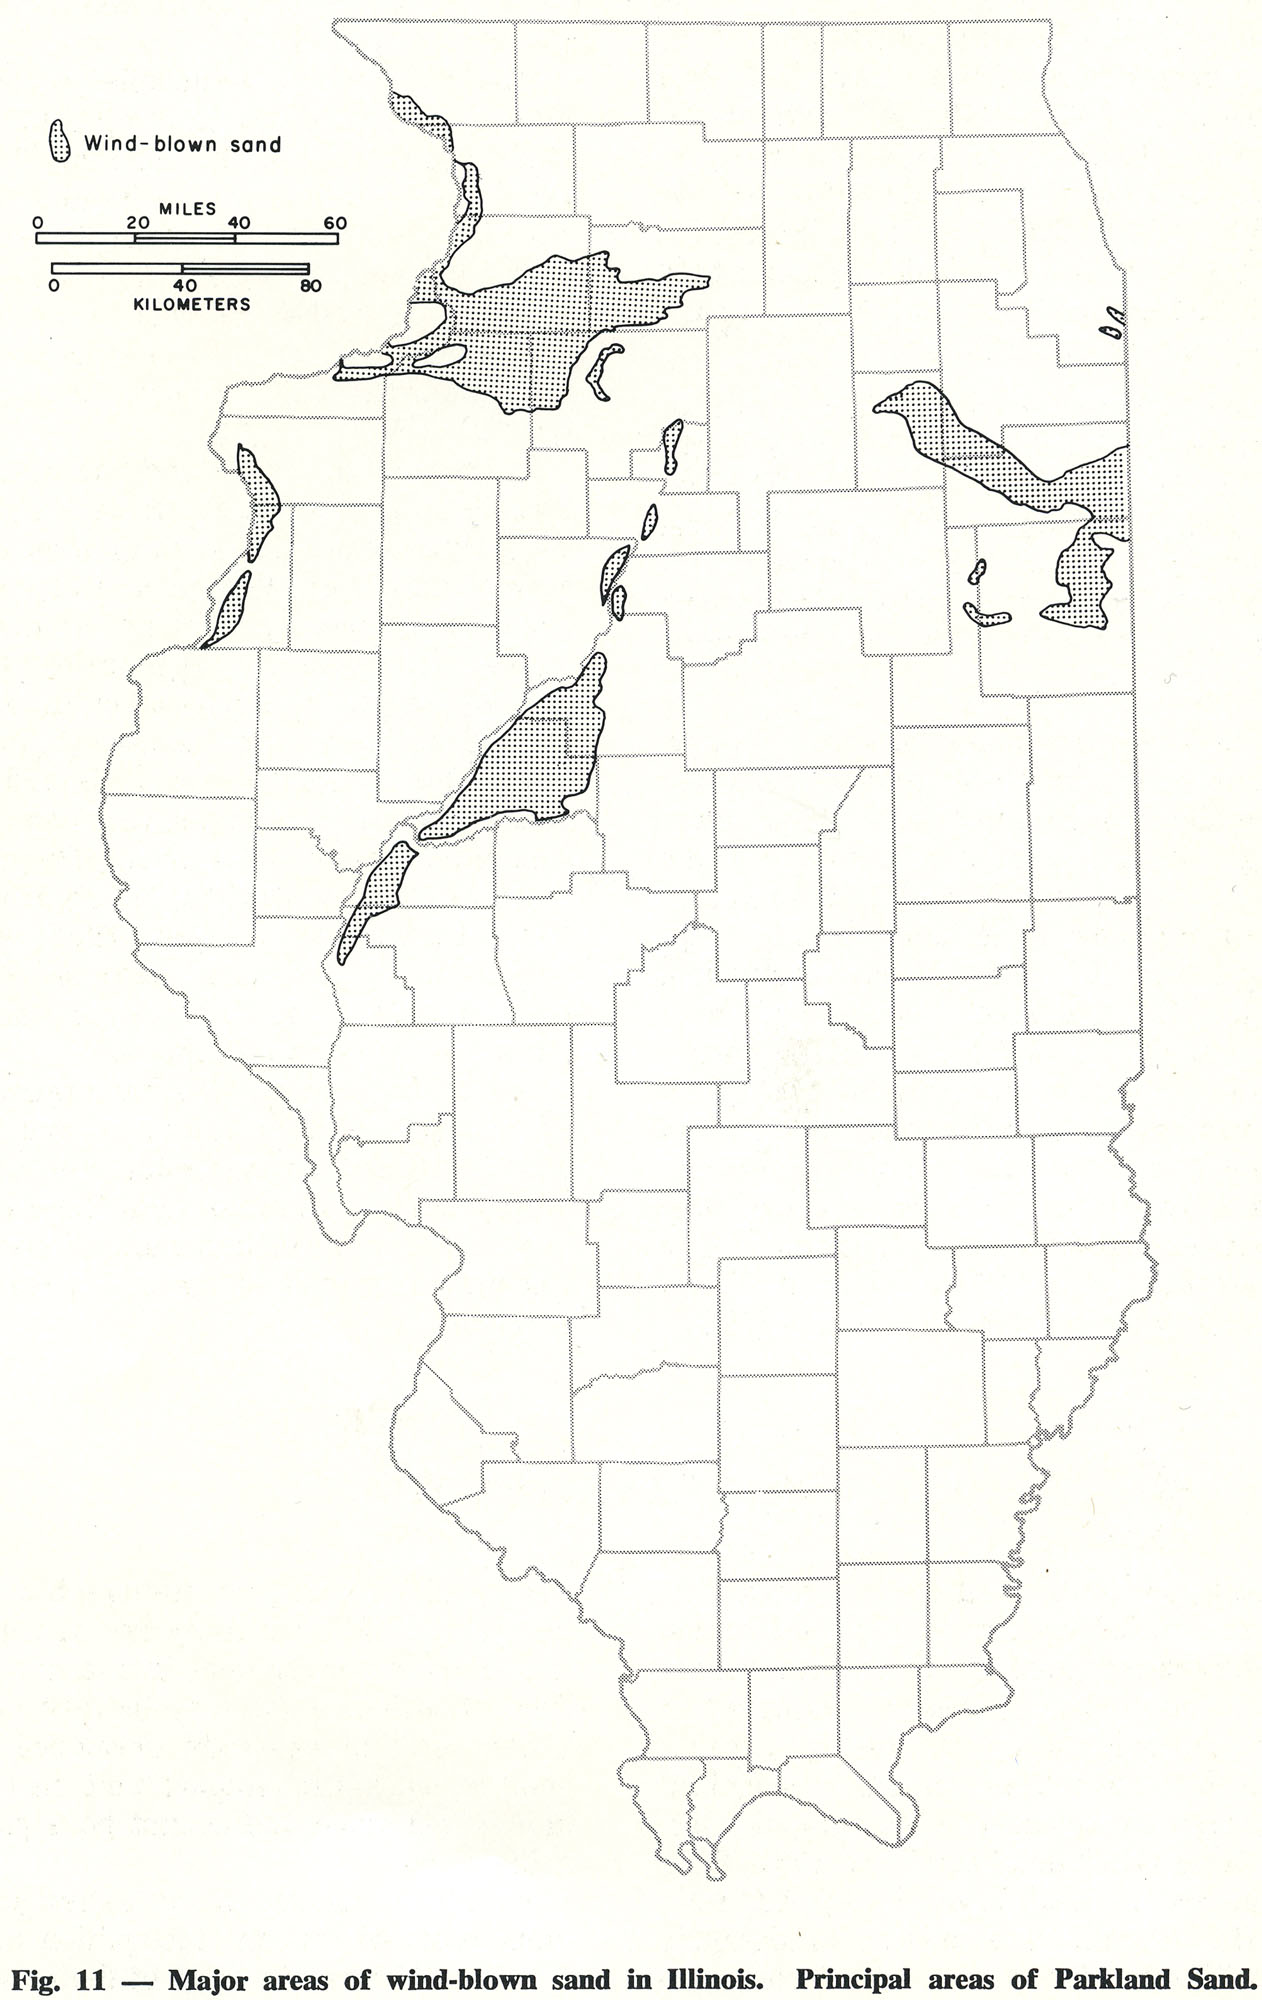
309 KB | Illex-gron | Fig. 11 -- Major areas of wind-blown sand in Illinois. Principal areas of Parkland Sand. | 1 |
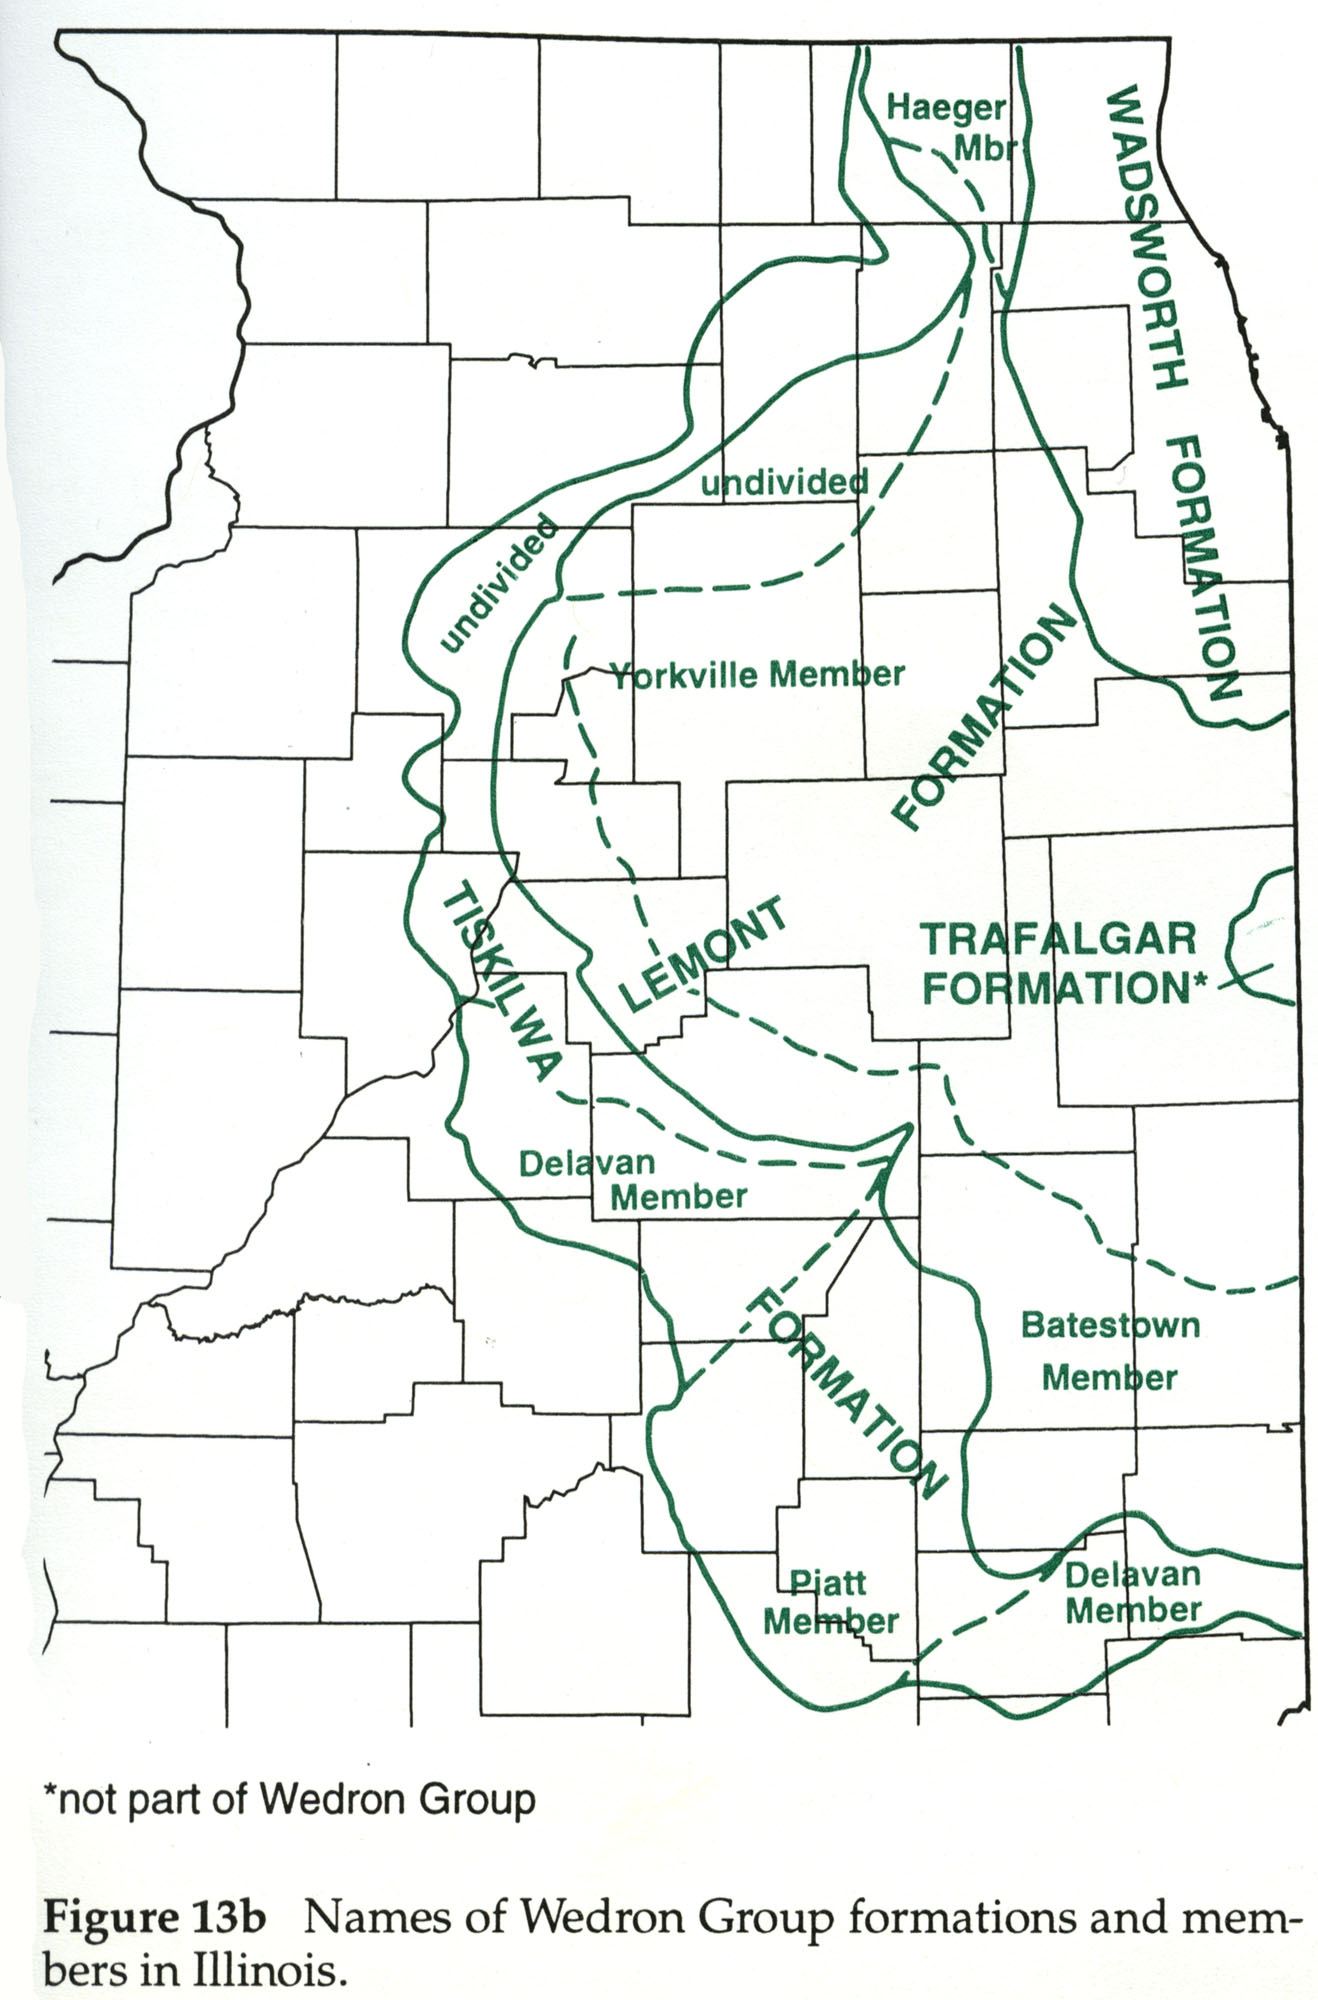
| 16:42, 19 April 2016 | 104-Figure 13b.jpg (file) |  |
309 KB | Illex-gron | Figure 13b -- Names of Wedron Group formations and members in Illinois. | 1 |
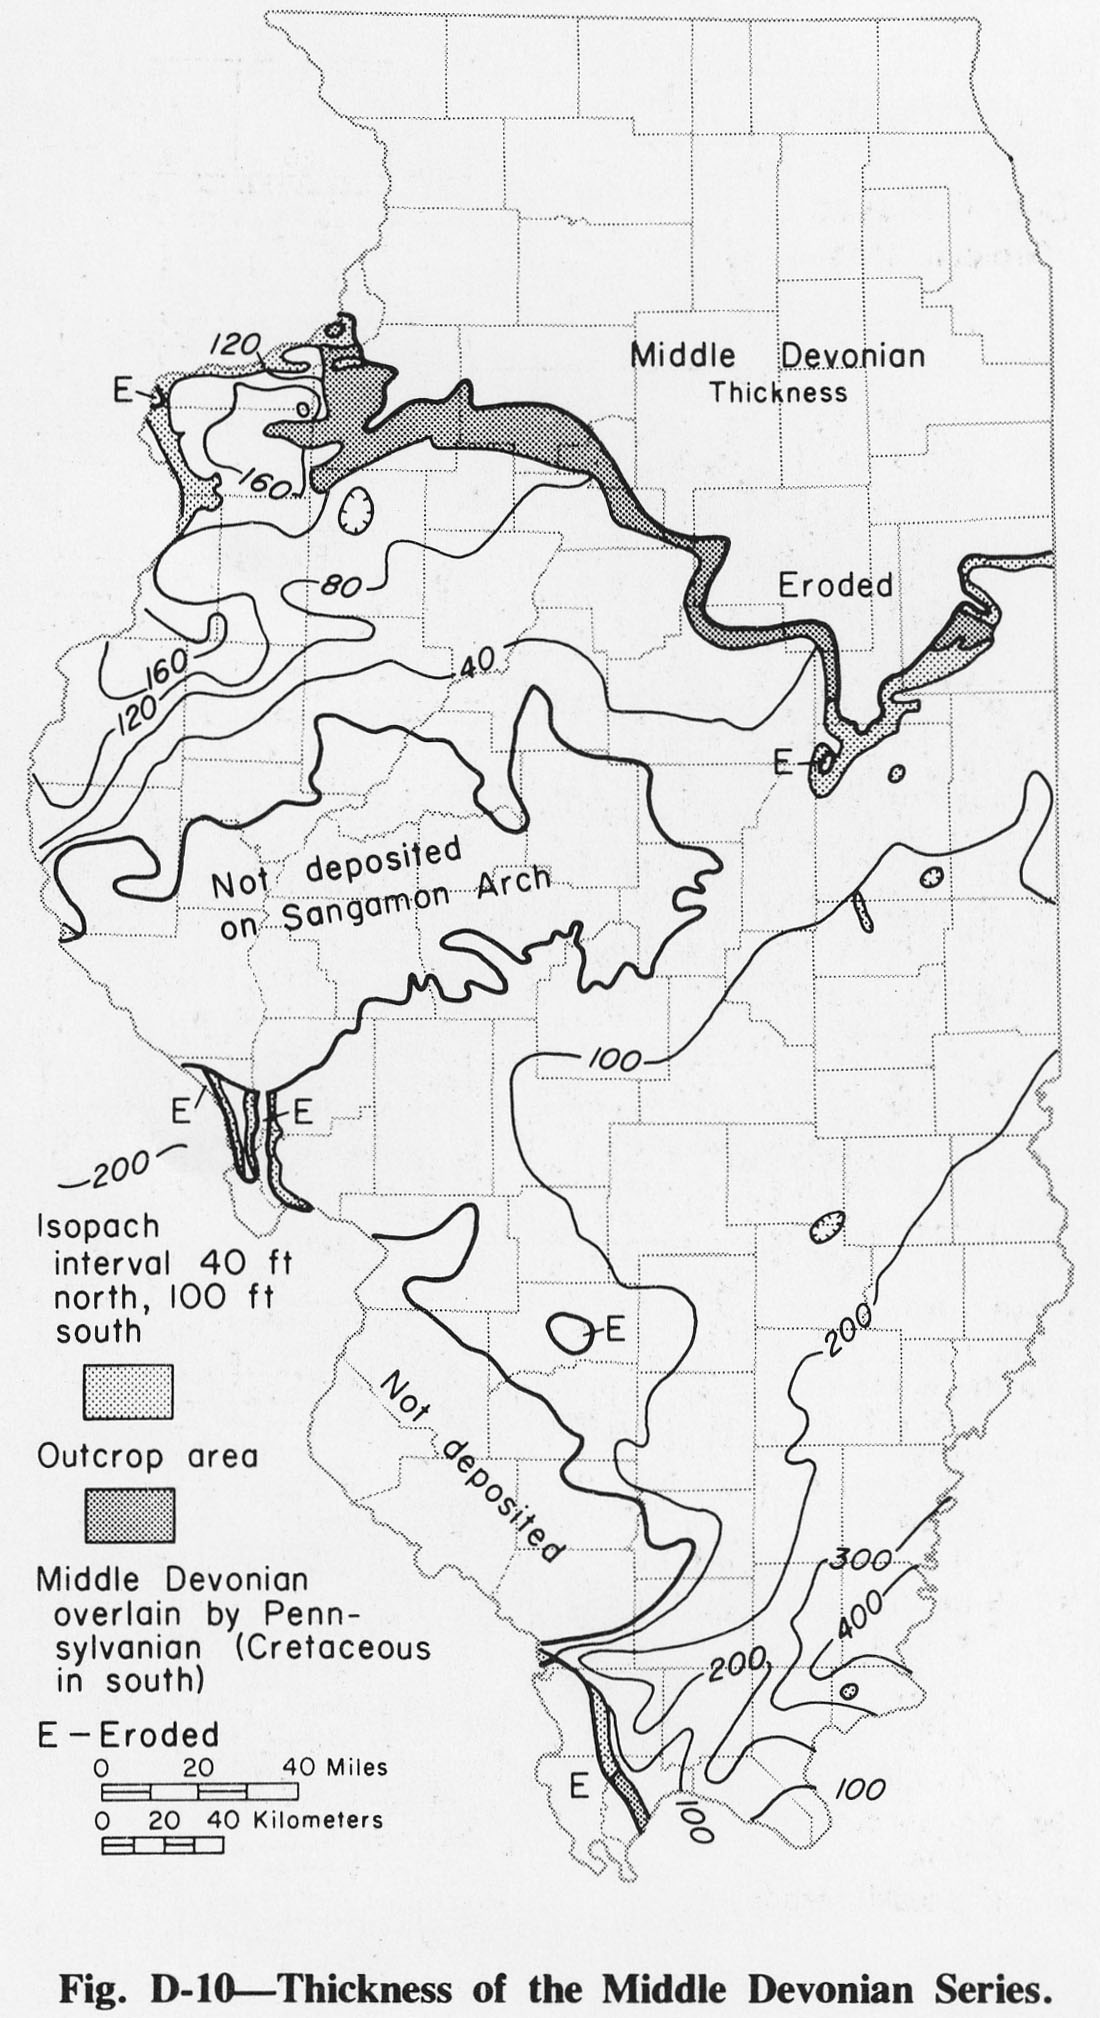
| 20:04, 1 April 2016 | Figure D-10.jpg (file) |  |
318 KB | Alan.Myers | Fig. D-10 -- Thickness of the Middle Devonian Series. | 1 |
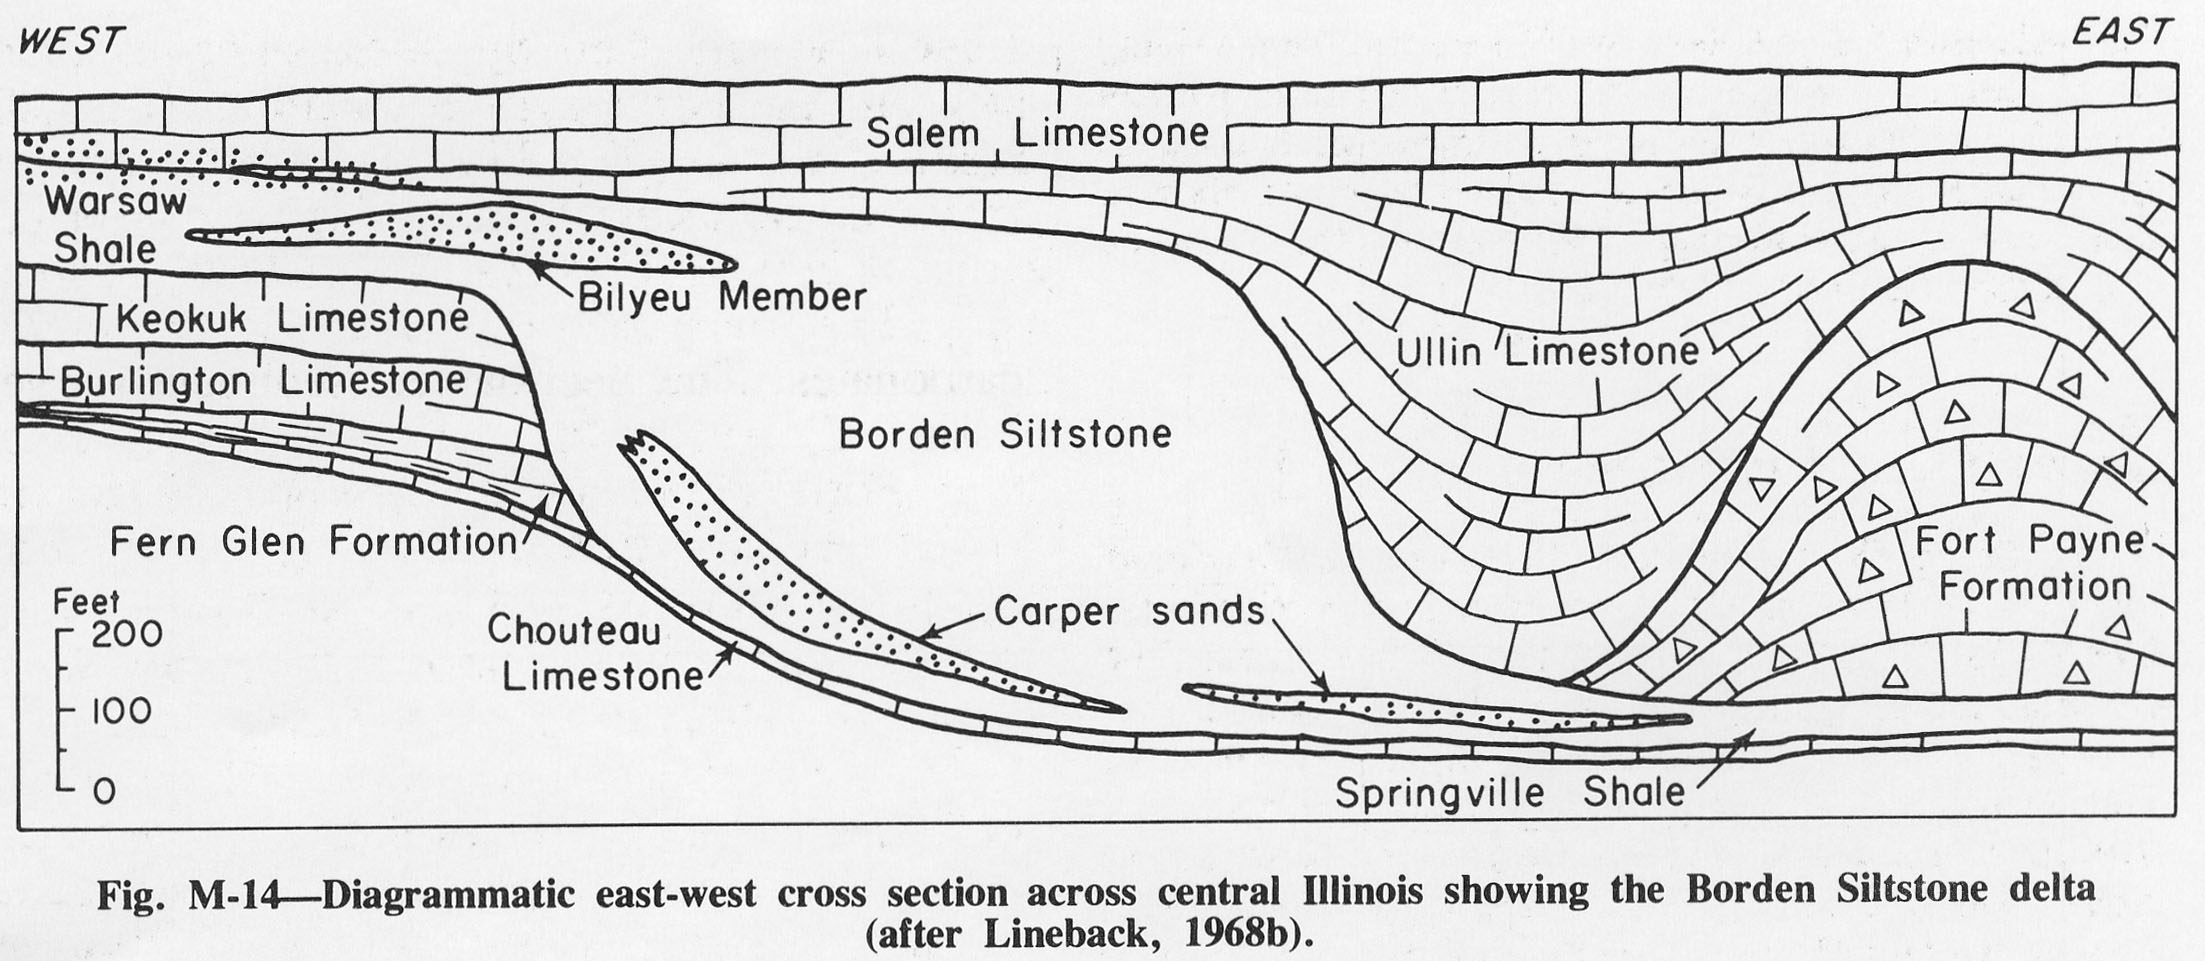
| 13:58, 4 April 2016 | Figure M-14.jpg (file) |  |
319 KB | Alan.Myers | Fig. M-14 -- Diagrammatic east-west cross section across central Illinois showing the Borden Siltstone delta (after Lineback, 1968b). | 1 |
| 17:54, 4 April 2016 | Figure S-8.jpg (file) |  |
319 KB | Alan.Myers | Fig. S-8 -- Development of the classification of the Silurian System in northwestern Illinois. | 1 |
| 14:12, 9 July 2020 | C605-Figure-07.jpg (file) |  |
320 KB | Alan.Myers | 1 | |
| 15:42, 1 April 2016 | Figure P-16.jpg (file) |  |
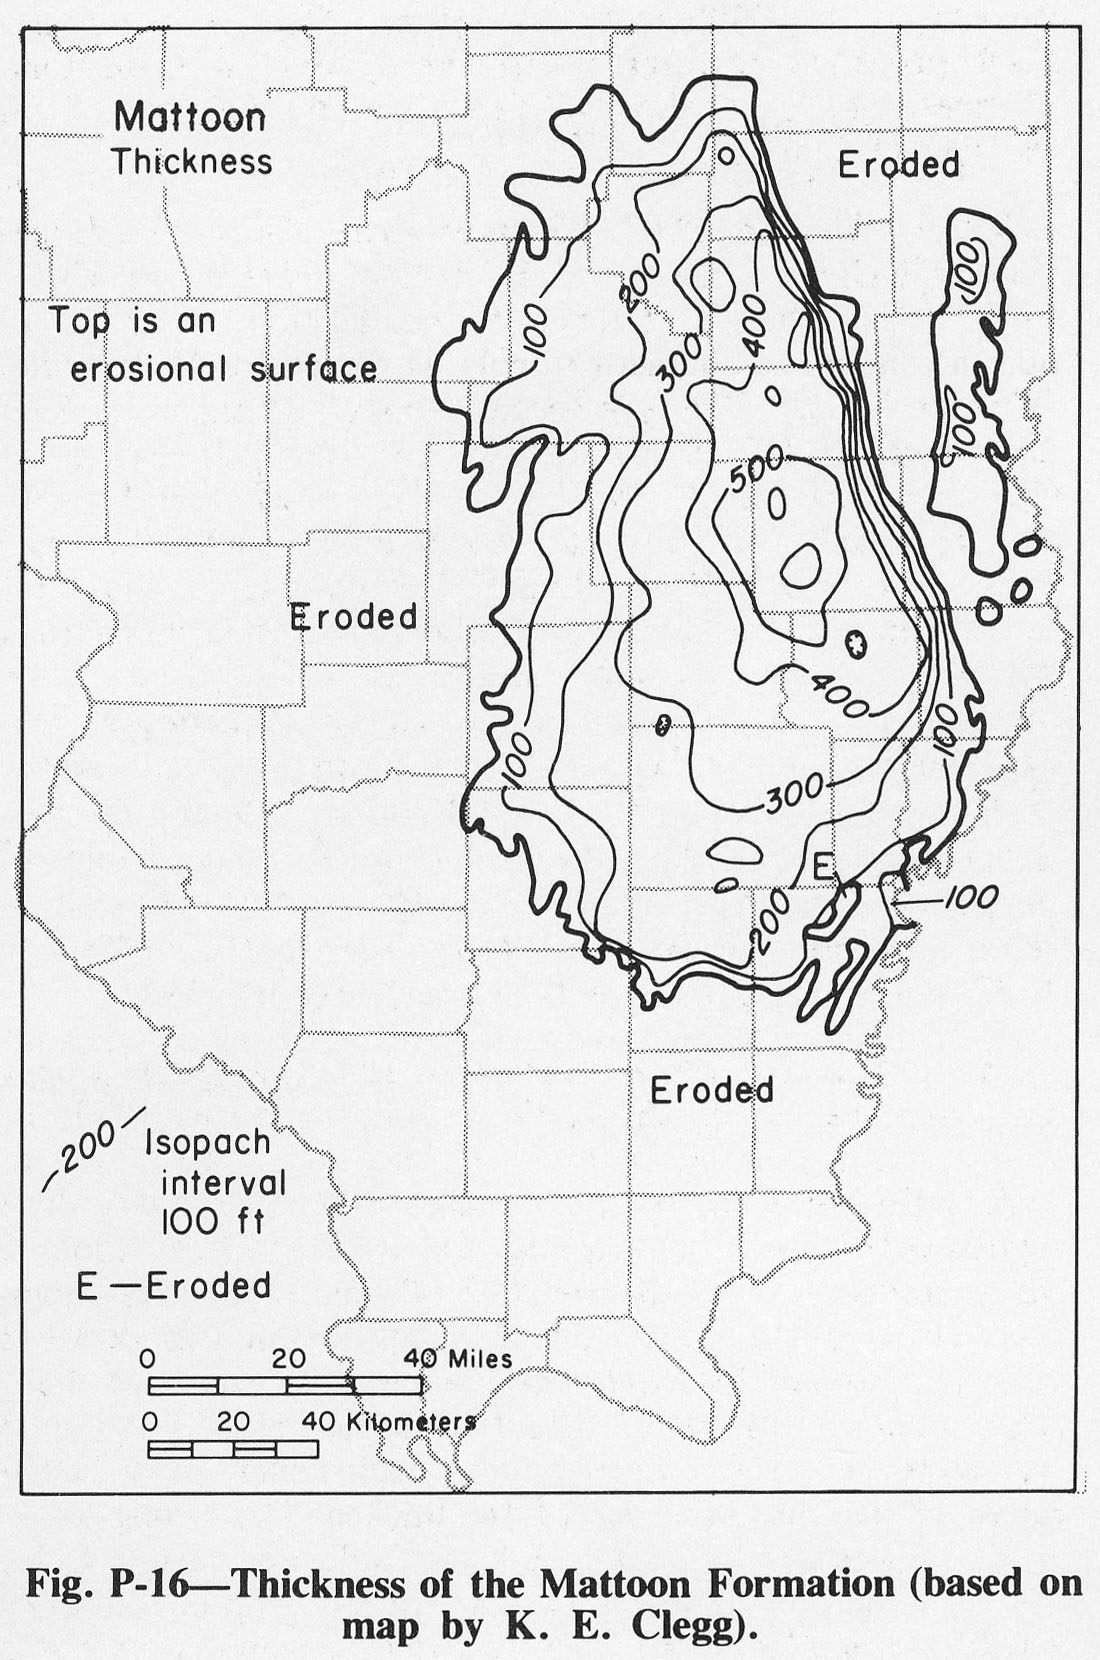
320 KB | Illex-gron | Fig. P-16 -- Thickness of the Mattoon Formation (based on map by K. E. Clegg). | 1 |
| 19:41, 1 April 2016 | Figure C-2.jpg (file) |  |
321 KB | Alan.Myers | Fig. C-2 --Thickness of the Cambrian System. The dashed lines show reconstructed thickness. | 1 |
| 15:46, 11 July 2020 | C605-Figure-48.jpg (file) |  |
321 KB | Alan.Myers | 1 | |
| 15:37, 11 July 2020 | C605-Figure-44.jpg (file) |  |
322 KB | Alan.Myers | 1 | |
| 18:00, 4 April 2016 | Figure S-15.jpg (file) |  |
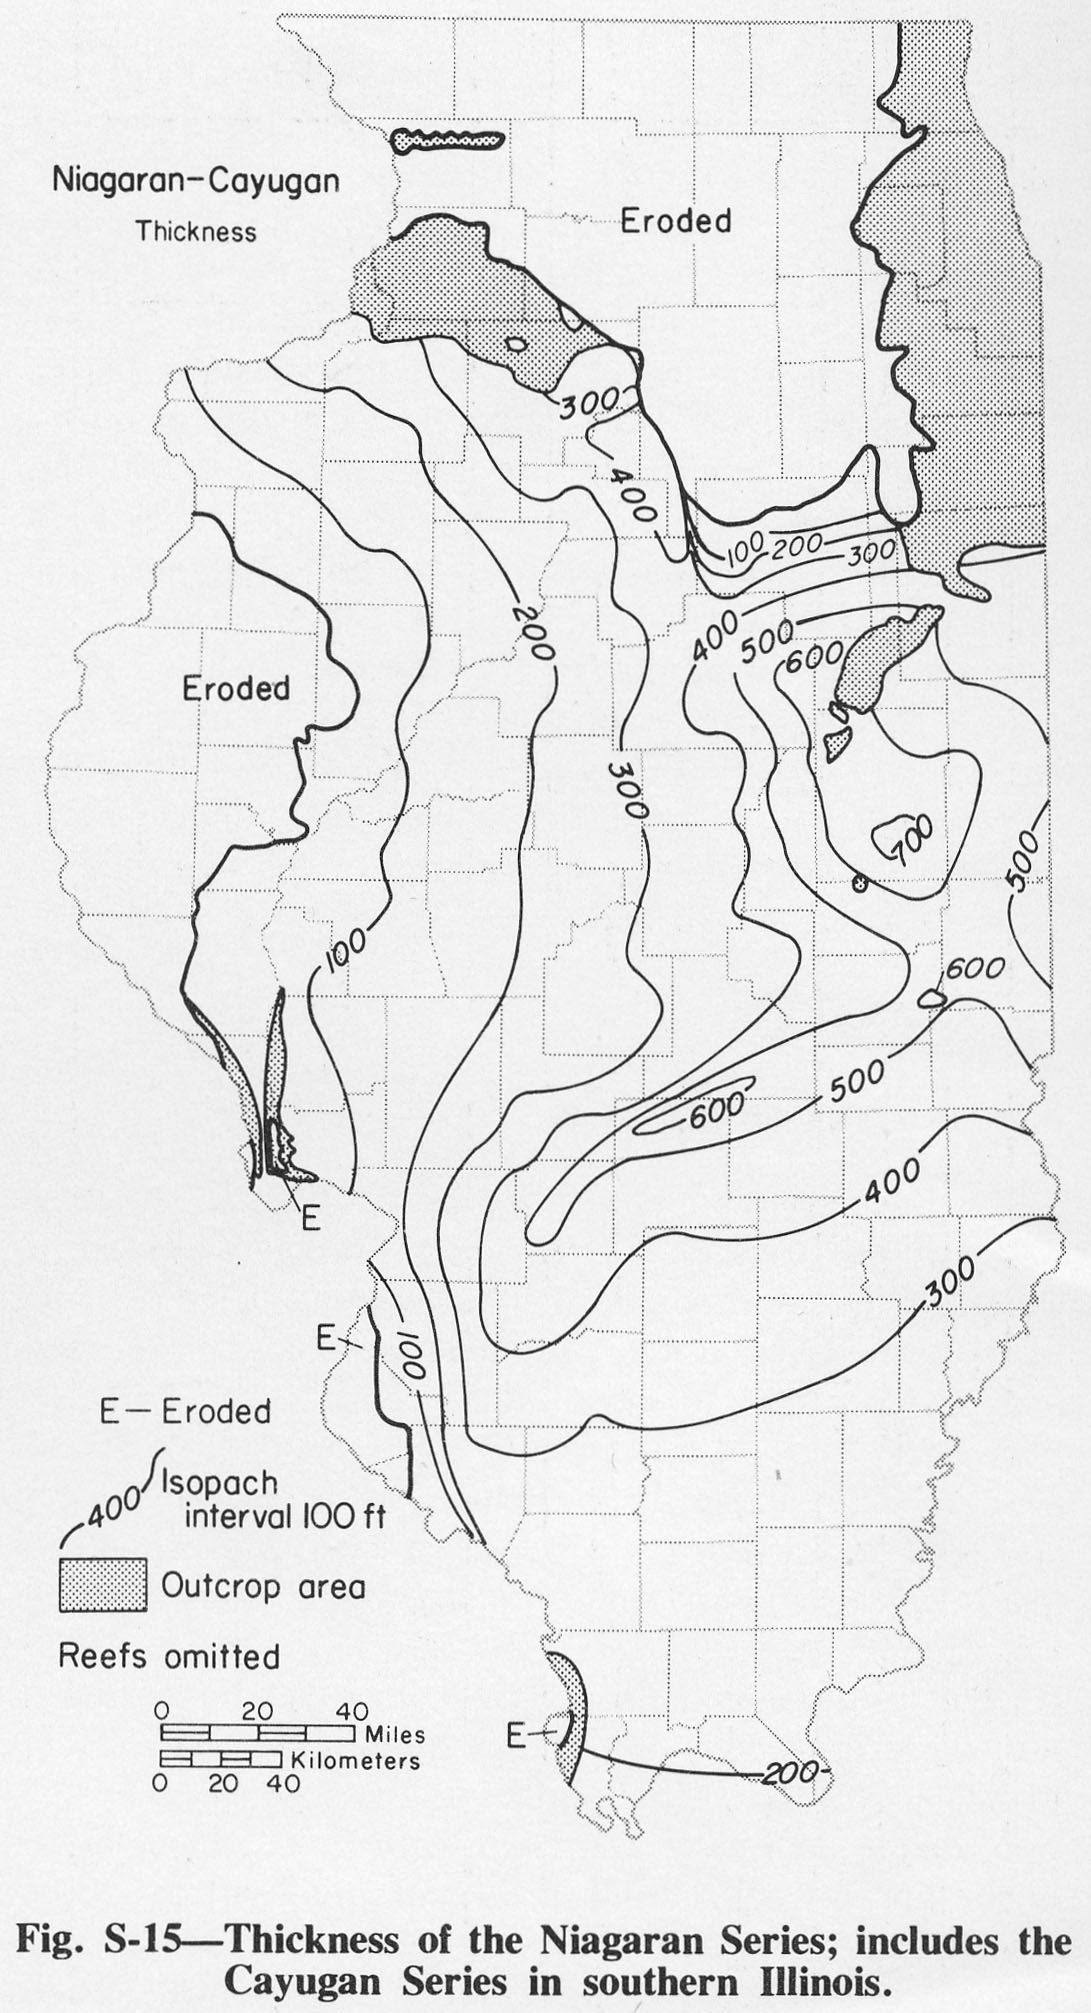
322 KB | Alan.Myers | Fig. S-15 -- Thickness of teh Niagaran Series; includes the Cayugan Series in southern Illinois. | 1 |
| 18:02, 4 April 2016 | Figure S-16.jpg (file) |  |
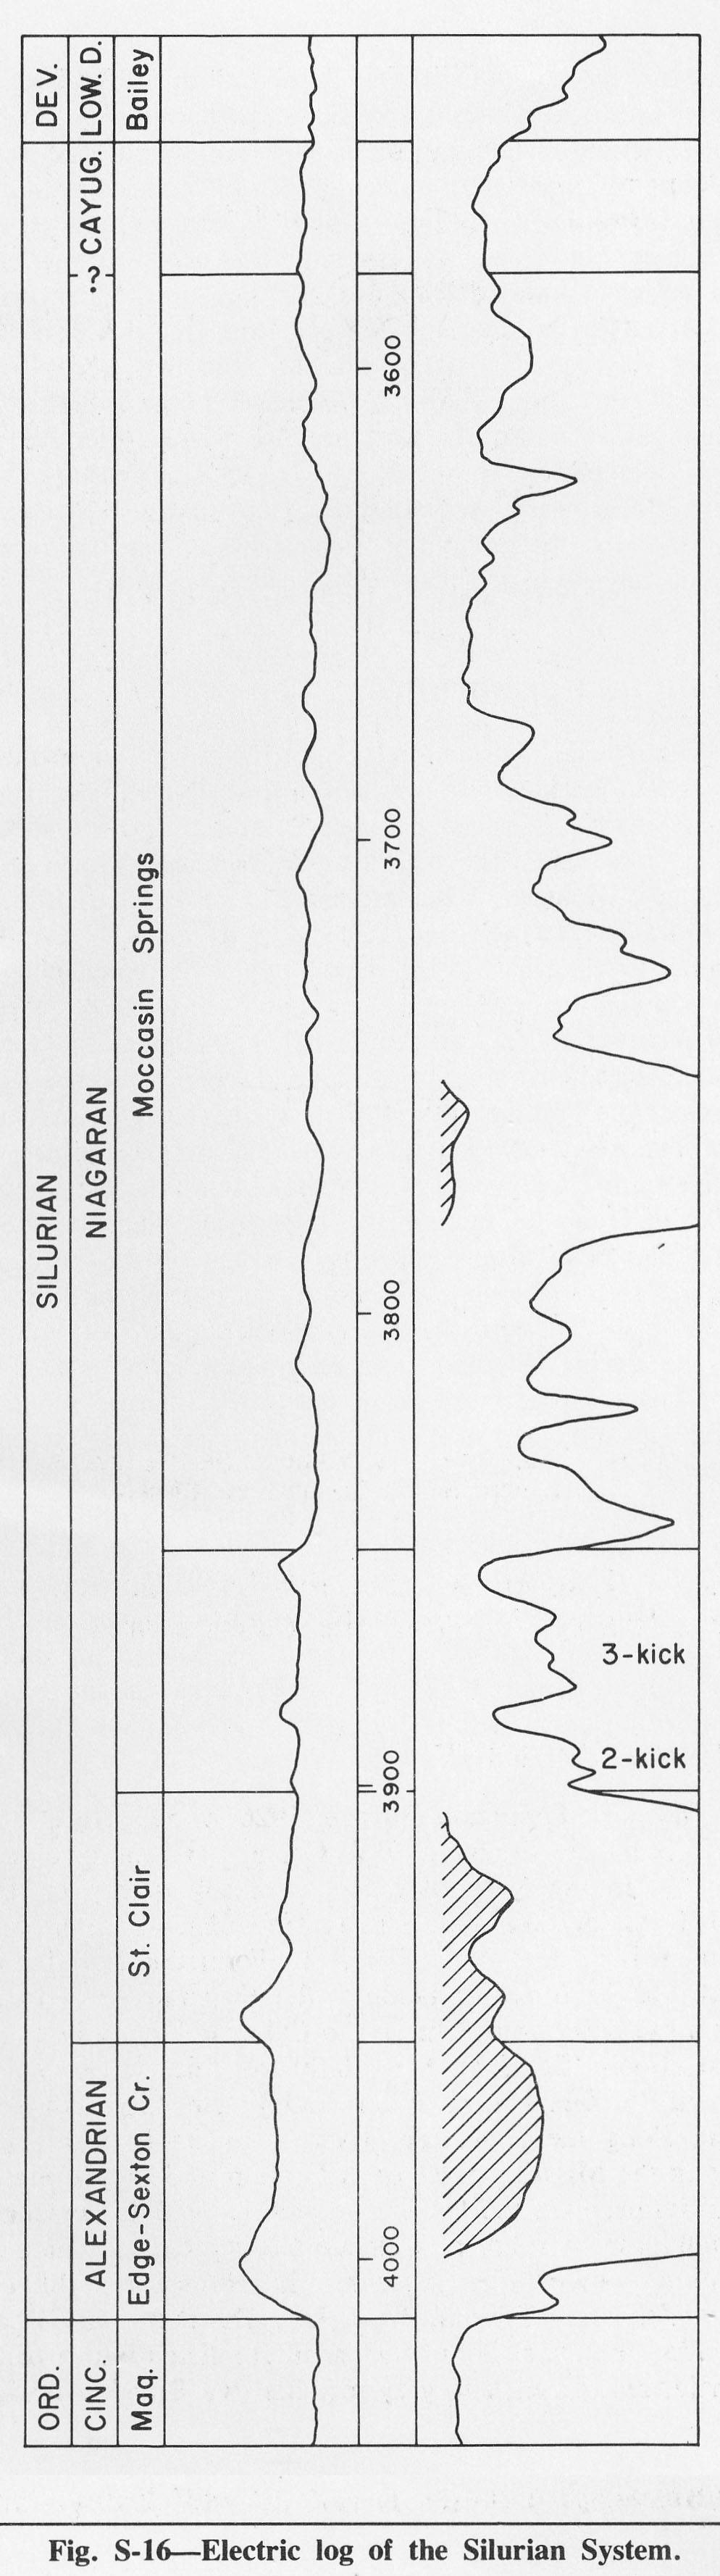
323 KB | Alan.Myers | Fig. S-16 -- Electric log of the Silurian System. | 1 |
| 13:24, 4 April 2016 | Figure M-6.jpg (file) |  |
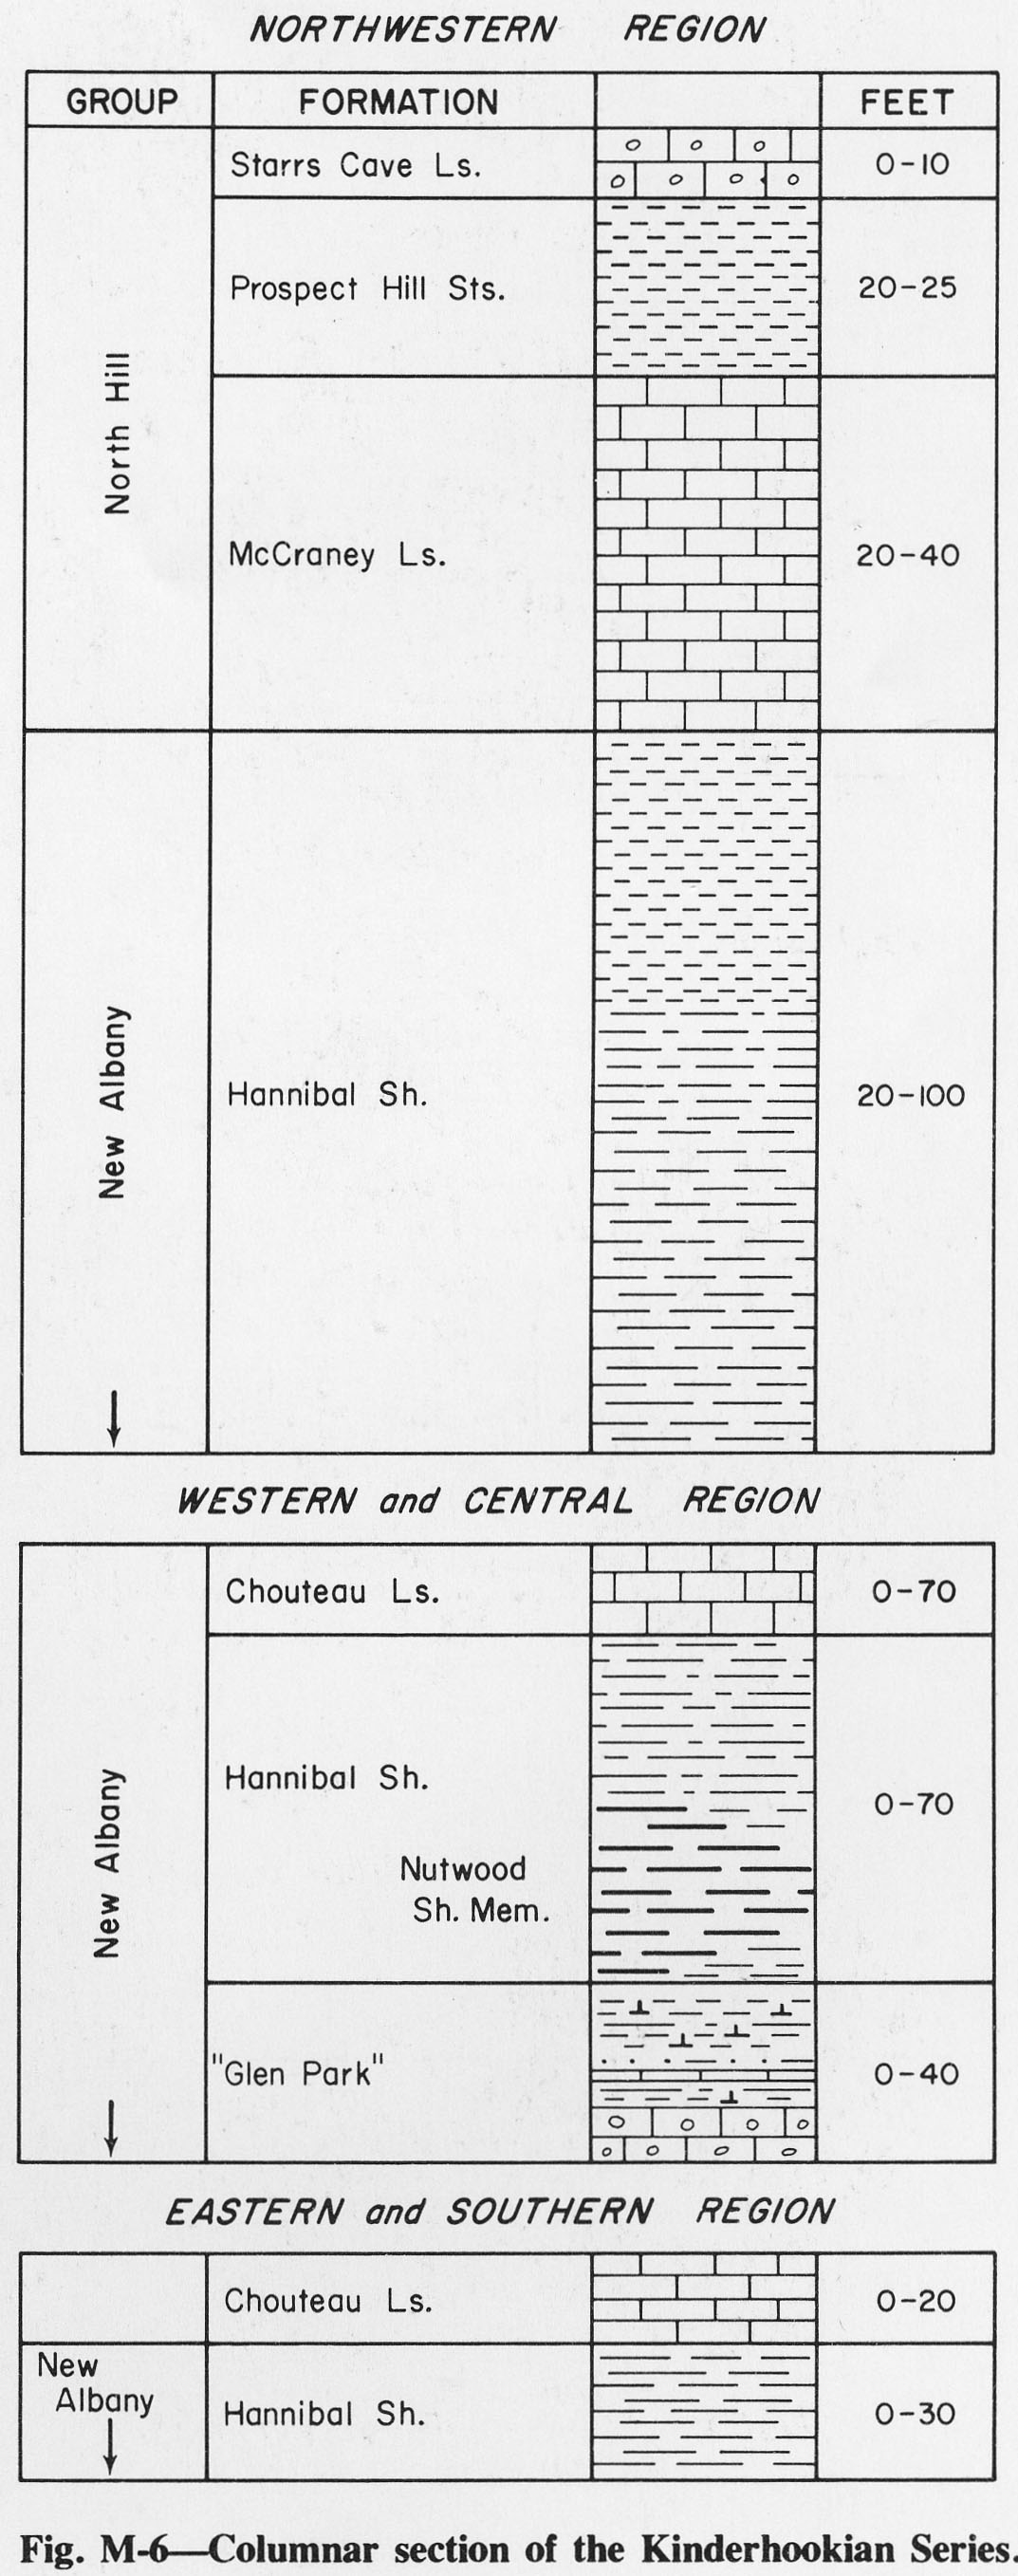
325 KB | Alan.Myers | Fig. M-6 -- Columnar section of the Kinderhookian Series. | 1 |
| 17:56, 4 April 2016 | Figure S-10.jpg (file) |  |
326 KB | Alan.Myers | Fig. S-10 -- Development of the classification of the Silurian System in southern Illinois. | 1 |
| 15:14, 4 April 2016 | Figure Pc-1.jpg (file) |  |
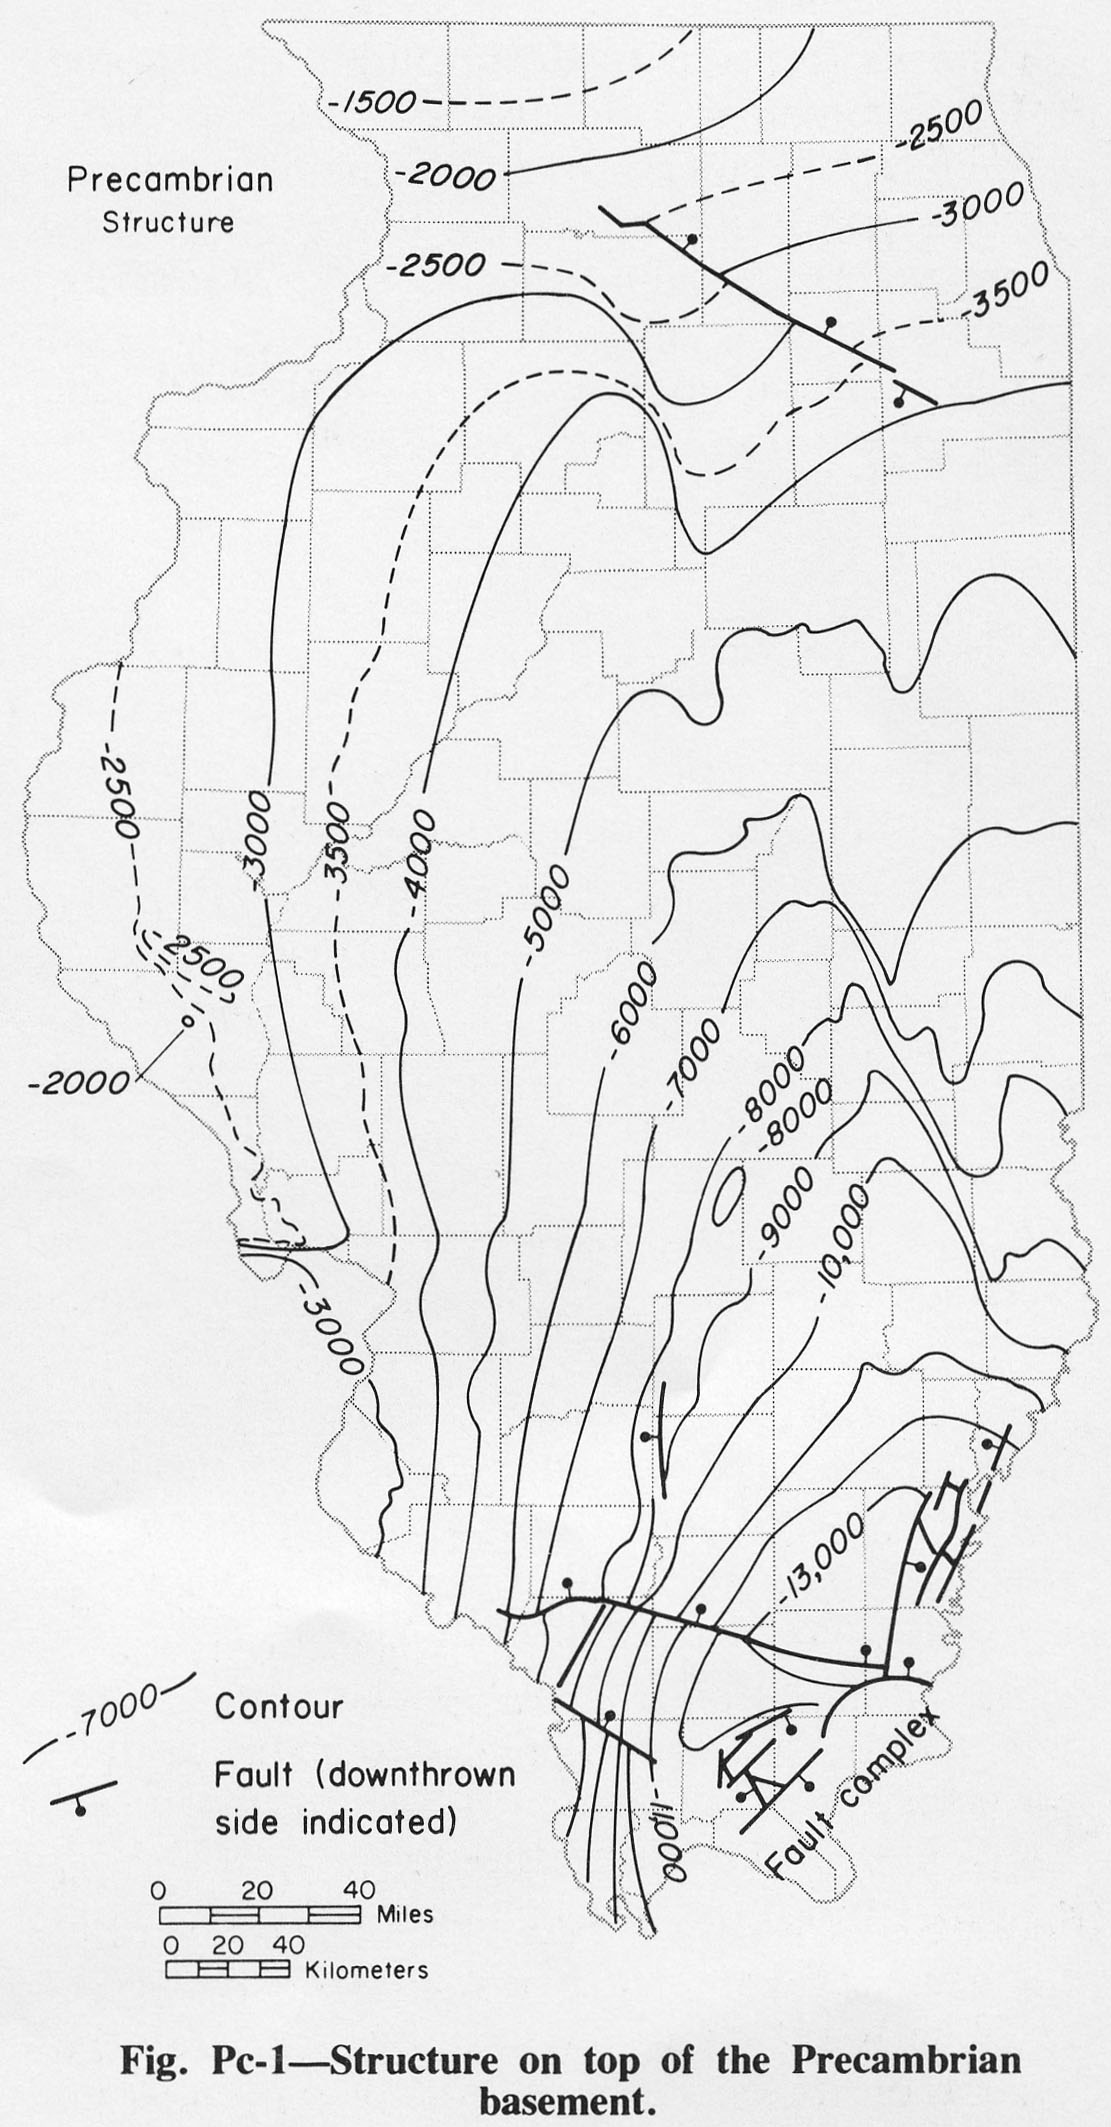
328 KB | Alan.Myers | Fig. Pc-1 -- Structure on top of the Precambrian basement. | 1 |
| 17:59, 4 April 2016 | Figure S-14.jpg (file) |  |
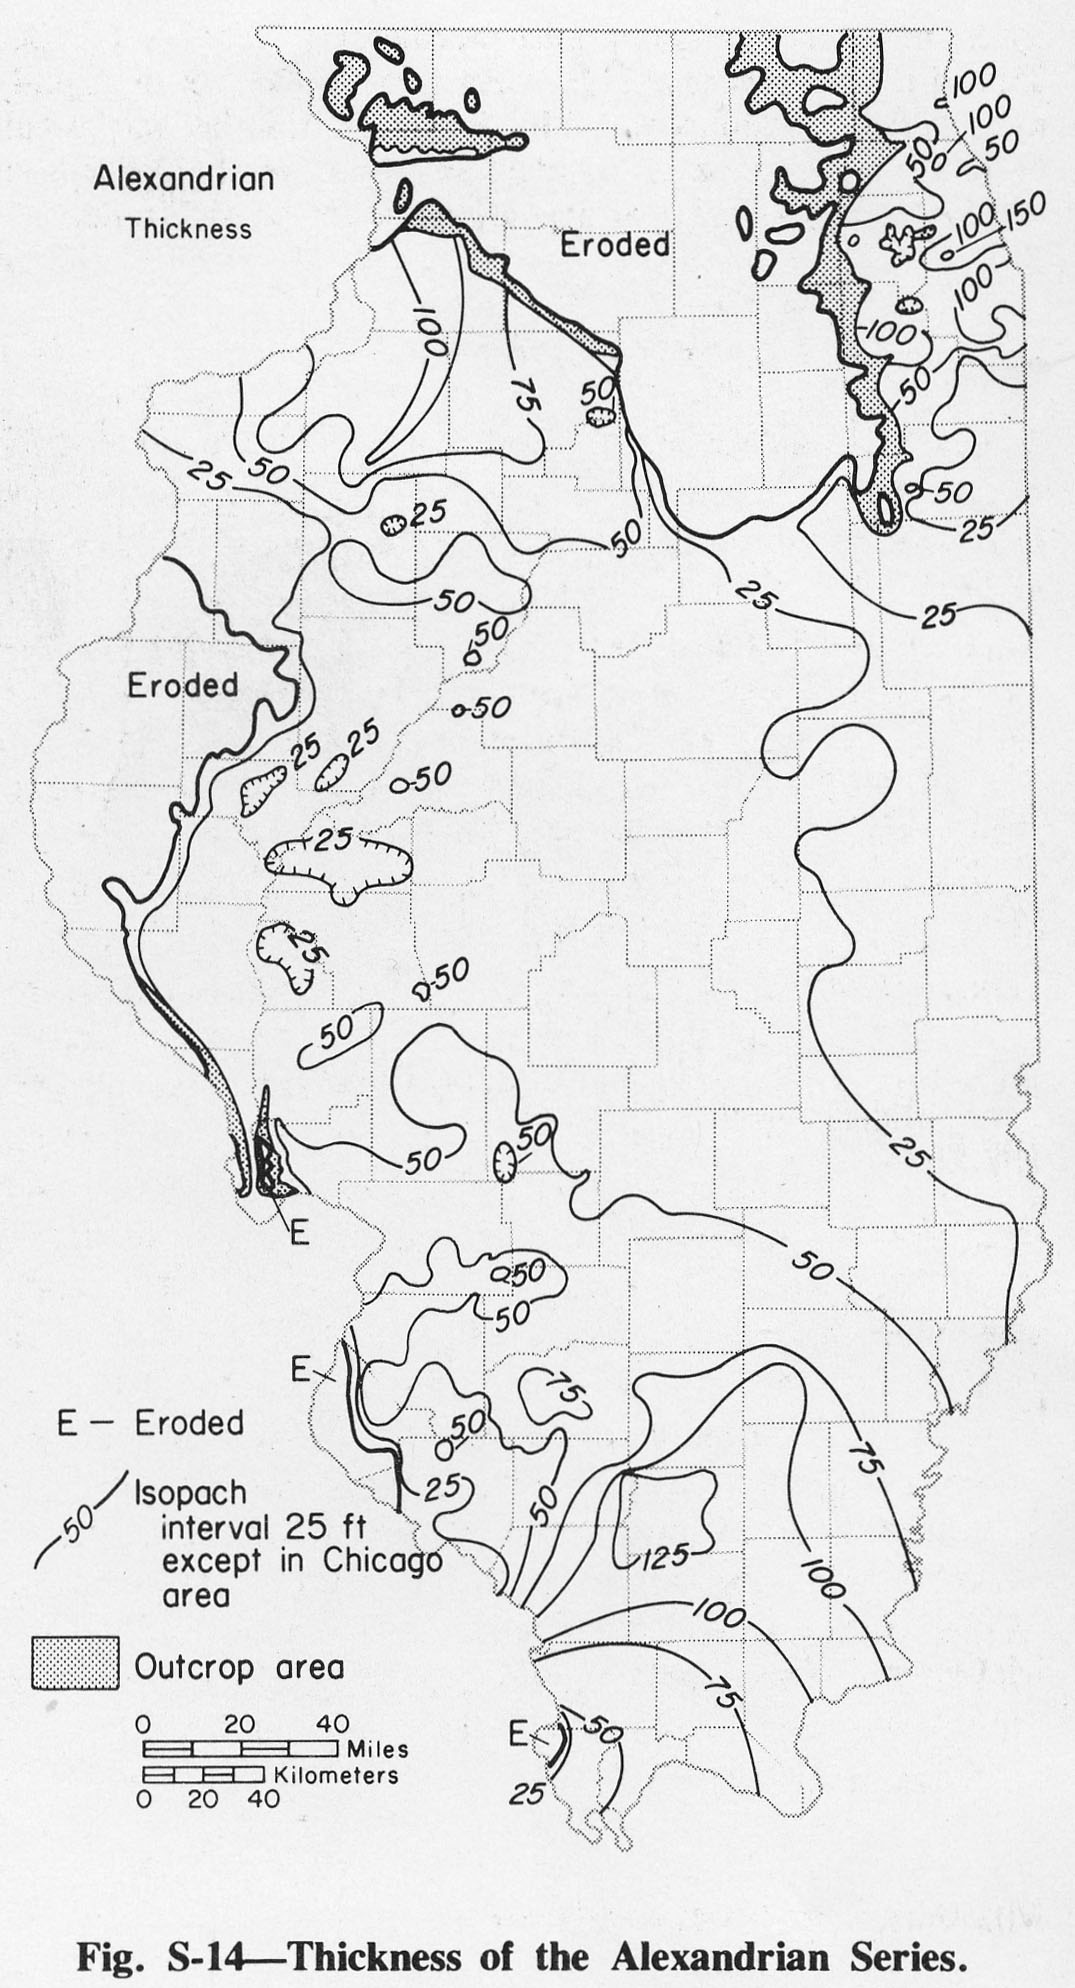
328 KB | Alan.Myers | Fig. S-14 -- Thickness of the Alexandrian Series. | 1 |
| 17:53, 4 April 2016 | Figure S-7.jpg (file) |  |
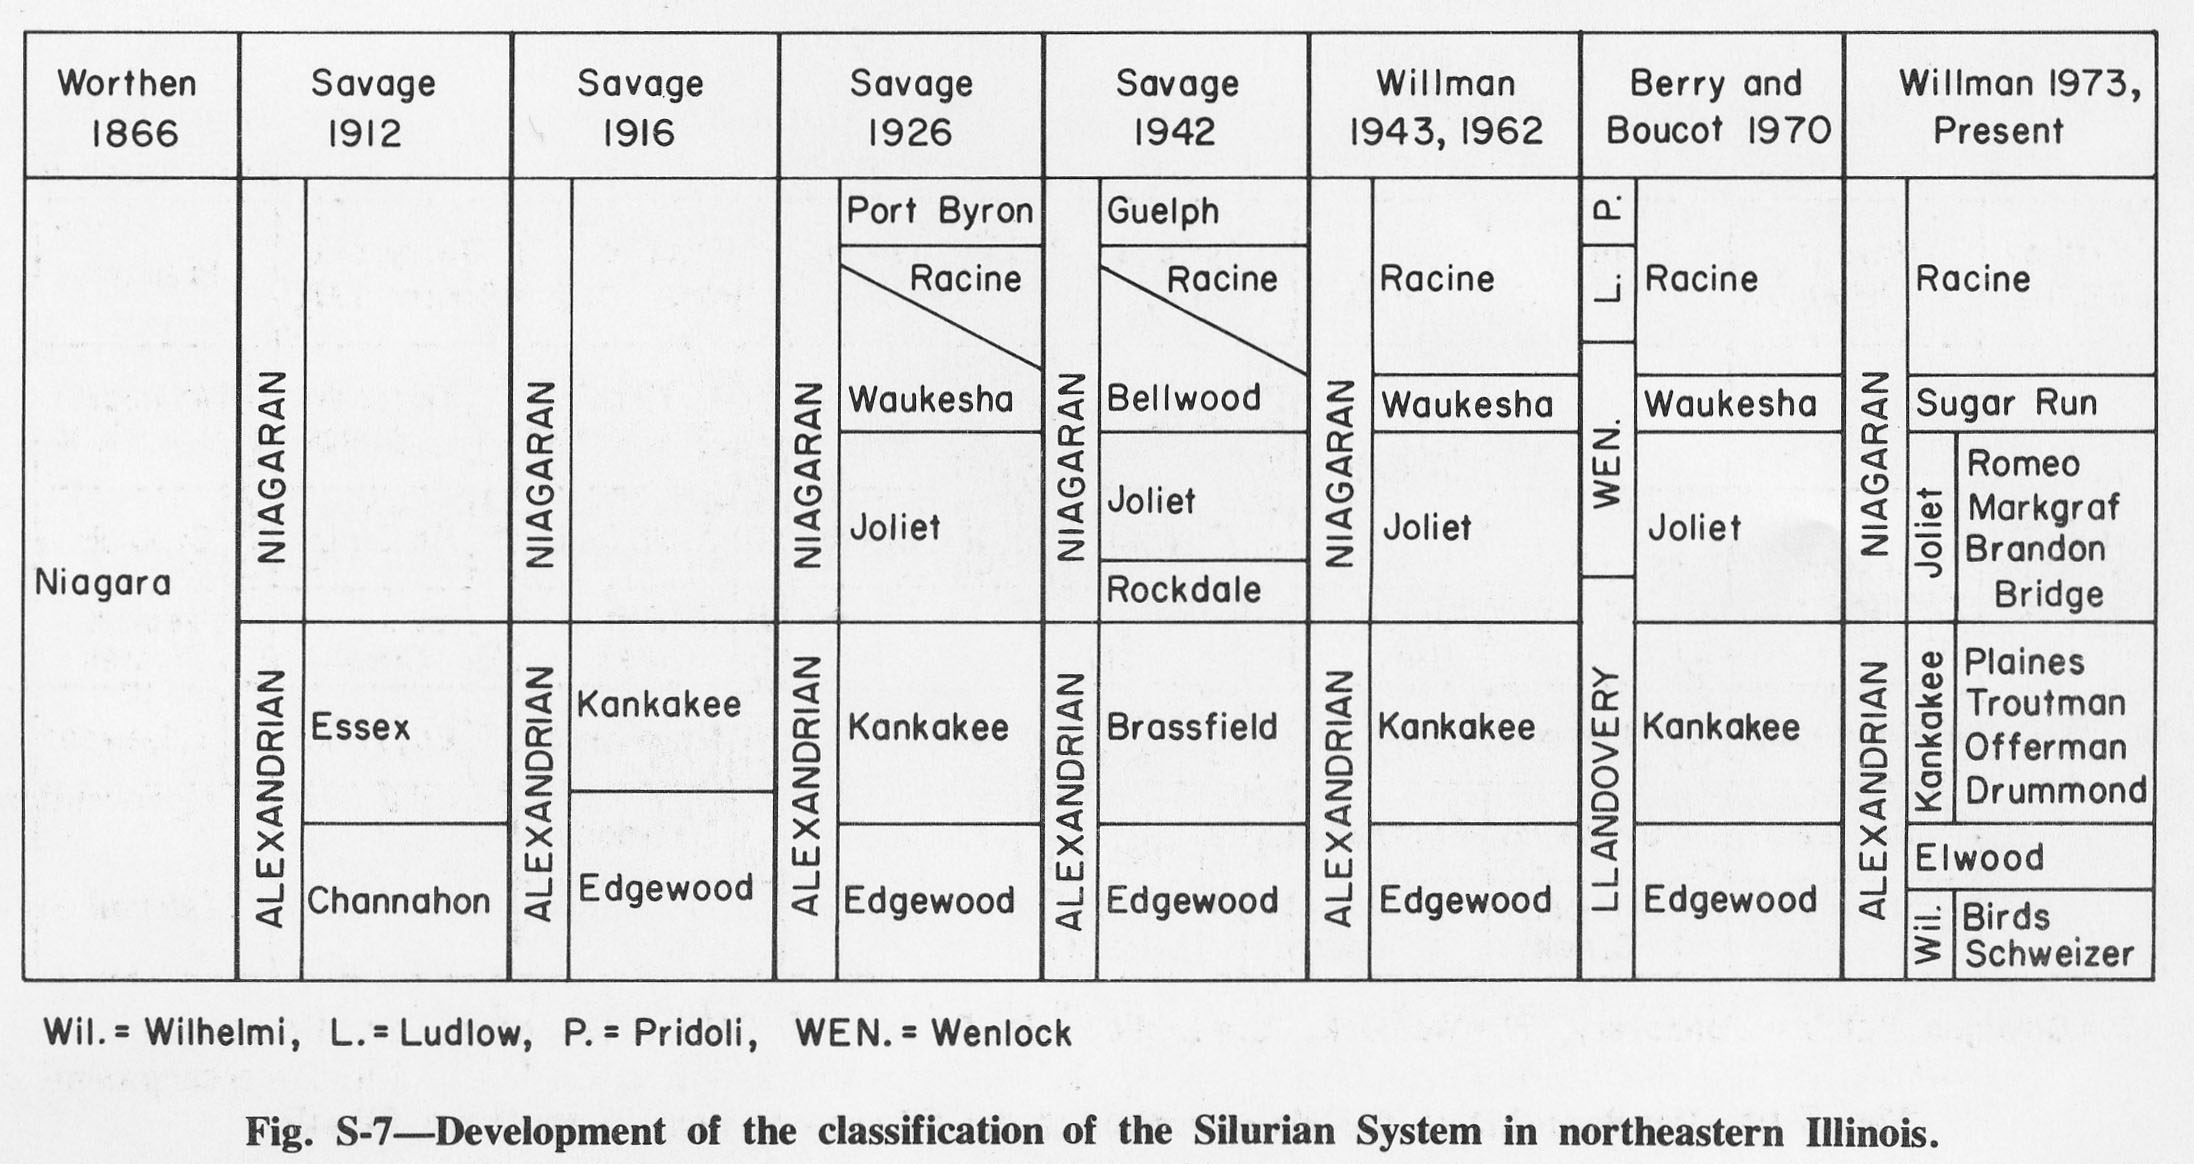
329 KB | Alan.Myers | Fig. S-7 -- Development of the classification of the Silurian System in northeastern Illinois. | 1 |
| 14:54, 4 April 2016 | Figure O-14.jpg (file) |  |
330 KB | Alan.Myers | Fig. O-14 -- Thickness of the Ottawa Limestone Megagroup. | 1 |
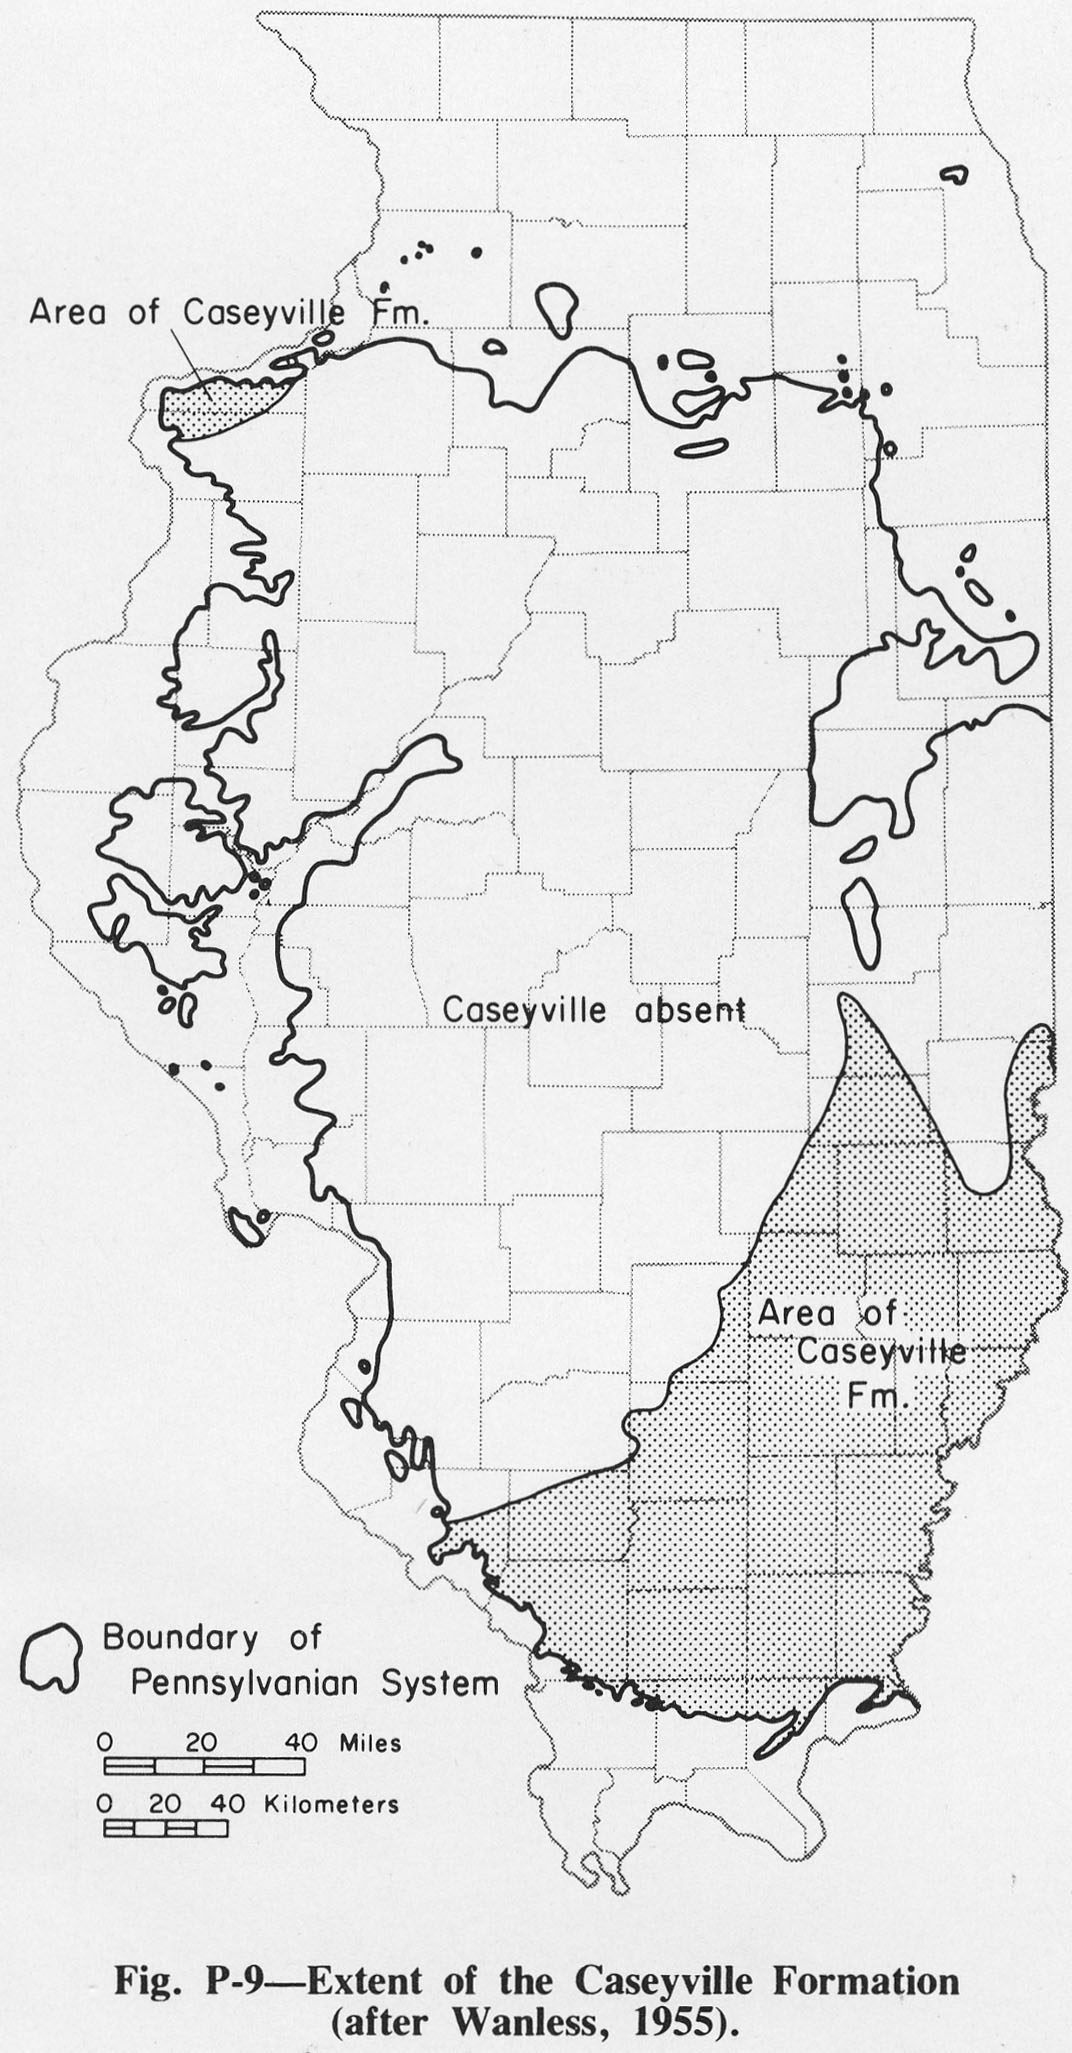
| 14:55, 1 April 2016 | Figure P-9.jpg (file) |  |
334 KB | Illex-gron | Fig. P-4 -- Extent of the Caseyville Formation (after Wanless, 1955). | 1 |
| 15:21, 9 July 2020 | C605-Figure-24.jpg (file) |  |
335 KB | Alan.Myers | 1 | |
| 16:21, 19 April 2016 | 104-Figure 7.jpg (file) |  |
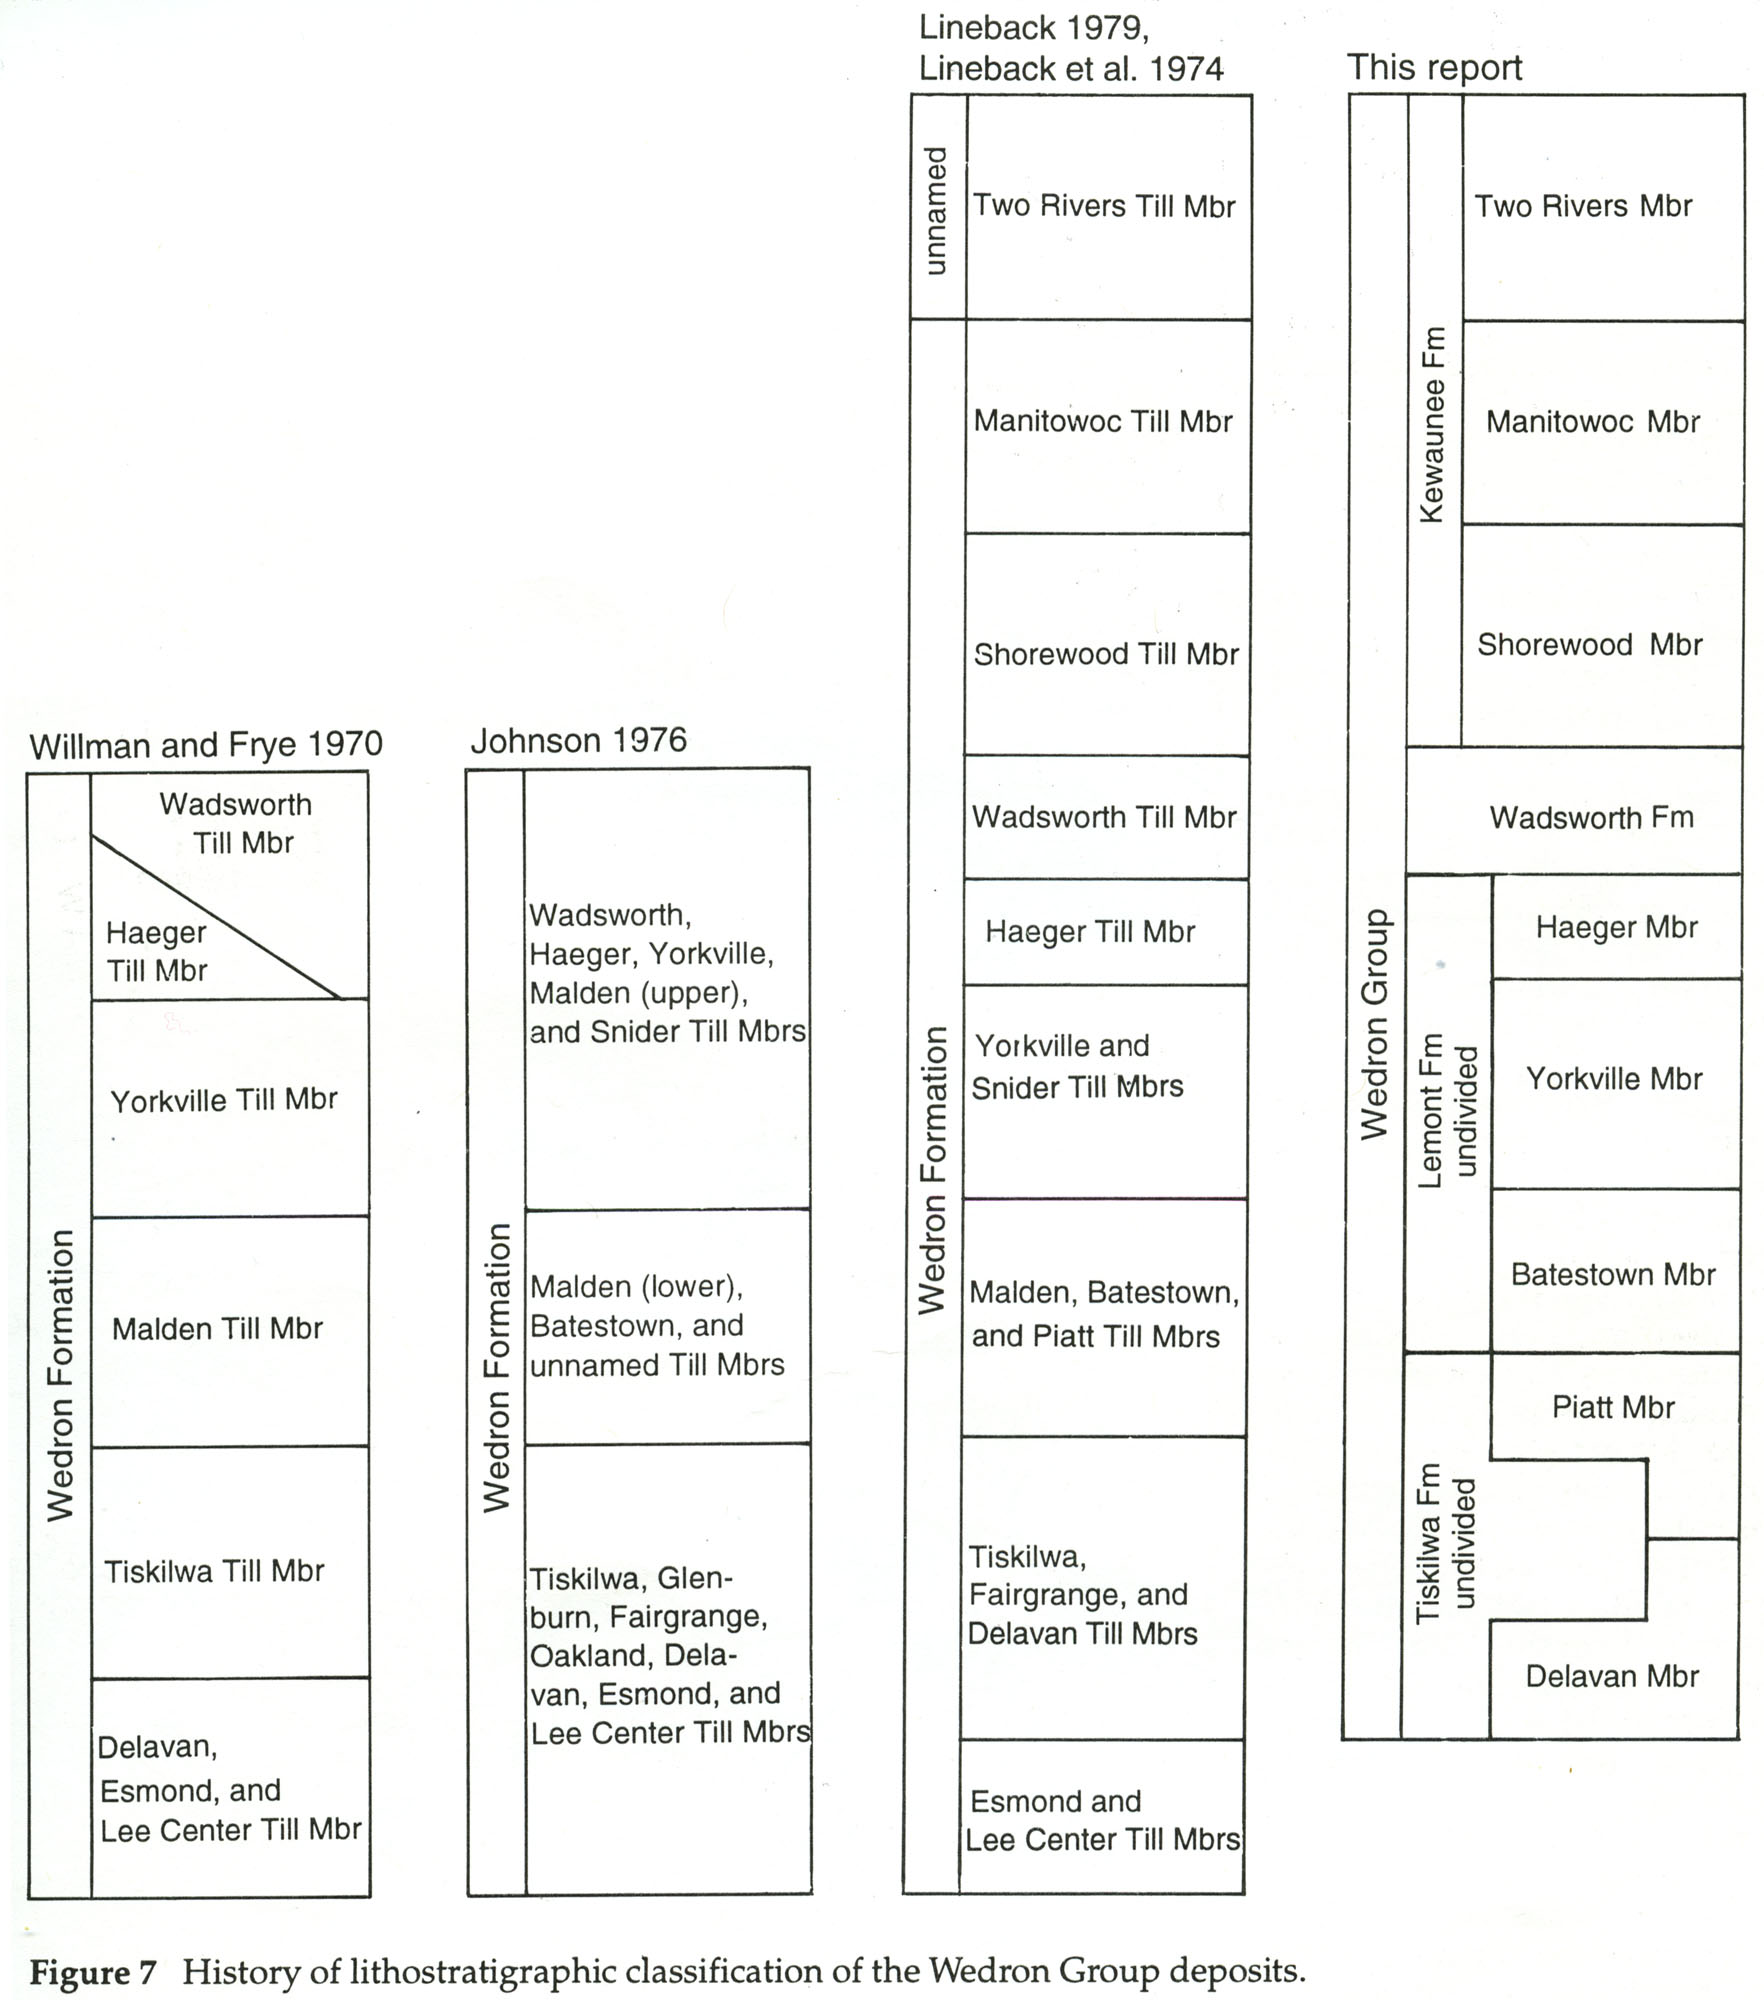
336 KB | Illex-gron | Figure 7 -- History of lithostratigraphic classification of the Wedron Group deposits. | 1 |
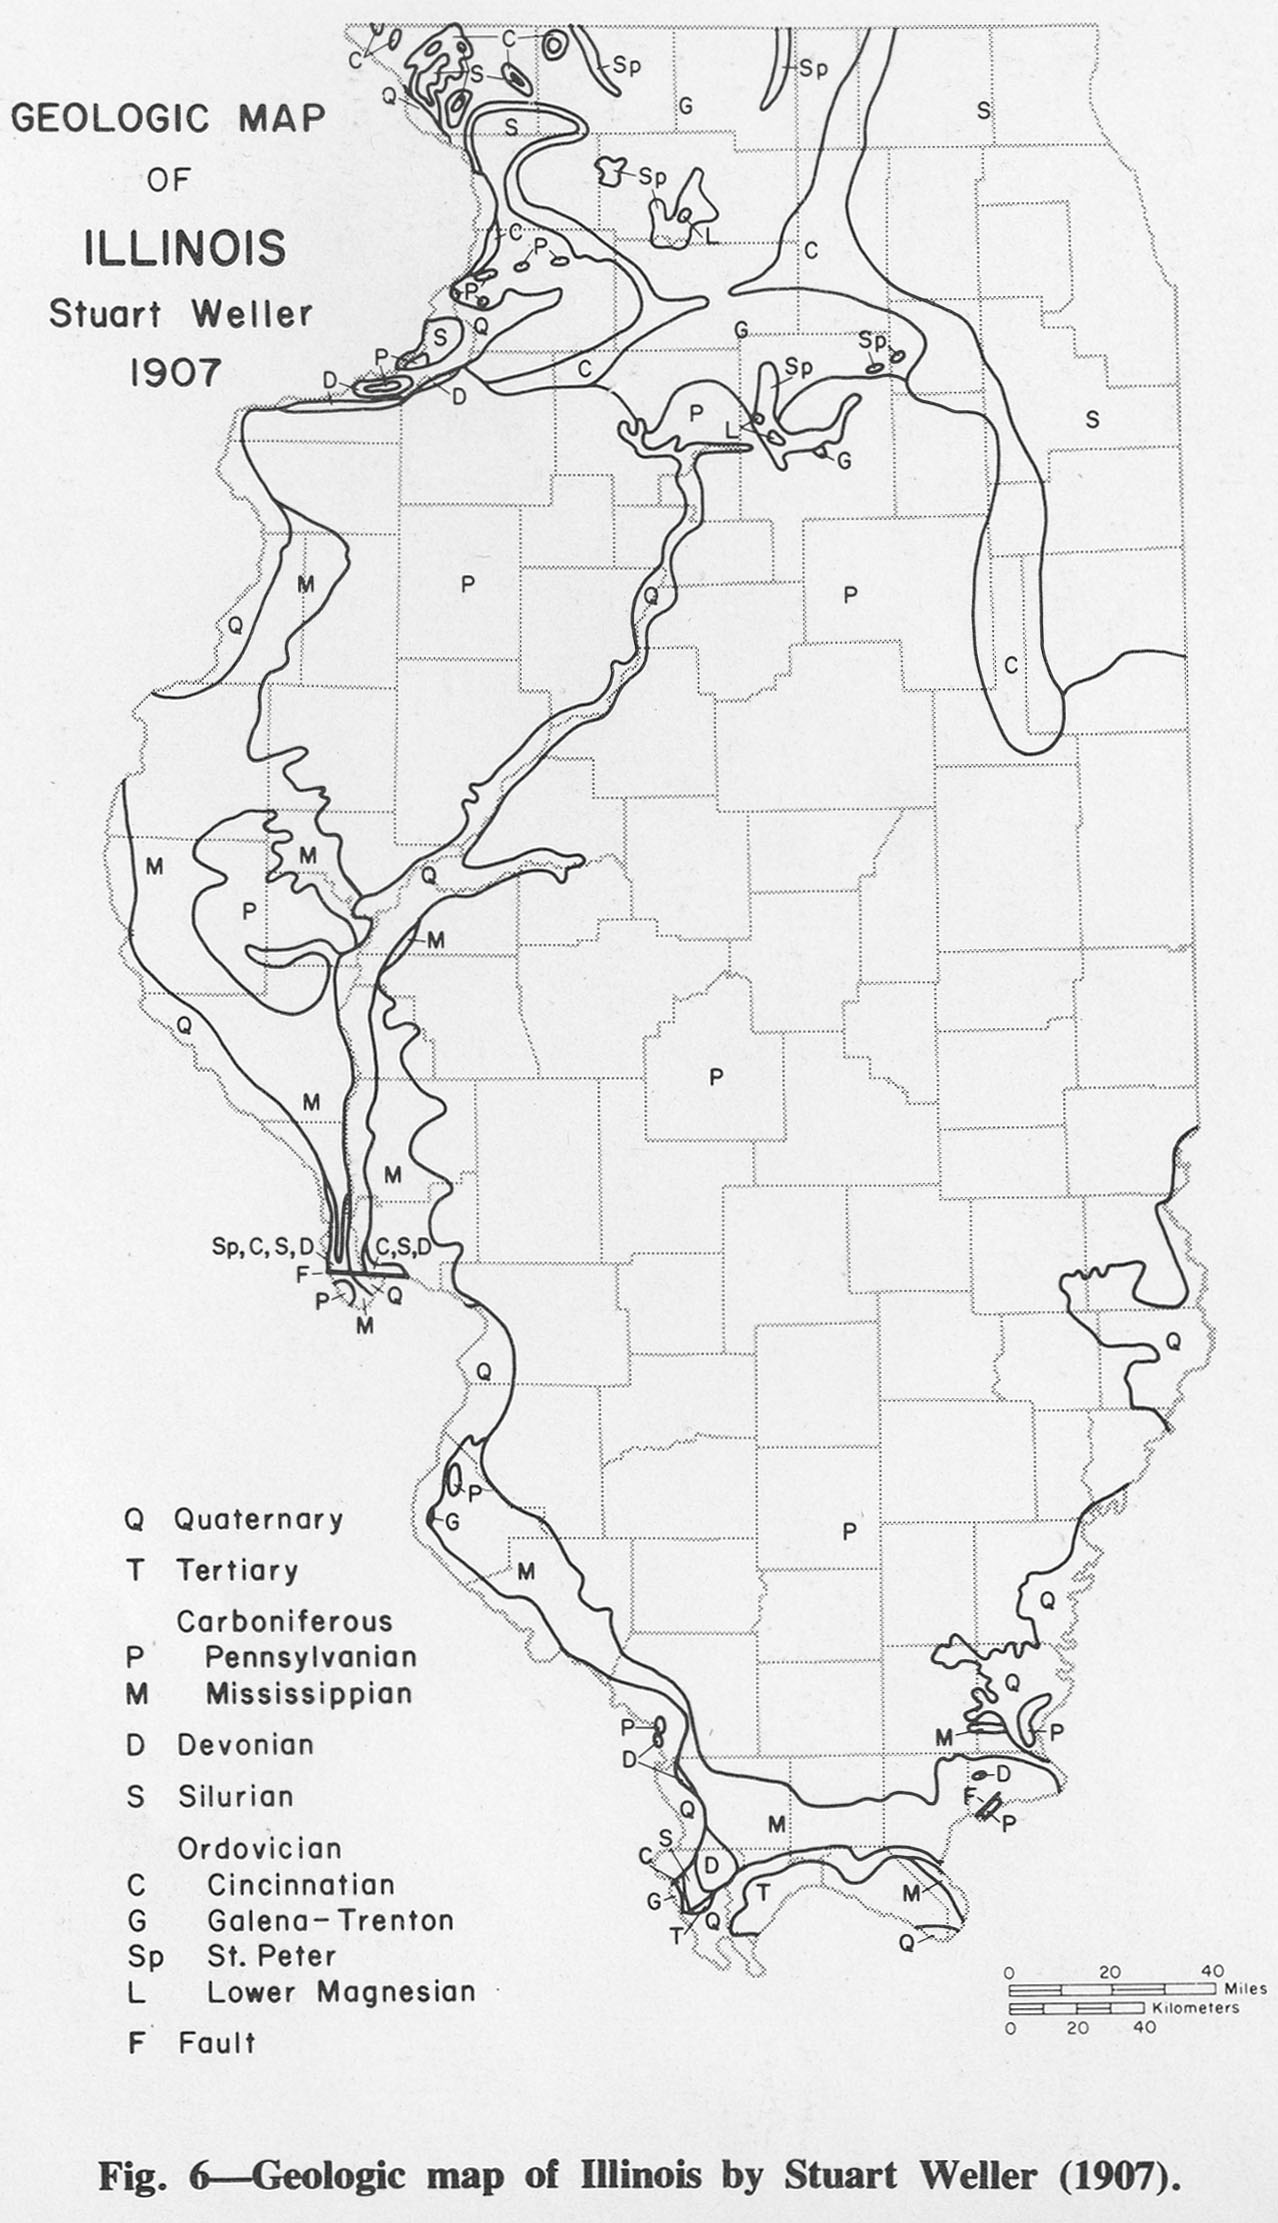
| 15:51, 1 April 2016 | Figure 6.jpg (file) |  |
344 KB | Alan.Myers | Fig. 6 -- Geologic map of Illinois by Stuart Weller (1907). | 1 |
| 17:52, 11 July 2020 | C605-Figure-59.jpg (file) |  |
345 KB | Alan.Myers | 1 | |
| 16:24, 19 April 2016 | 104-Figure 9.jpg (file) |  |
345 KB | Illex-gron | Figure 9 -- History of the litho-stratigraphic classification of the Mason Group deposits with respect to the Wedron Group deposits: (a) Peoria and Roxana Silts, (b) Henry Formation, and (c) Equality Formation. Vertical lines indicate part of section m... | 1 |
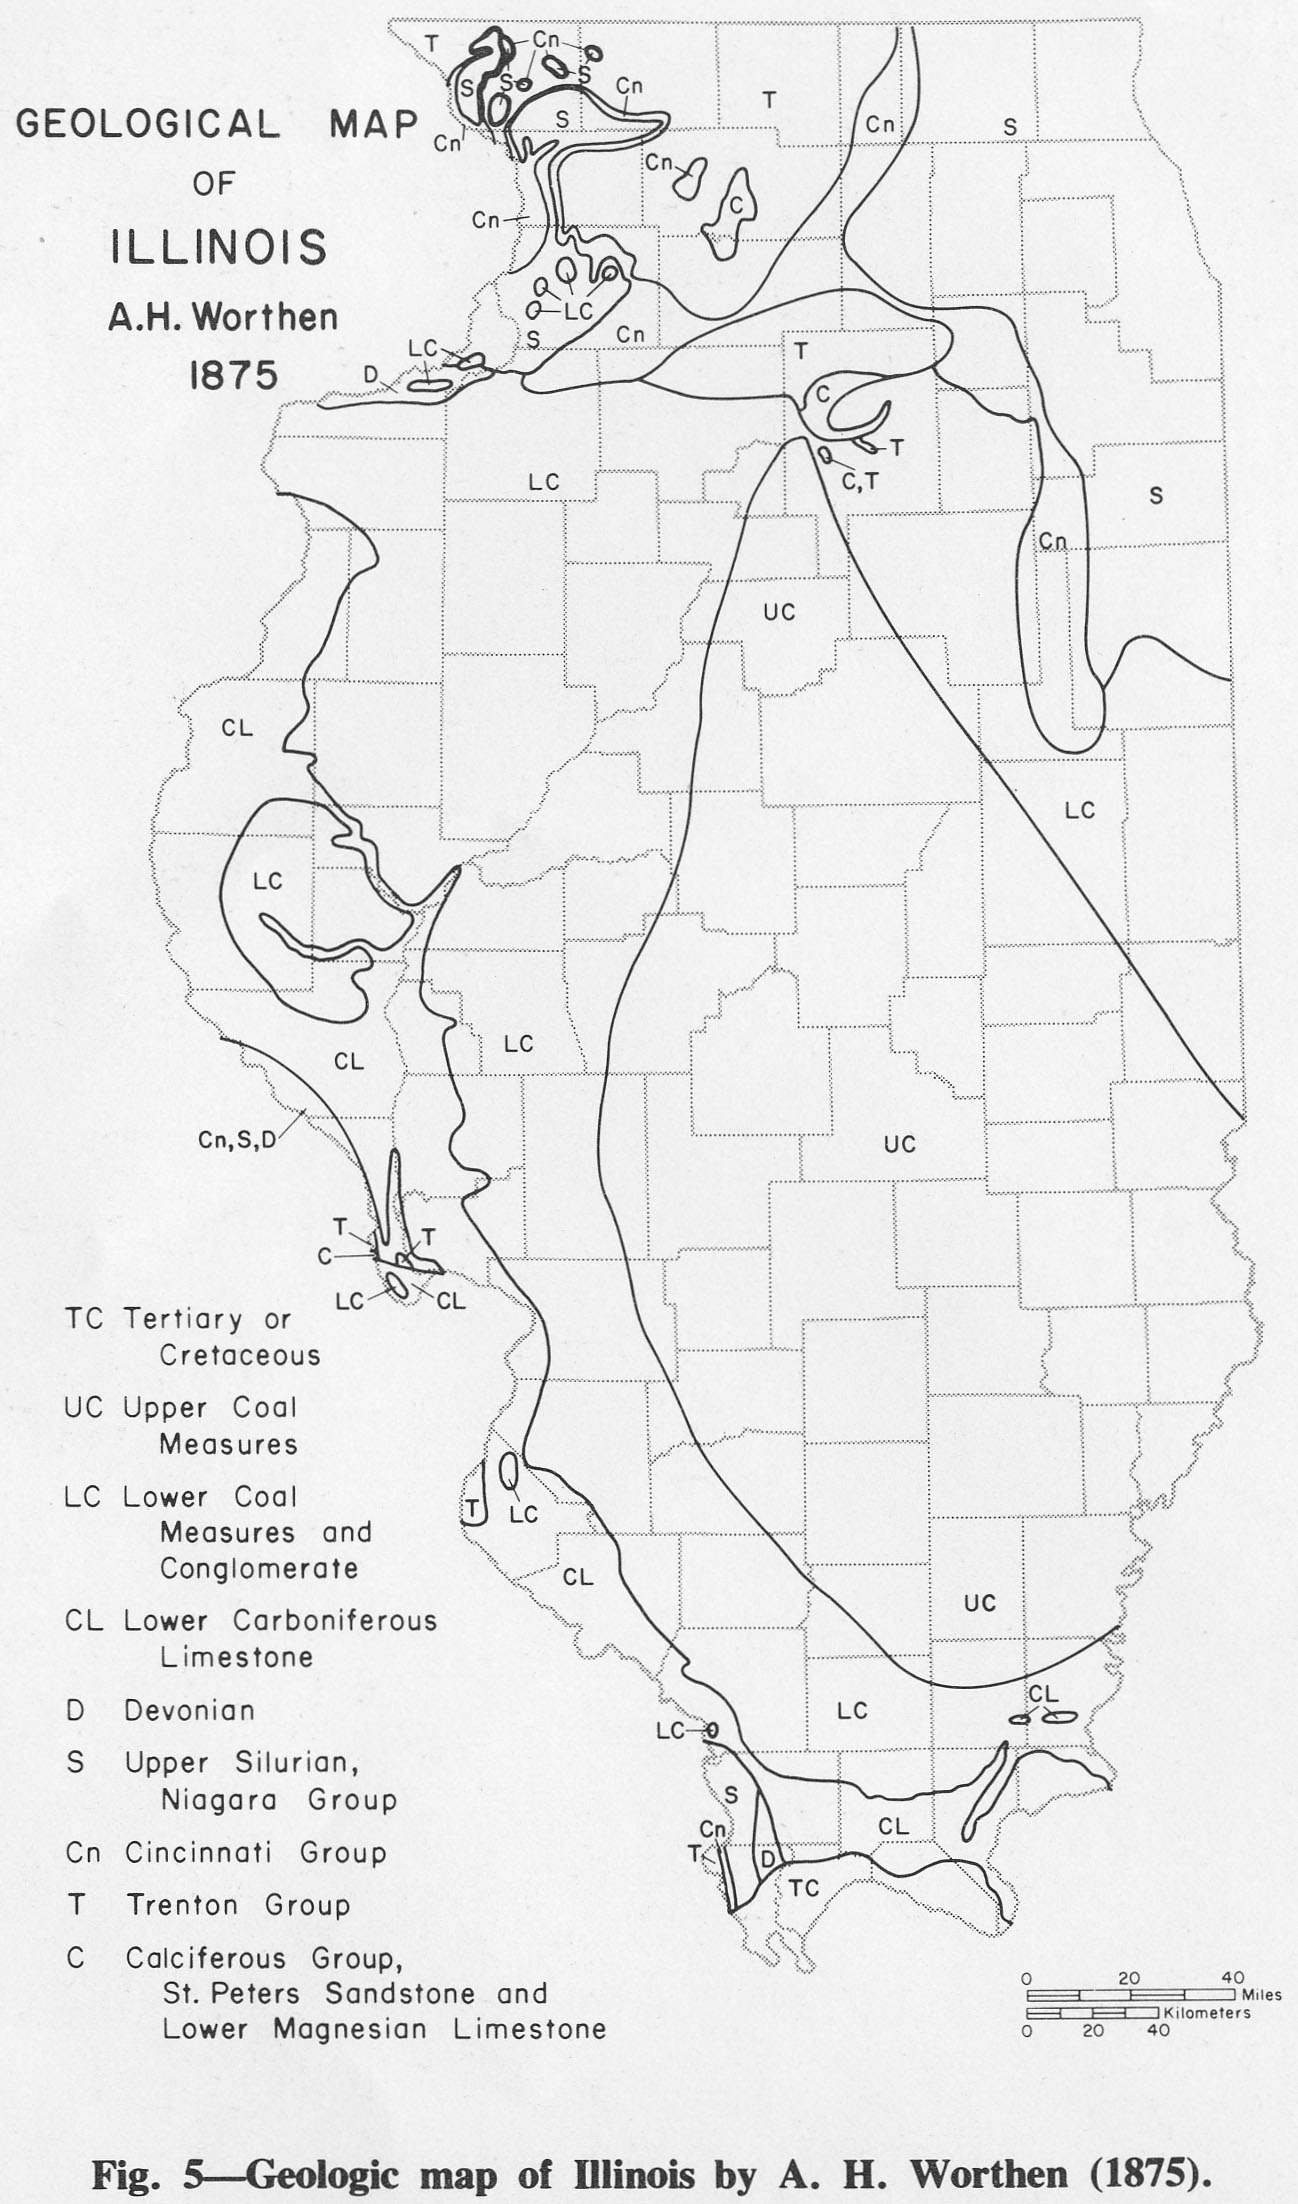
| 15:50, 1 April 2016 | Figure 5.jpg (file) |  |
350 KB | Alan.Myers | Fig. 5 -- Geologic map of Illinois by A. H. Worthen (1875). | 1 |
| 16:14, 23 December 2020 | Penn carbondale 4-21.jpg (file) |  |
354 KB | Jennifer.Obrad | 1 | |
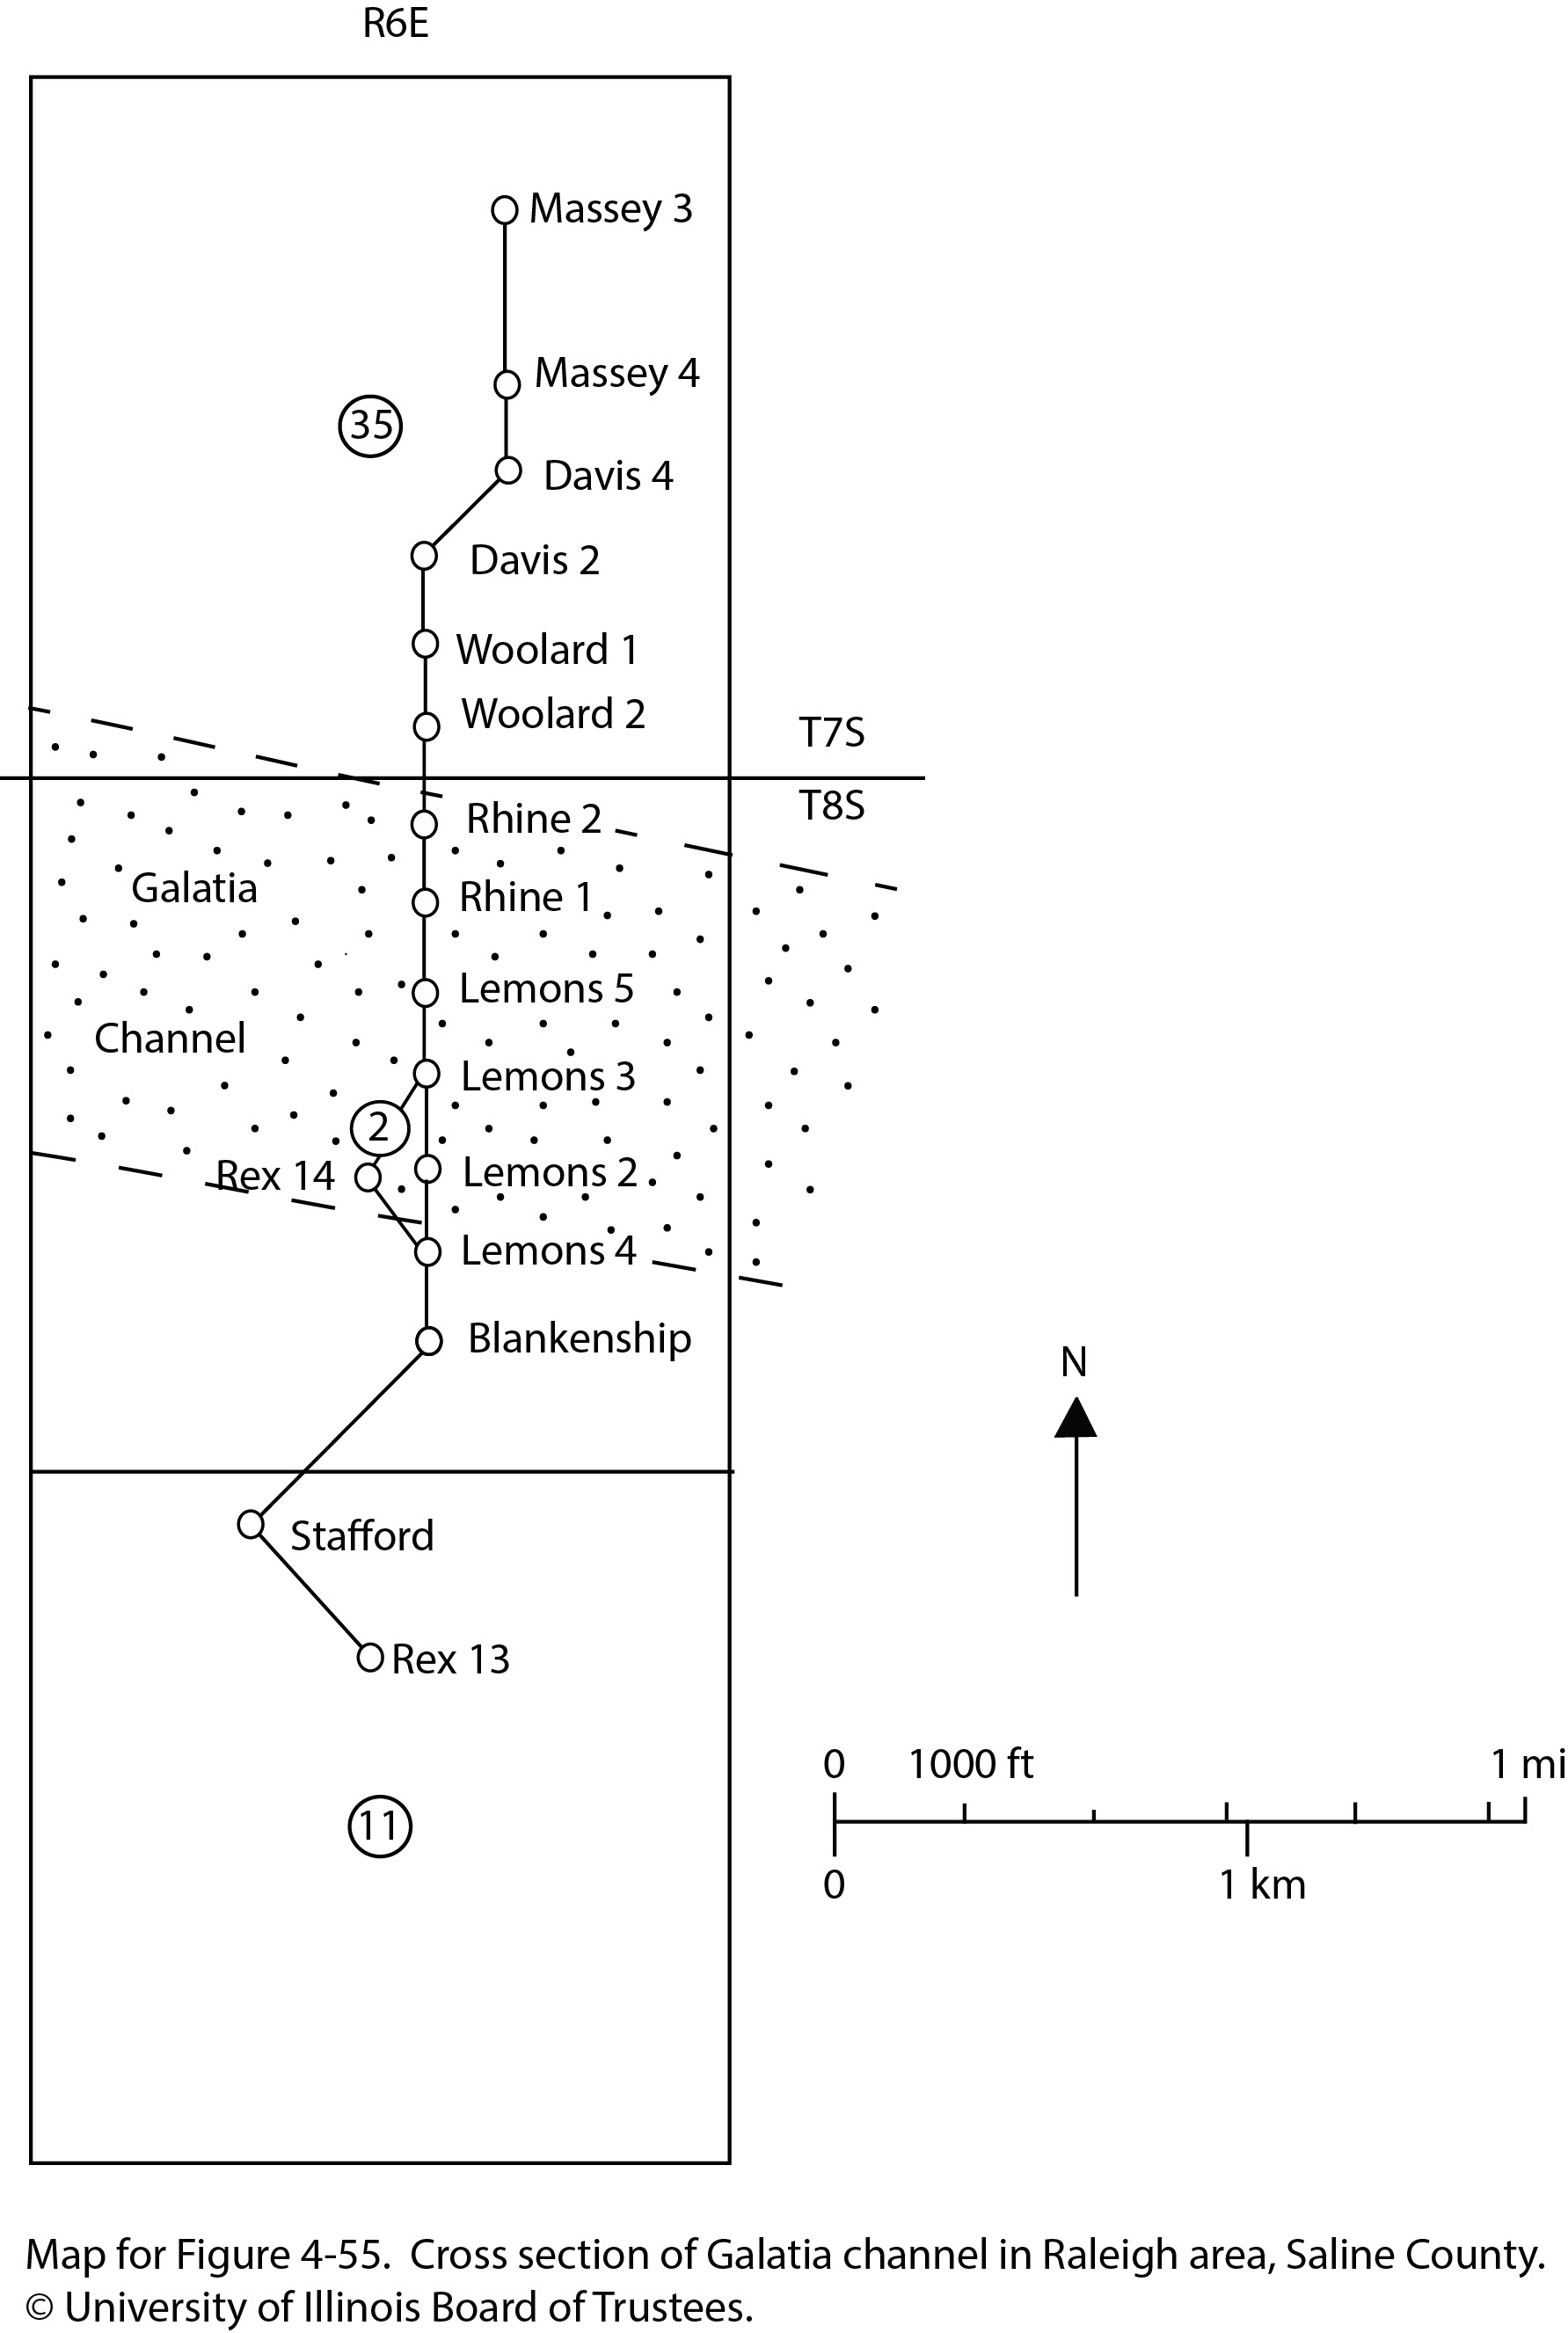
| 20:52, 23 December 2020 | Penn carbondale 4-55 map.jpg (file) |  |
356 KB | Jennifer.Obrad | 1 | |
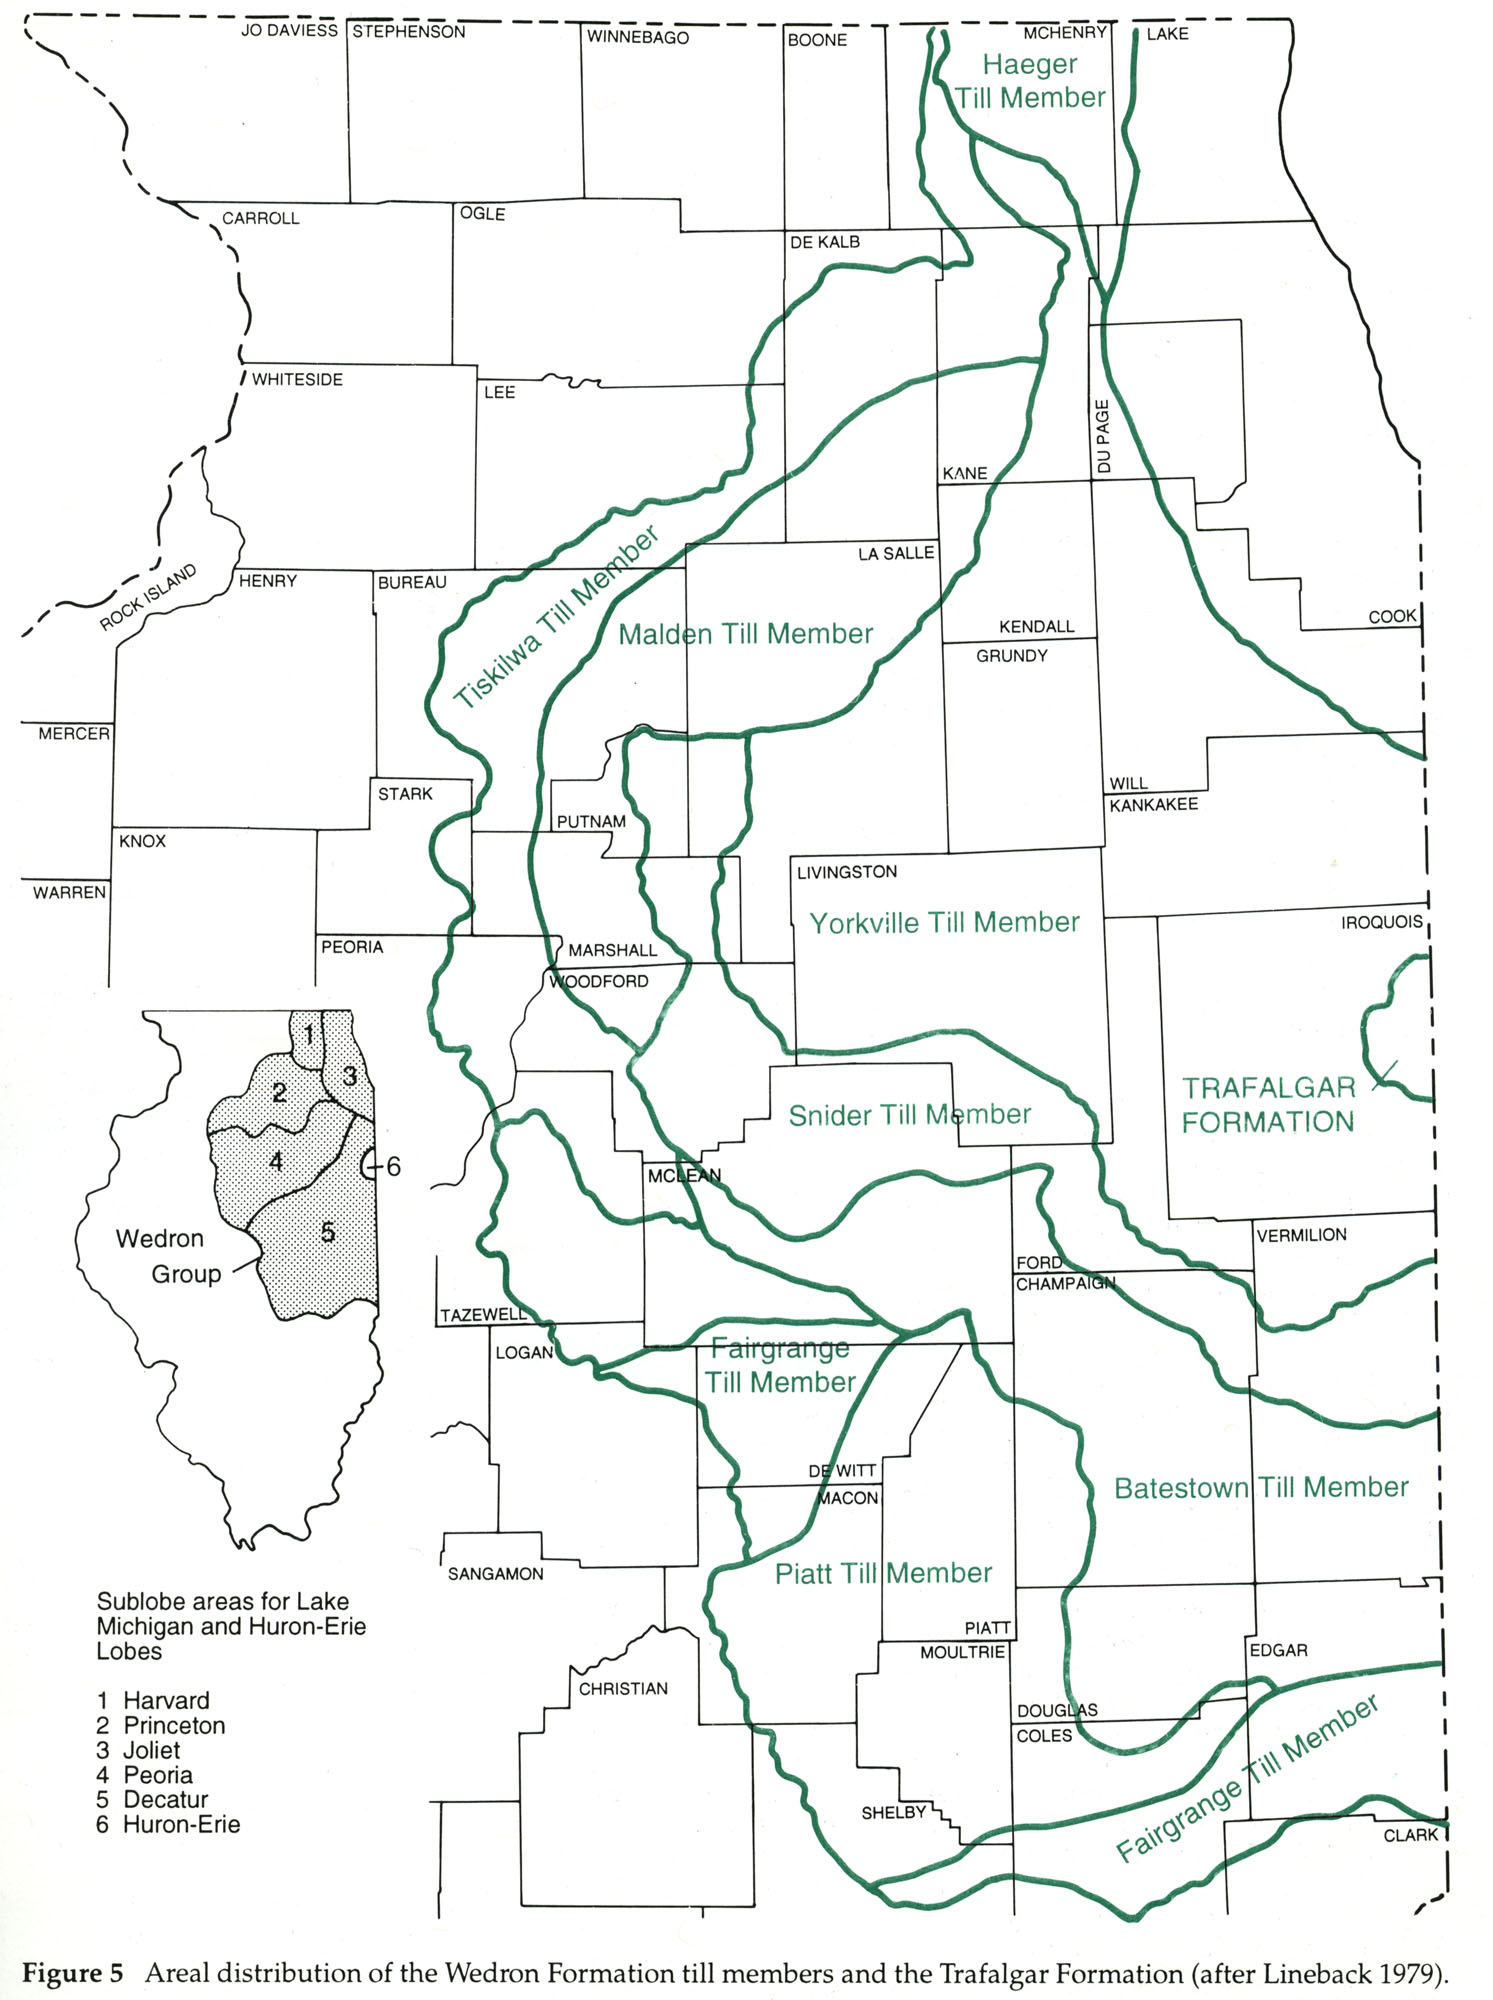
| 16:12, 19 April 2016 | 104-Figure 5.jpg (file) |  |
357 KB | Illex-gron | Figure 5 -- Areal distribution of the Wedron Formation till members and the Trafalgar Formation )after Lineback 1979). | 1 |
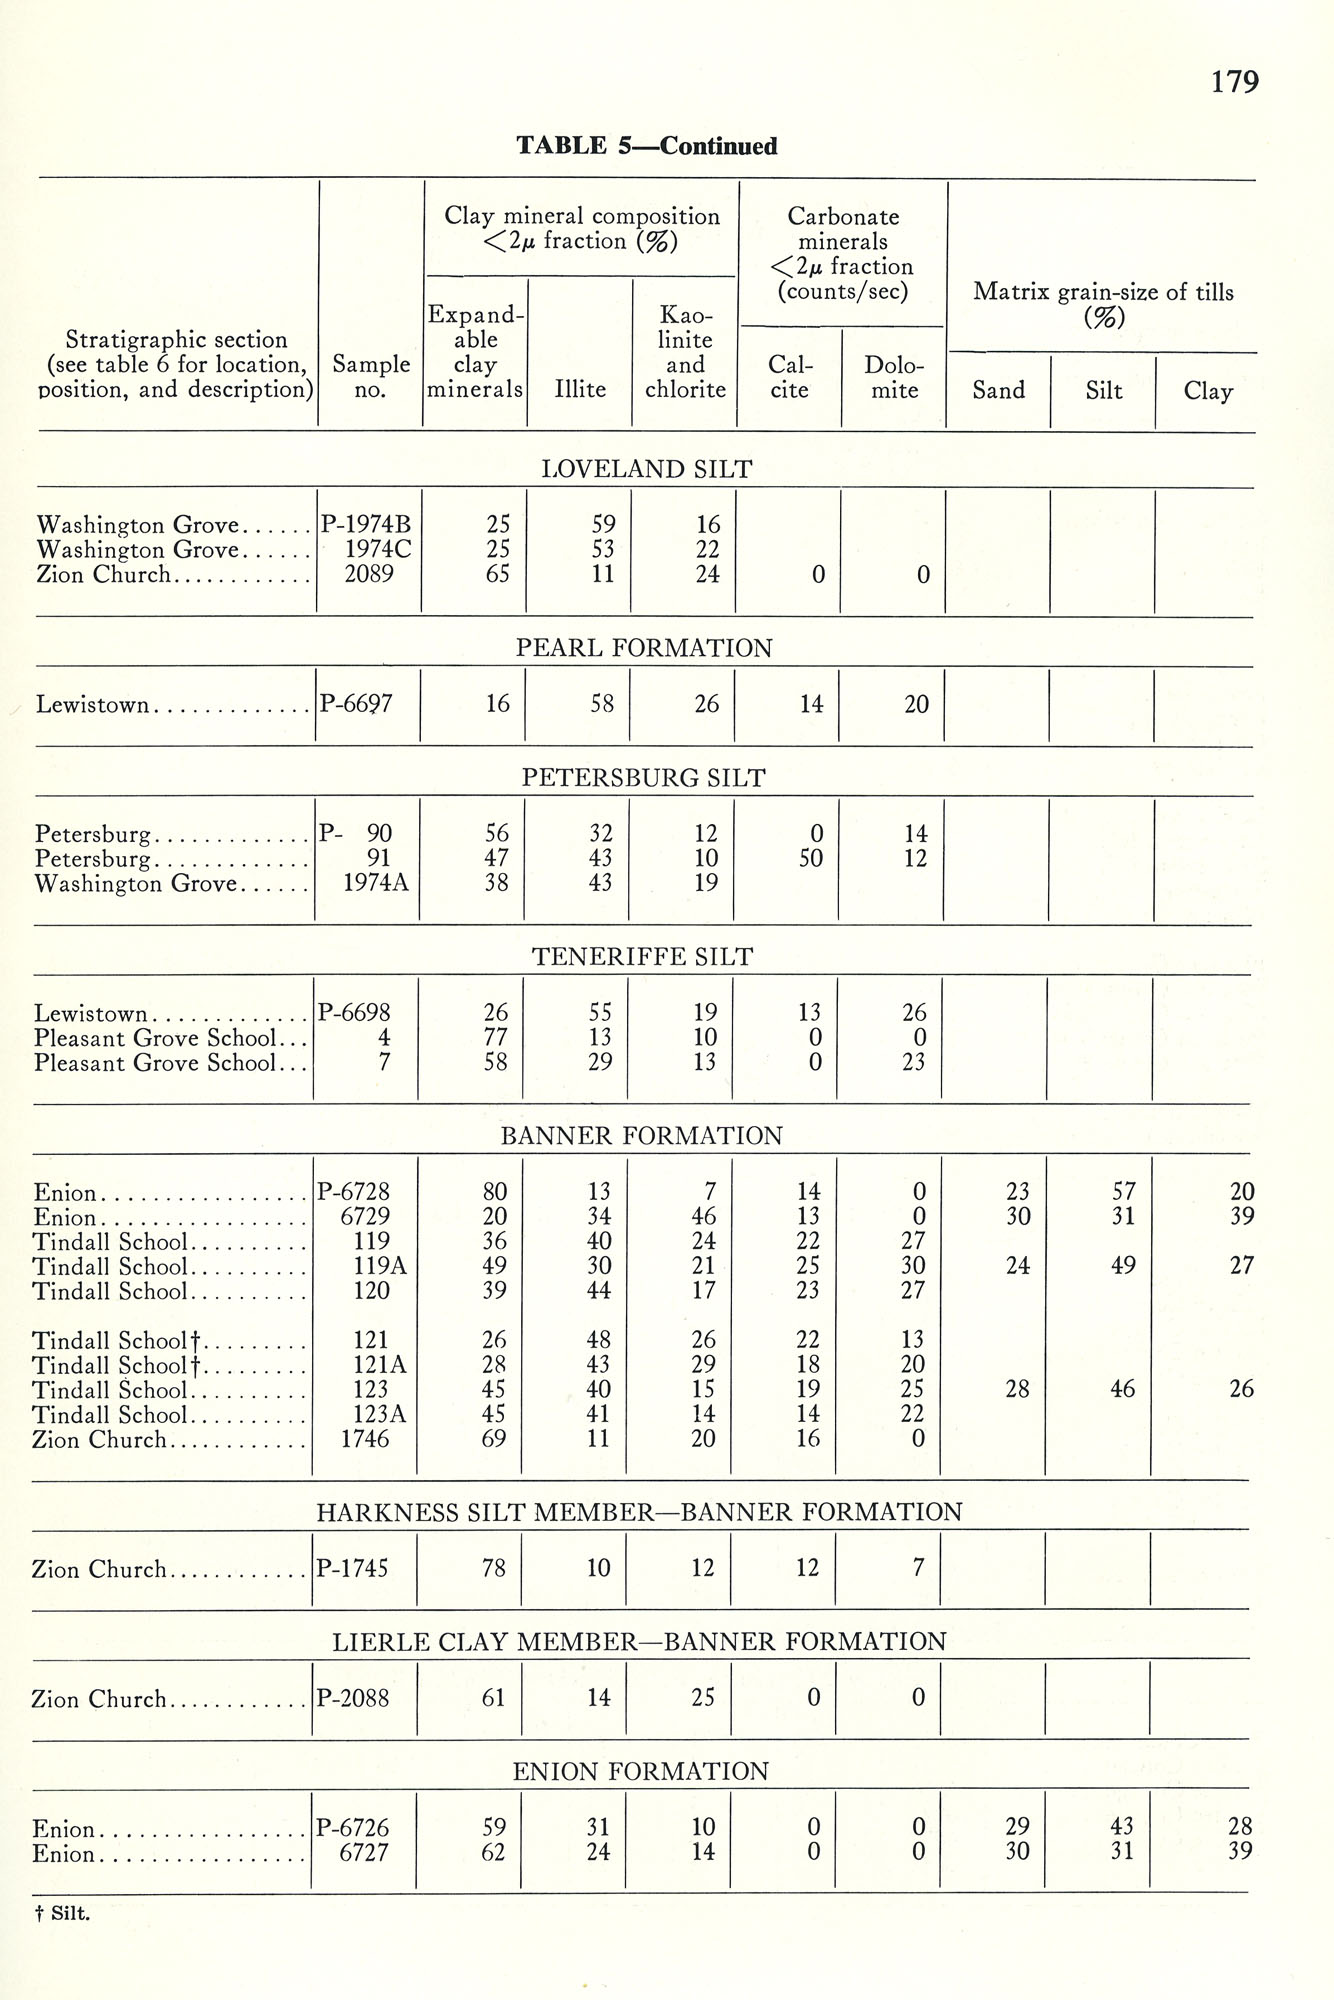
| 17:01, 18 April 2016 | 94-tb 5-.jpg (file) |  |
358 KB | Illex-gron | Table 5 -- Continued. | 1 |