Uploads by Alan.Myers
Jump to navigation
Jump to search
This special page shows all uploaded files.
| Date | Name | Thumbnail | Size | Description | Versions |
|---|---|---|---|---|---|
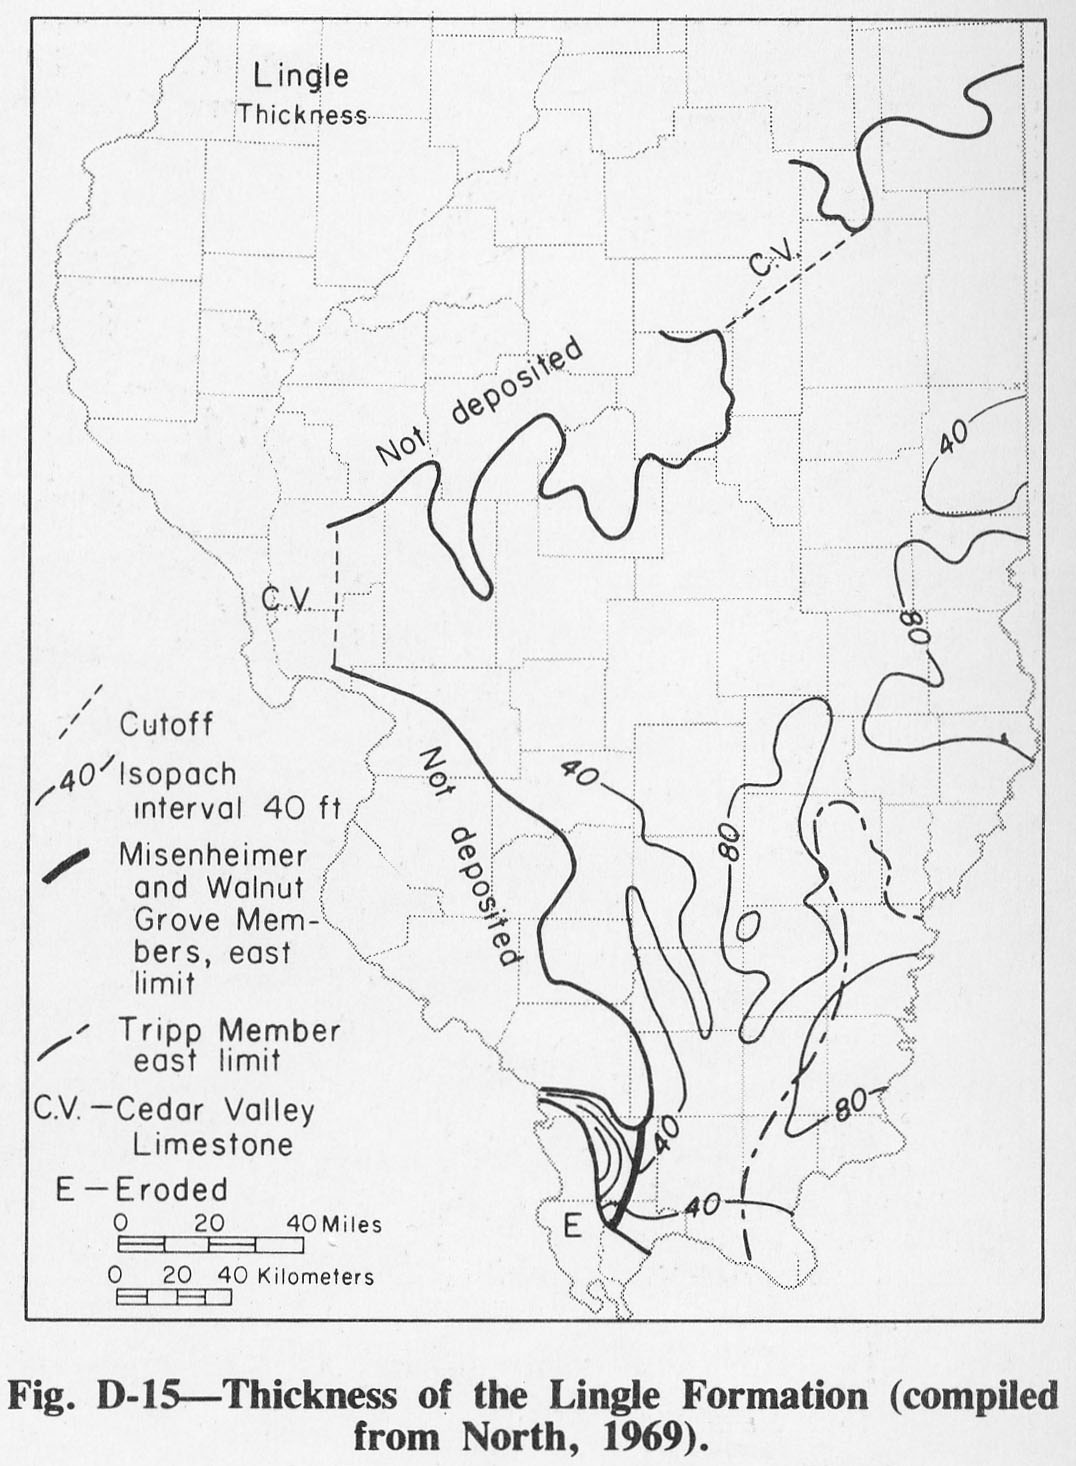
| 20:10, 1 April 2016 | Figure D-15.jpg (file) |  |
211 KB | Fig. D-15 -- Thickness of the Lingle Formation (compliled from North, 1969). | 1 |
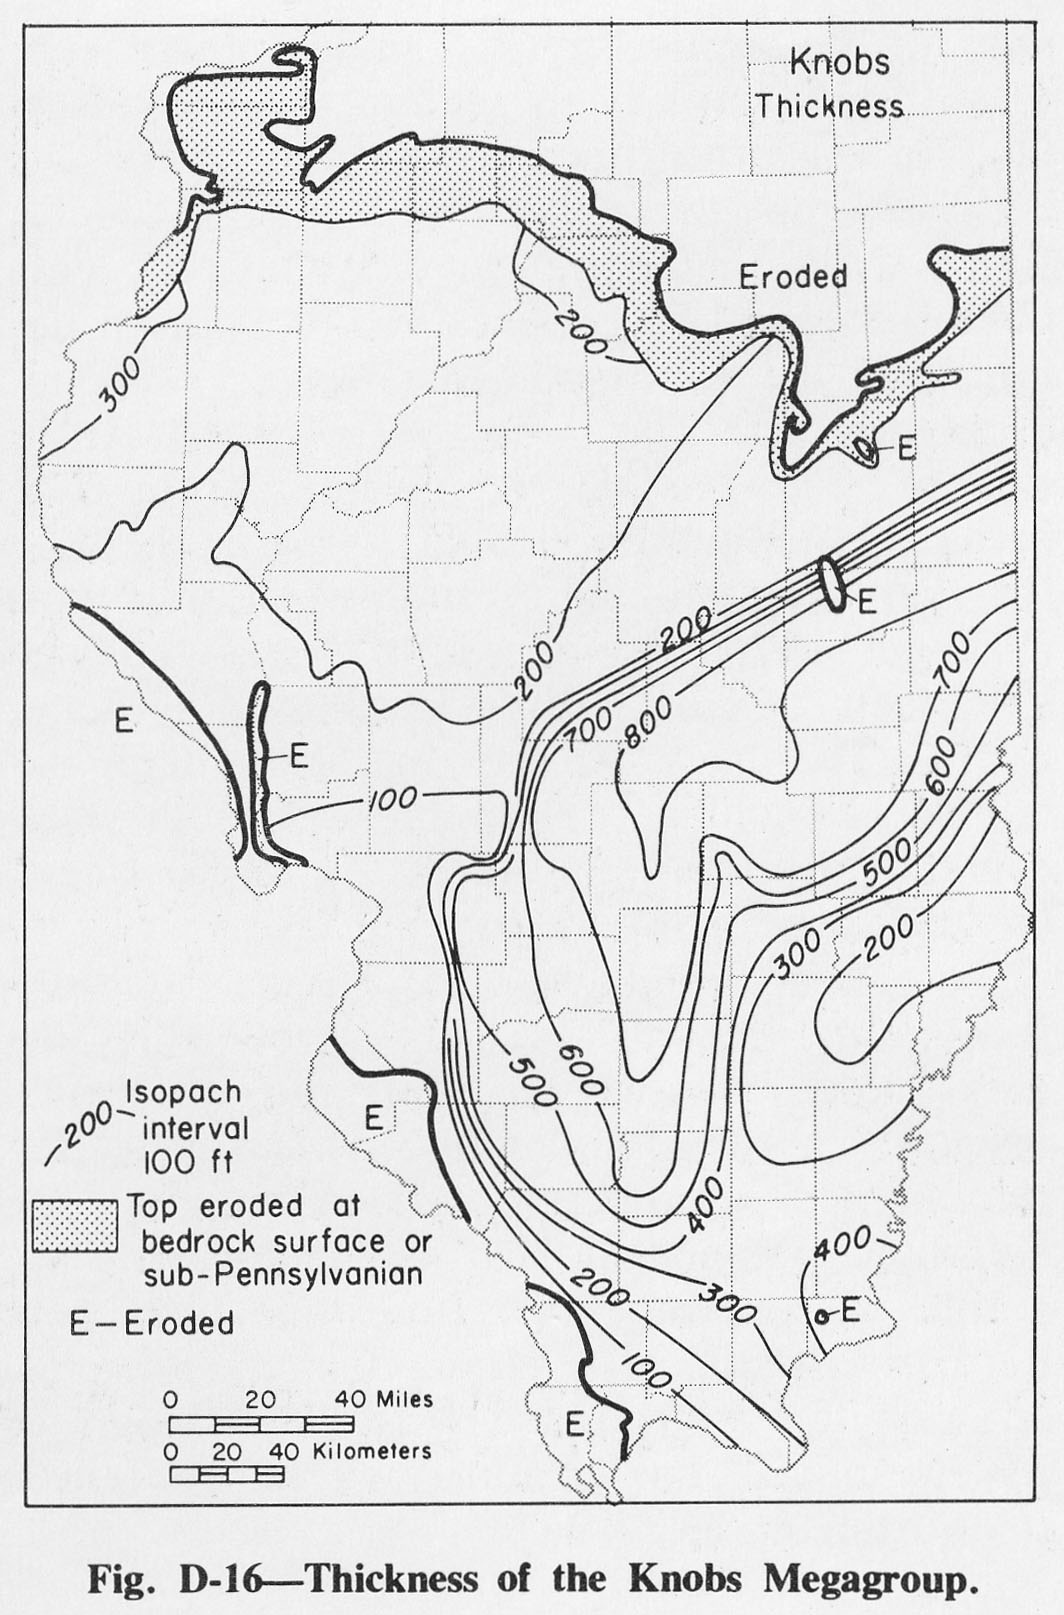
| 20:12, 1 April 2016 | Figure D-16.jpg (file) |  |
273 KB | Fig. D-16 -- Thickness of the Knobs Megagroup. | 1 |
| 20:13, 1 April 2016 | Figure D-17.jpg (file) |  |
252 KB | Fig. D-17 -- Thickness of the Blocher Shale (after North, 1969). | 1 |
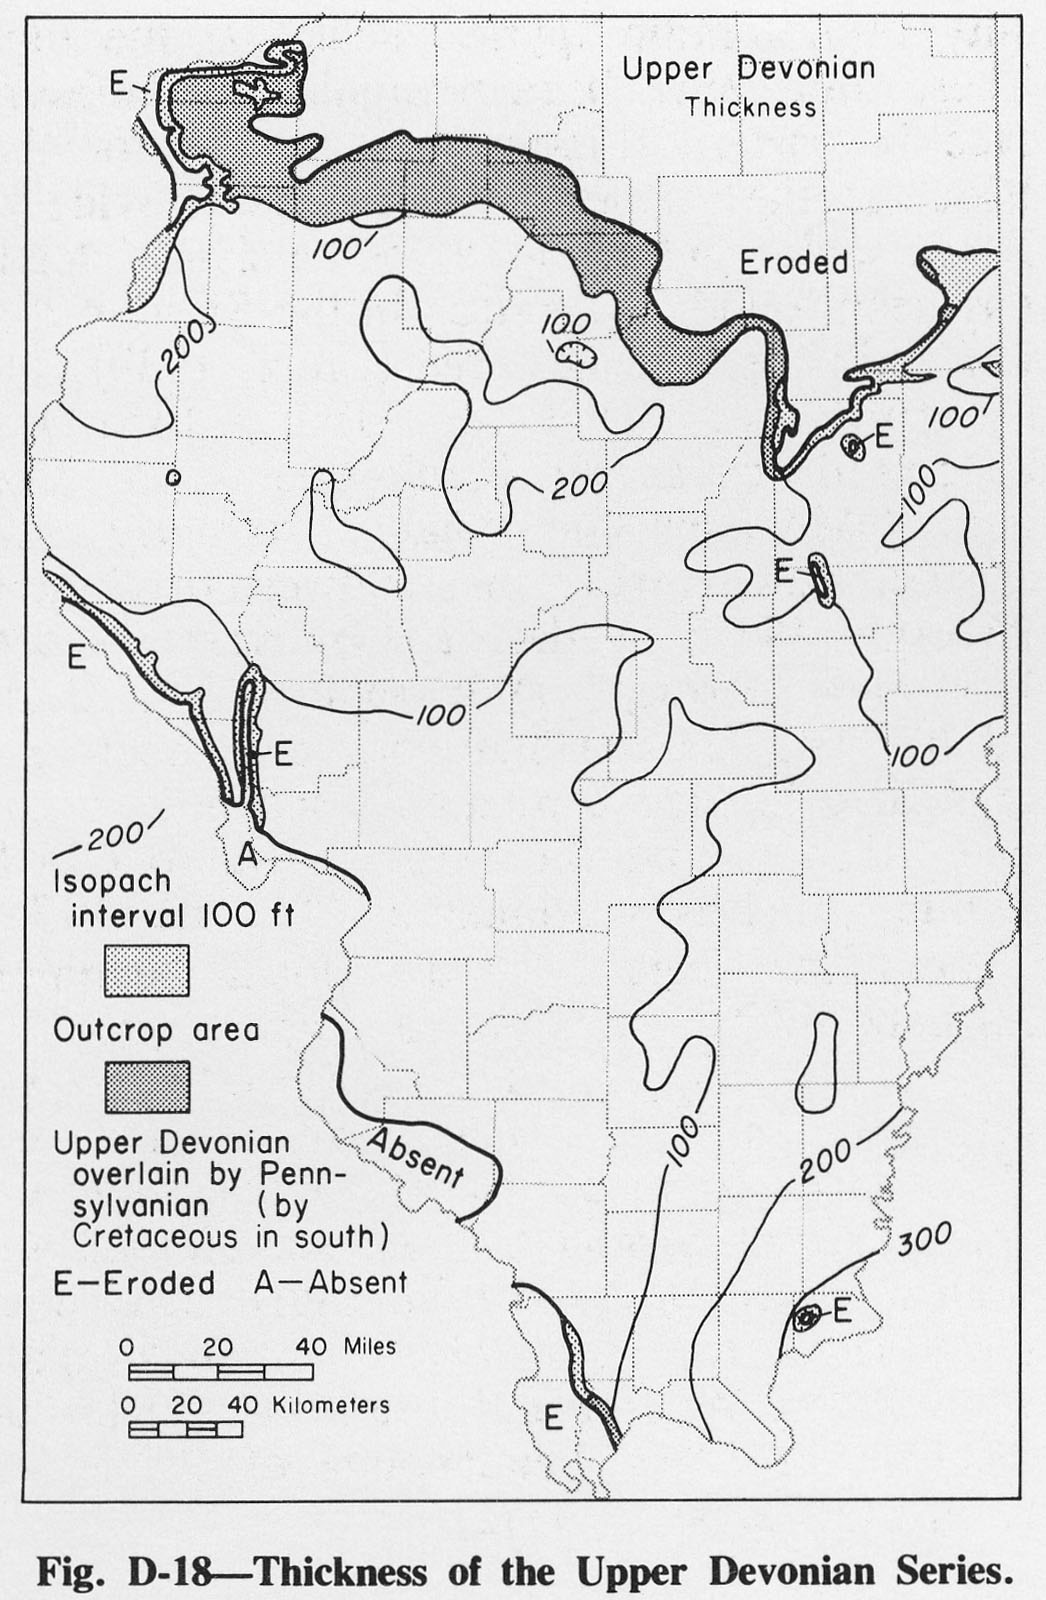
| 20:15, 1 April 2016 | Figure D-18.jpg (file) |  |
283 KB | 1 | |
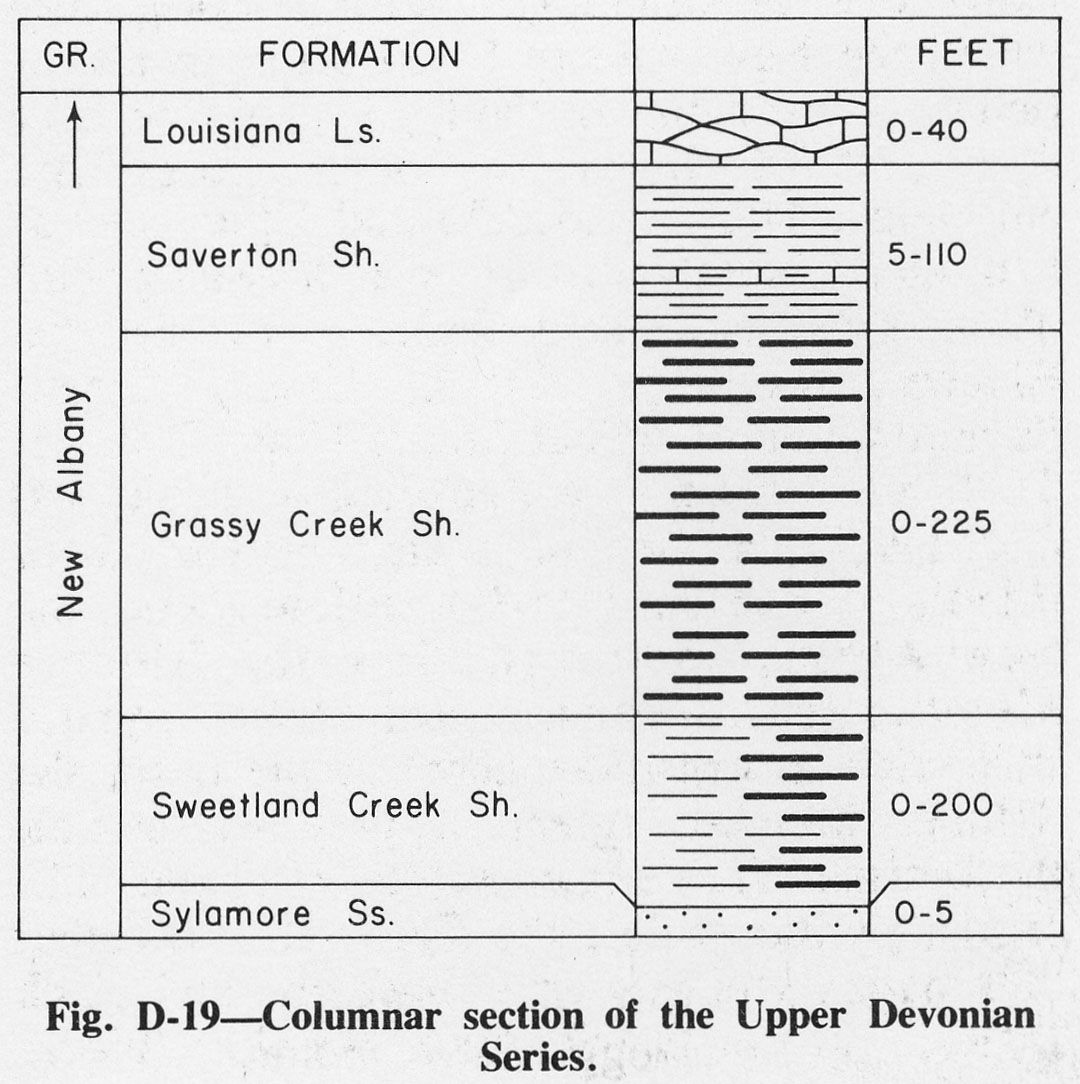
| 20:17, 1 April 2016 | Figure D-19.jpg (file) |  |
194 KB | Fig. D-19 -- Columnar section of the Upper Devonian Series. | 1 |
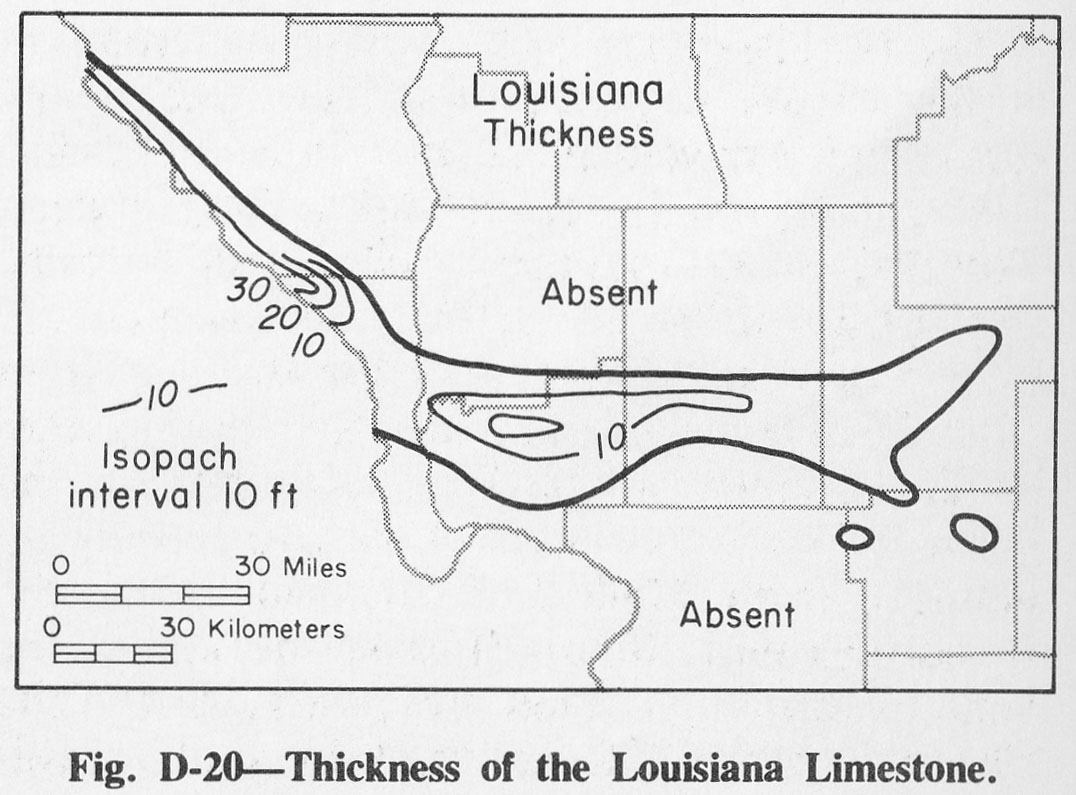
| 20:17, 1 April 2016 | Figure D-20.jpg (file) |  |
152 KB | Fig. D-20 -- Thickness of the Louisiana Limestone. | 1 |
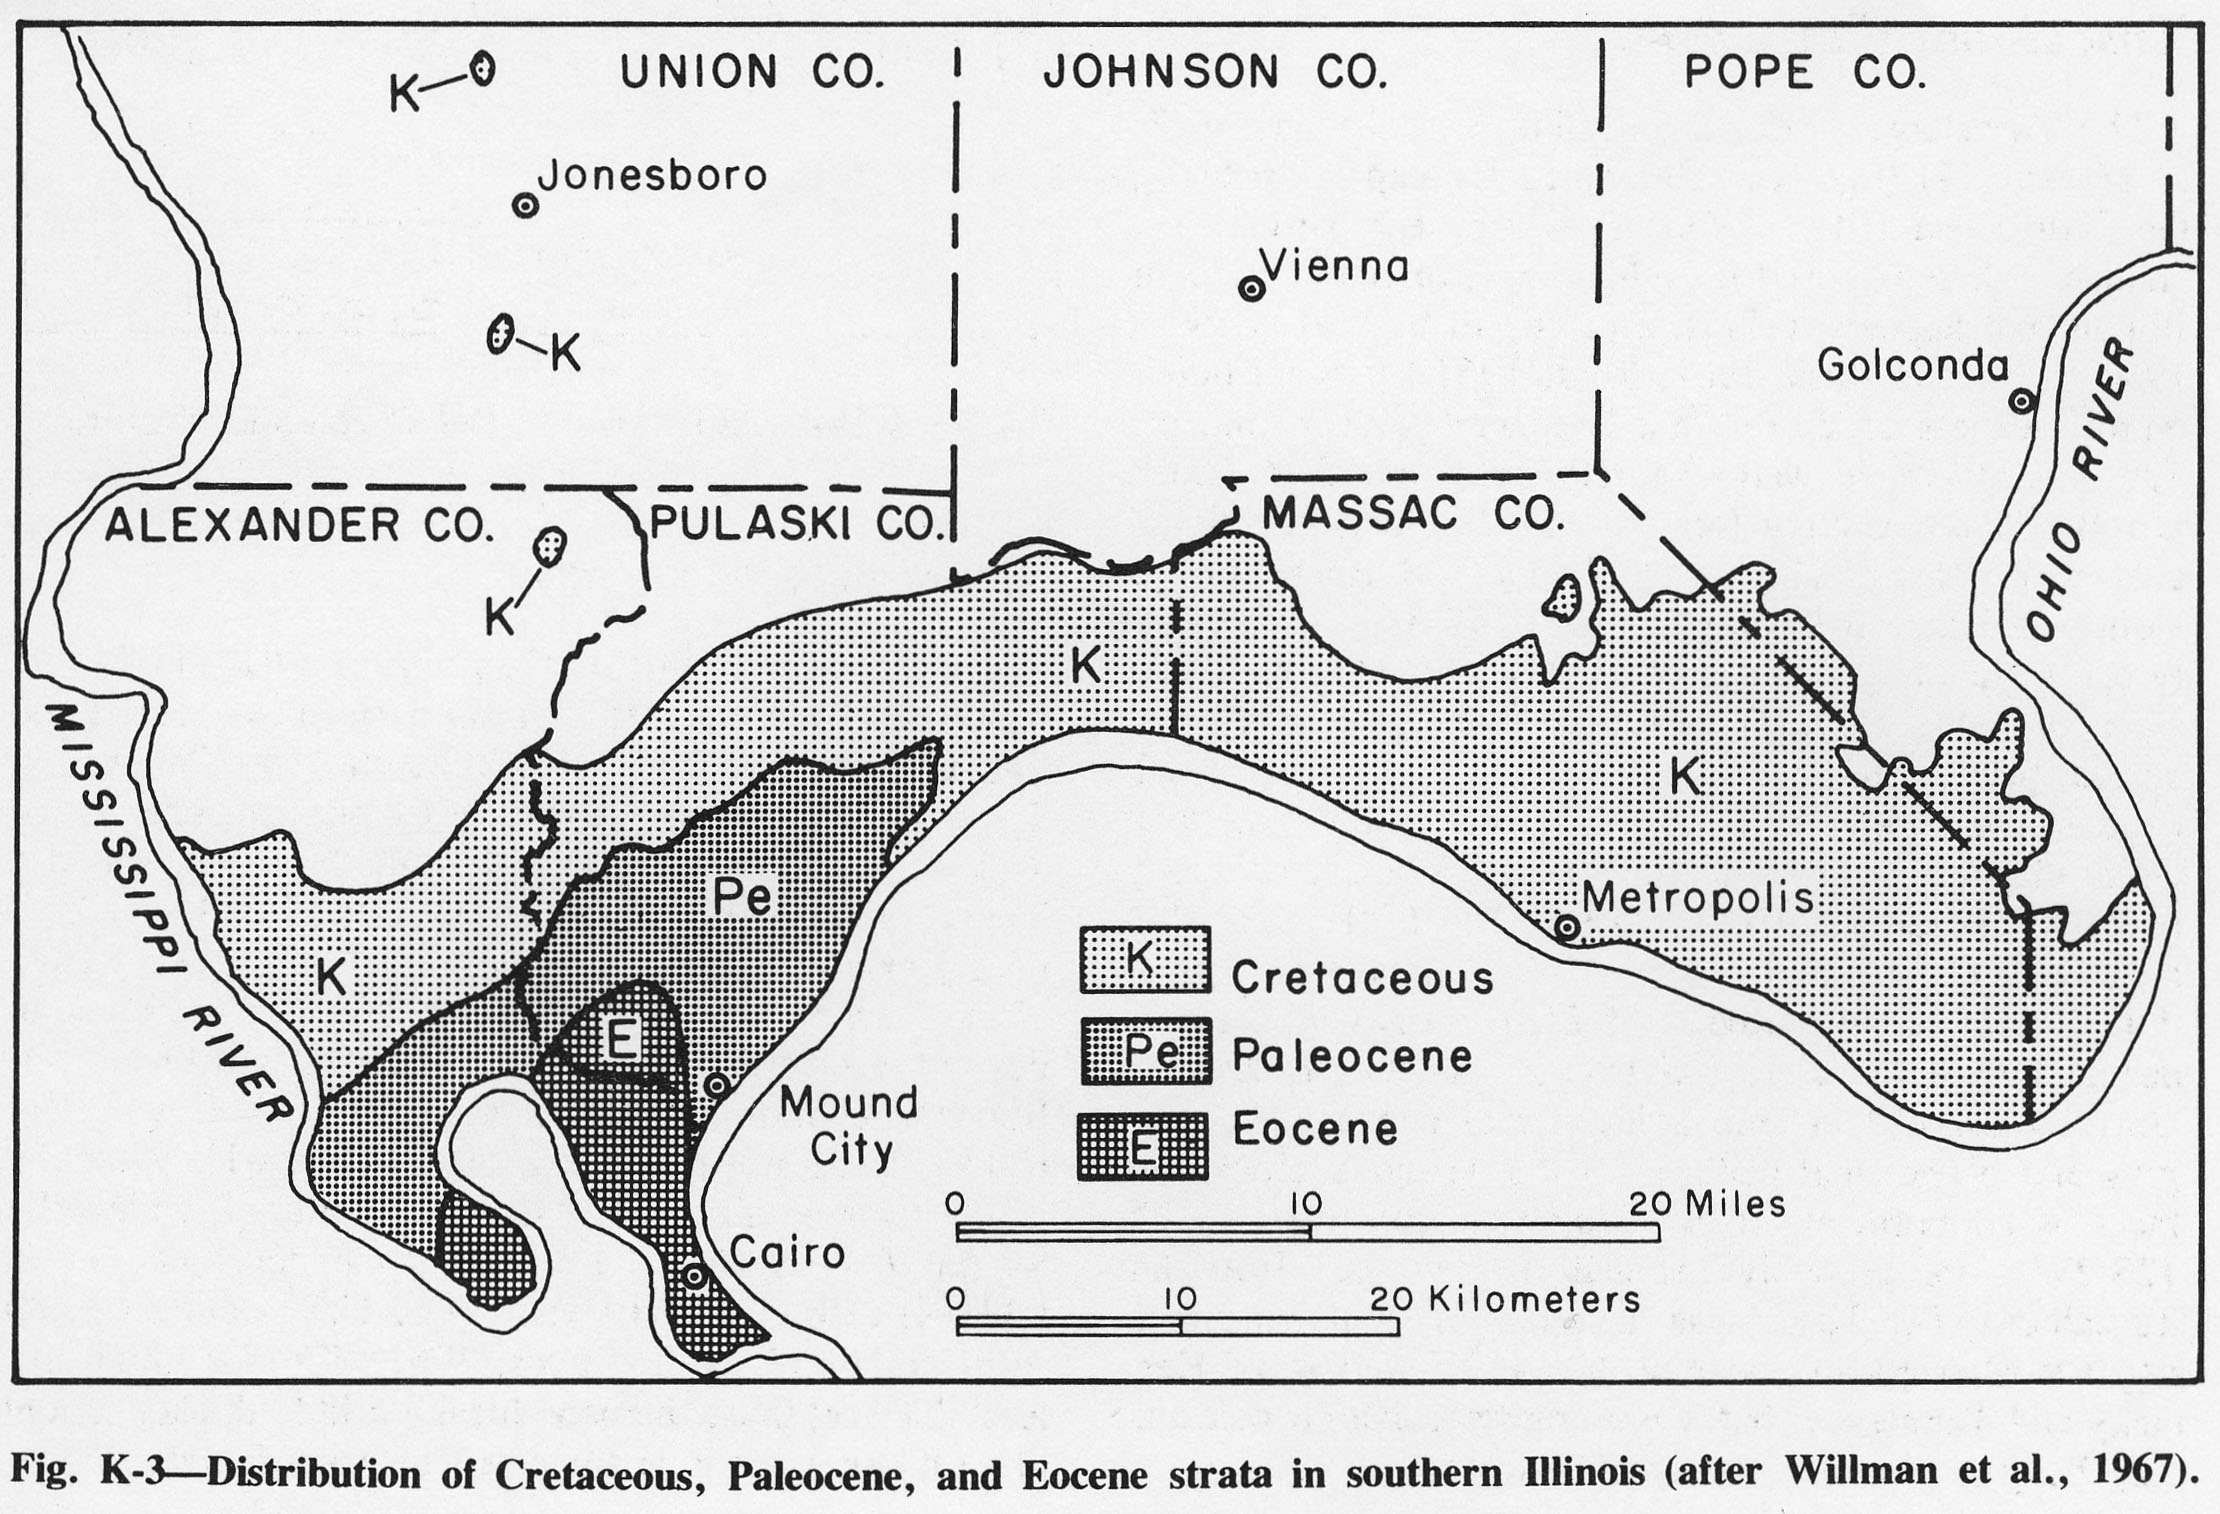
| 20:19, 1 April 2016 | Figure K-3.jpg (file) |  |
557 KB | Fig. K-3 -- Distribution of Cretaceous, Paleocene, and Eocene strata in southern Illinois (after Willman et al., 1967). | 1 |
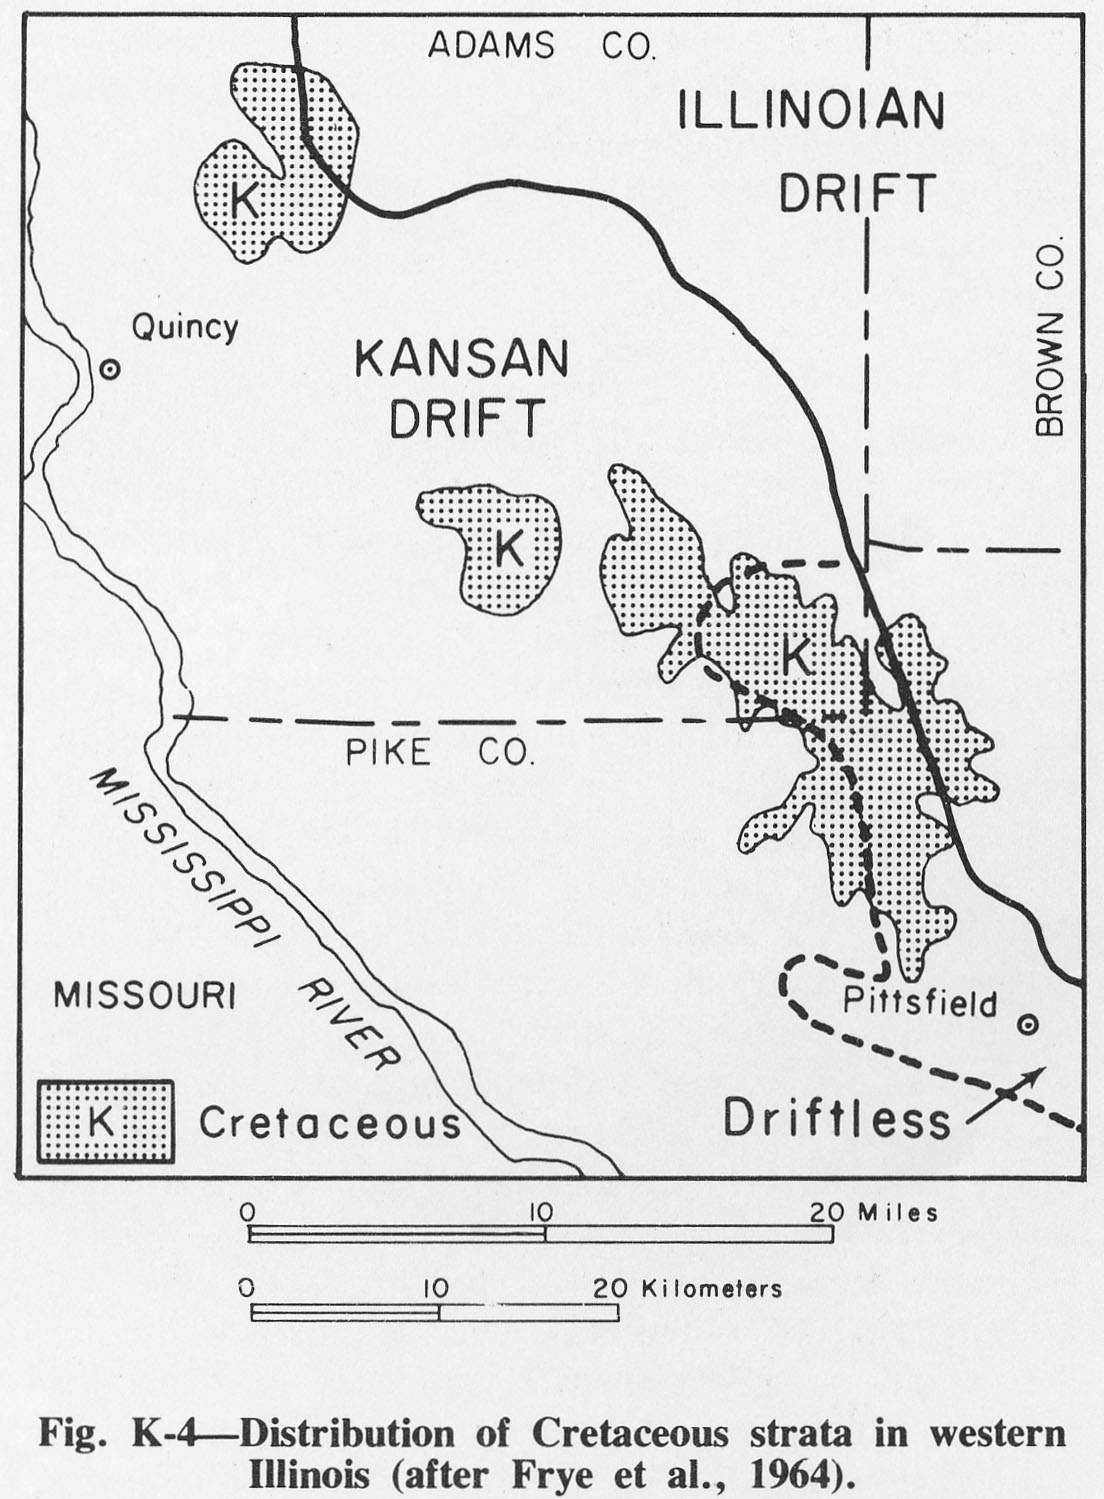
| 20:20, 1 April 2016 | Figure K-4.jpg (file) |  |
216 KB | Fig. K-4 -- Distribution of Cretaceous strata in western Illinois (after Frye et al., 1964). | 1 |
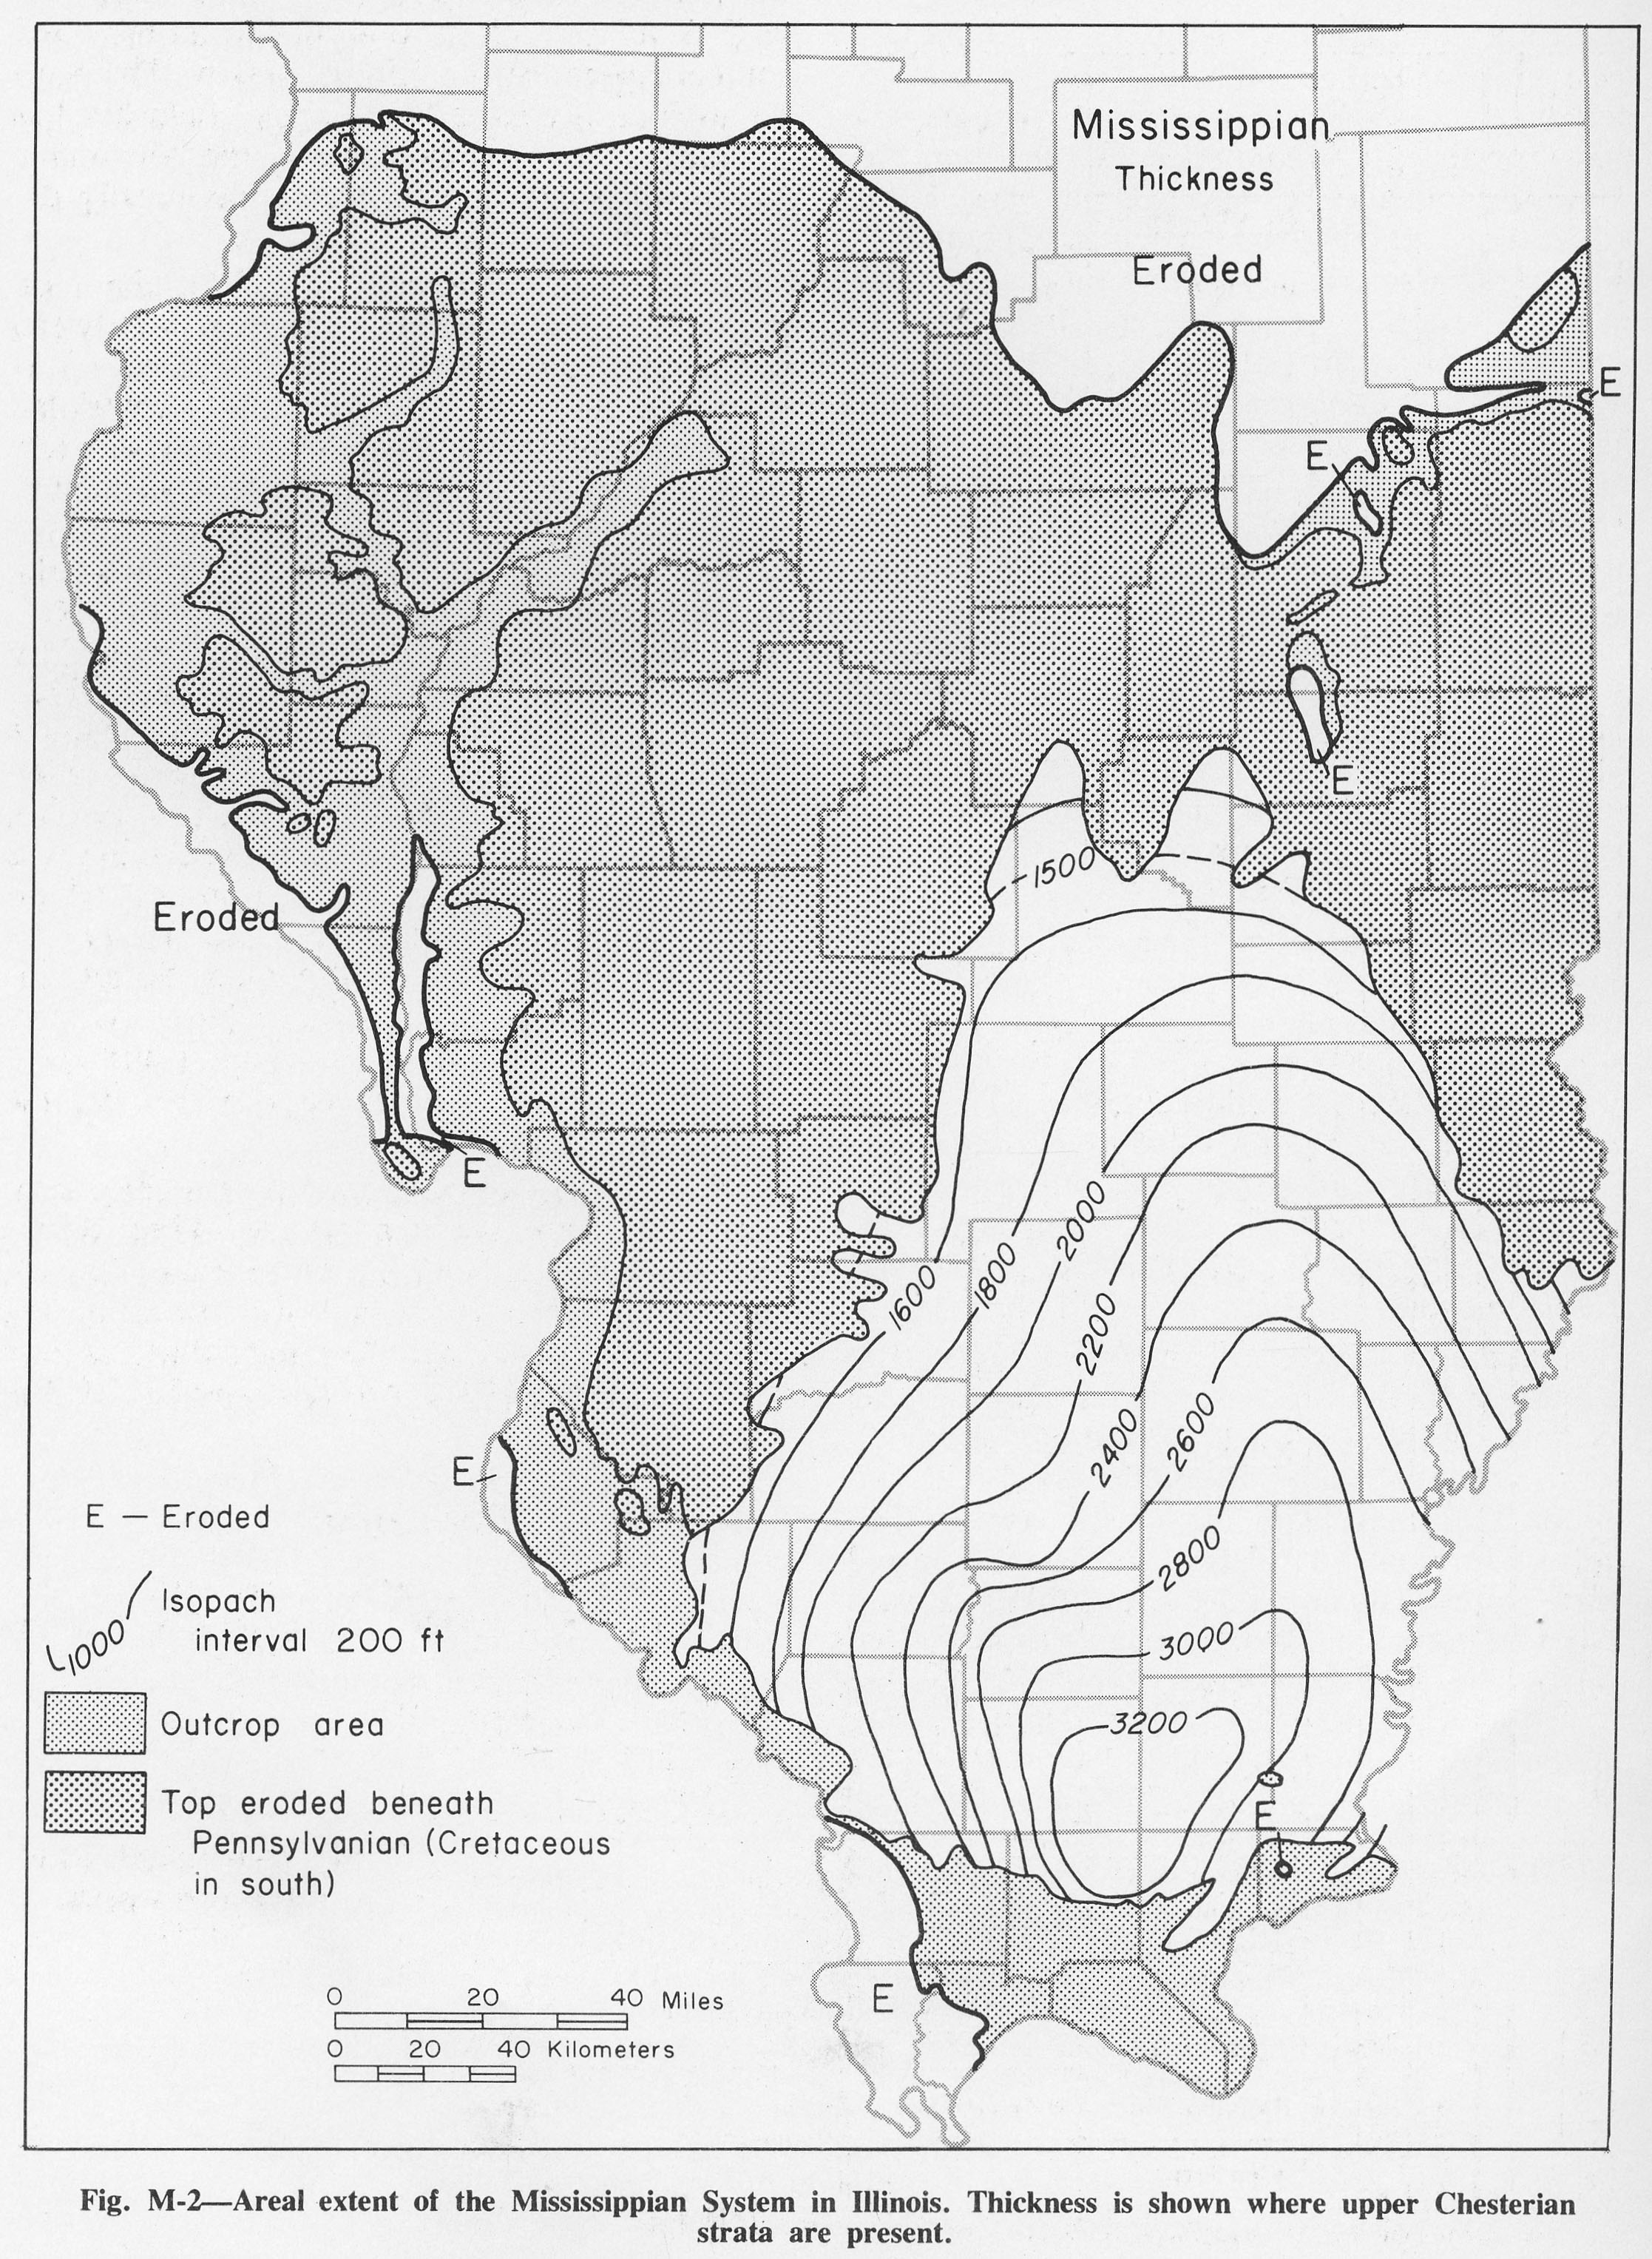
| 13:04, 4 April 2016 | Figure M-2.jpg (file) |  |
1.38 MB | Fig. M-2 -- Areal extent of the Mississippian System in Illinois. Thickness is shown where upper Chesterian strata are present. | 1 |
| 13:22, 4 April 2016 | Figure M-3.jpg (file) |  |
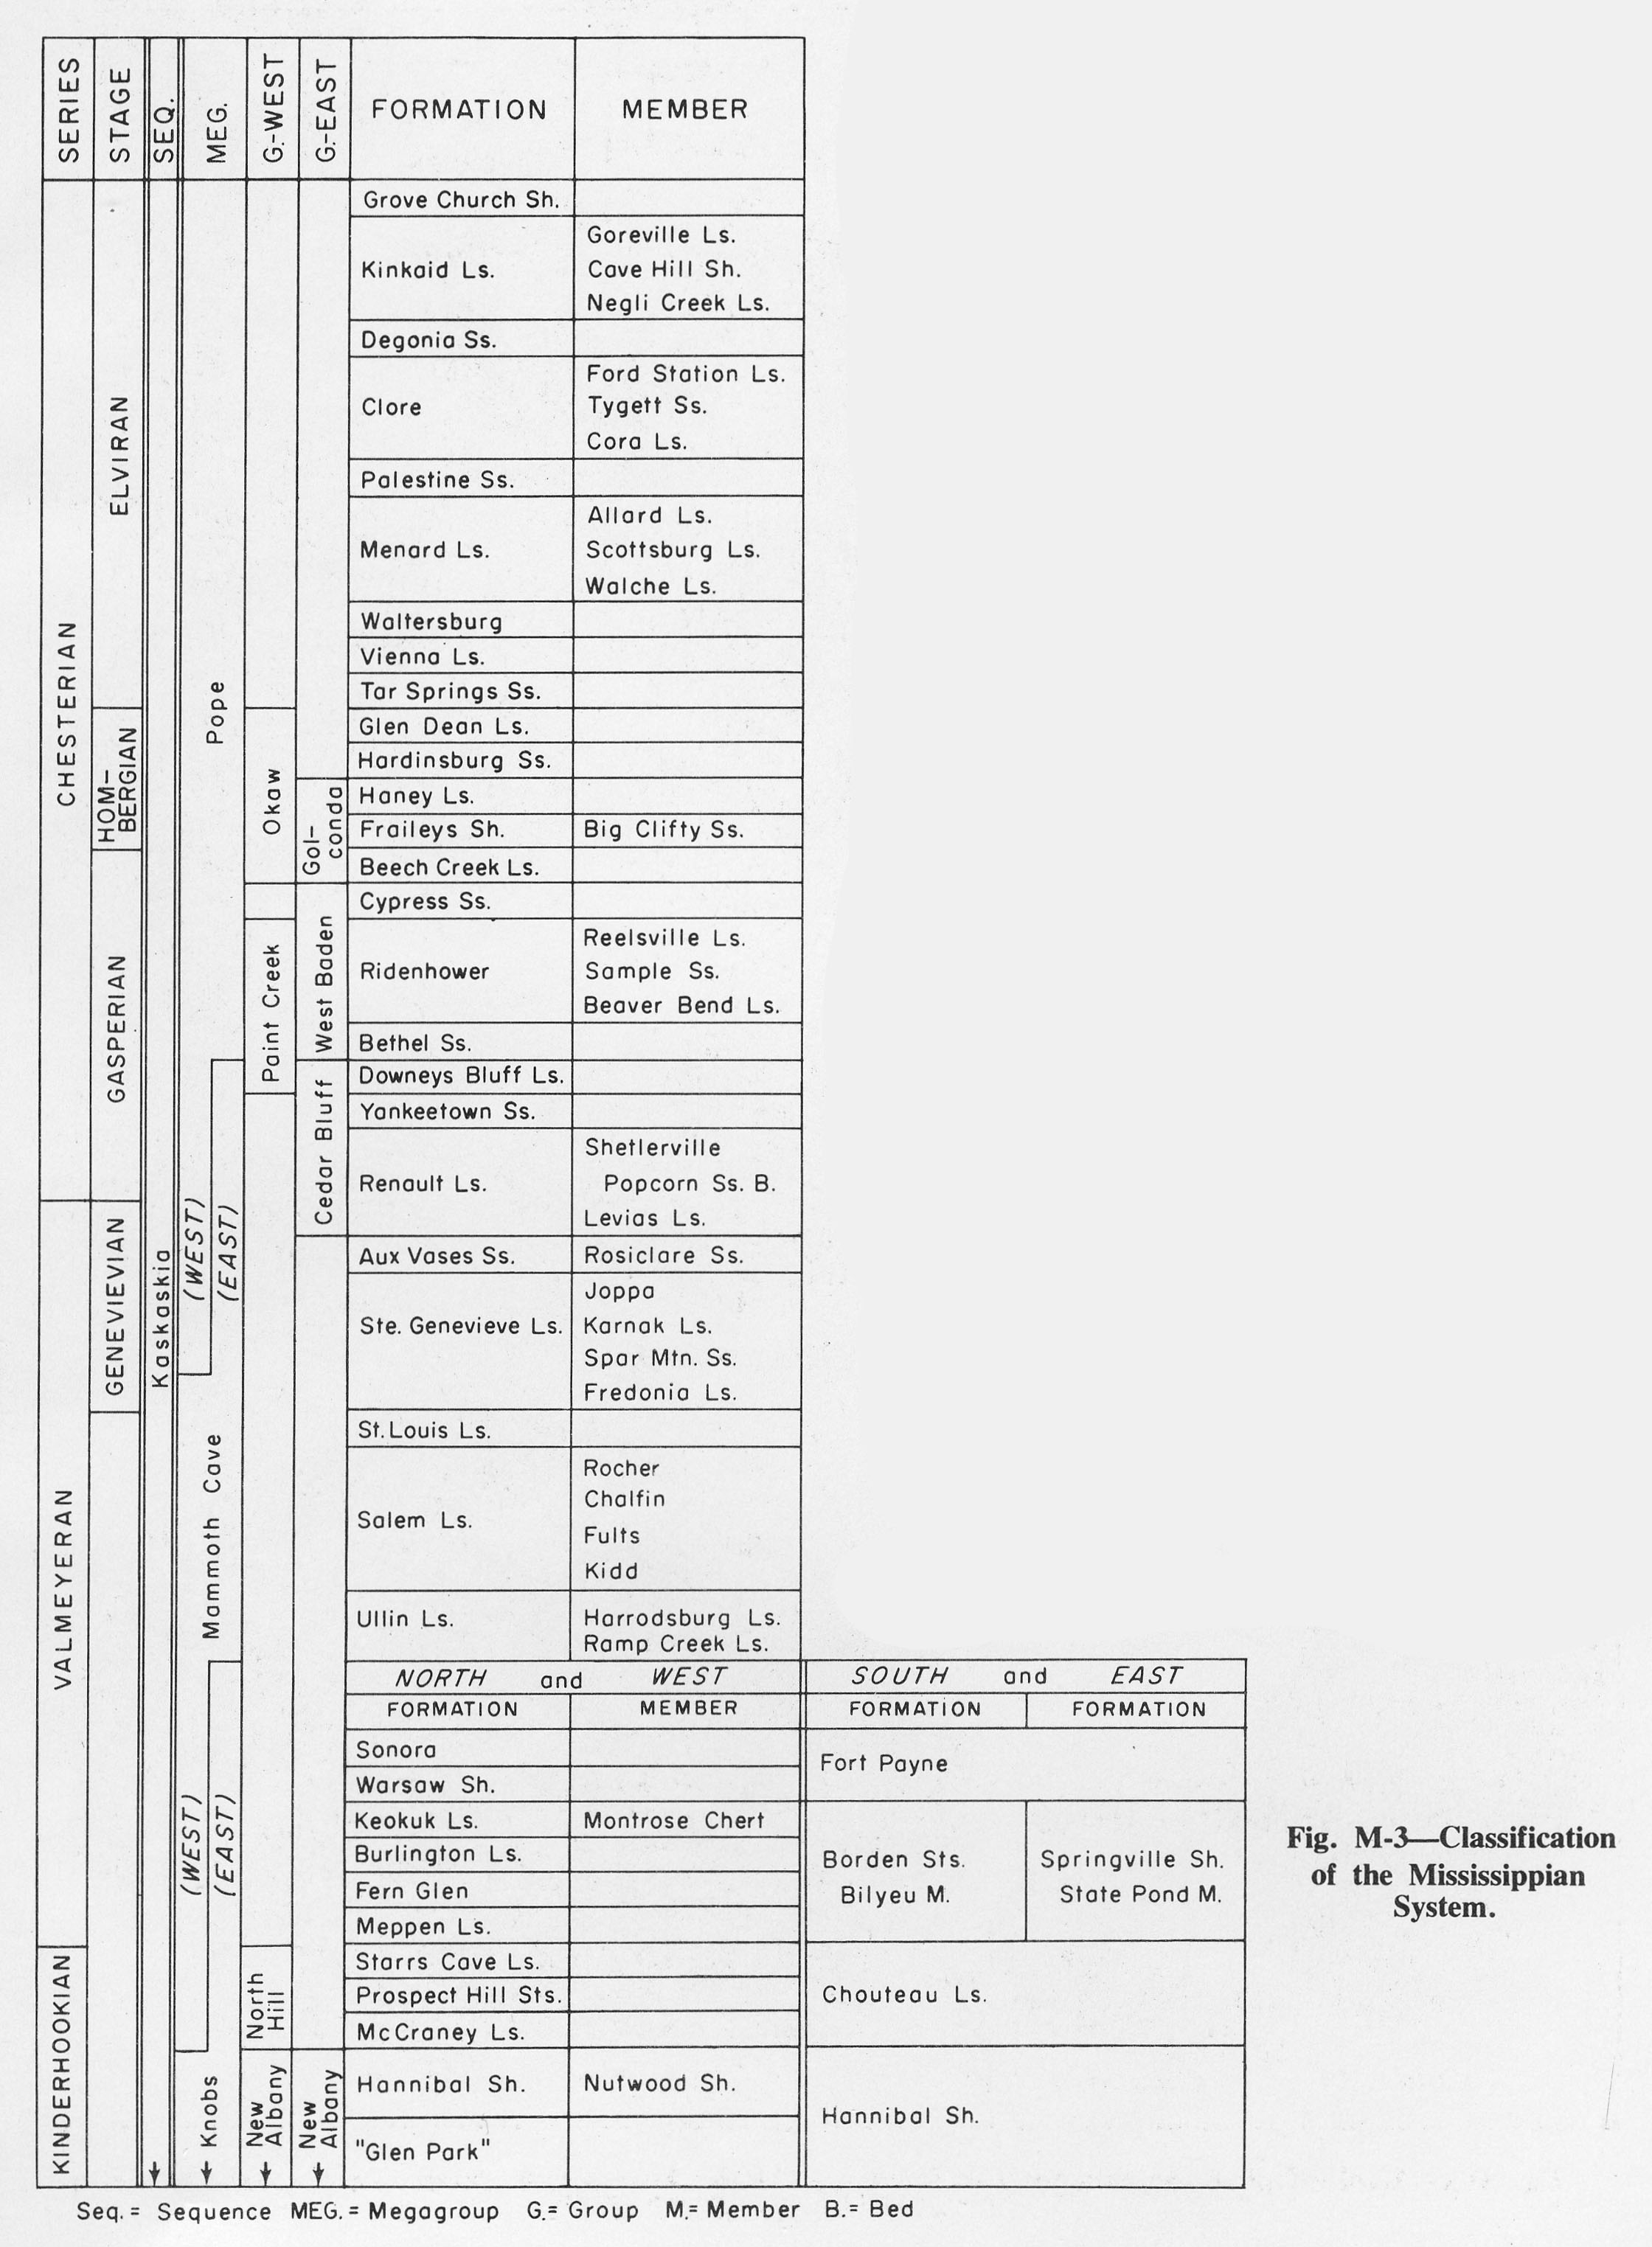
586 KB | Fig. M-3 -- Classification of the Mississippian System. | 1 |
| 13:23, 4 April 2016 | Figure M-4.jpg (file) |  |
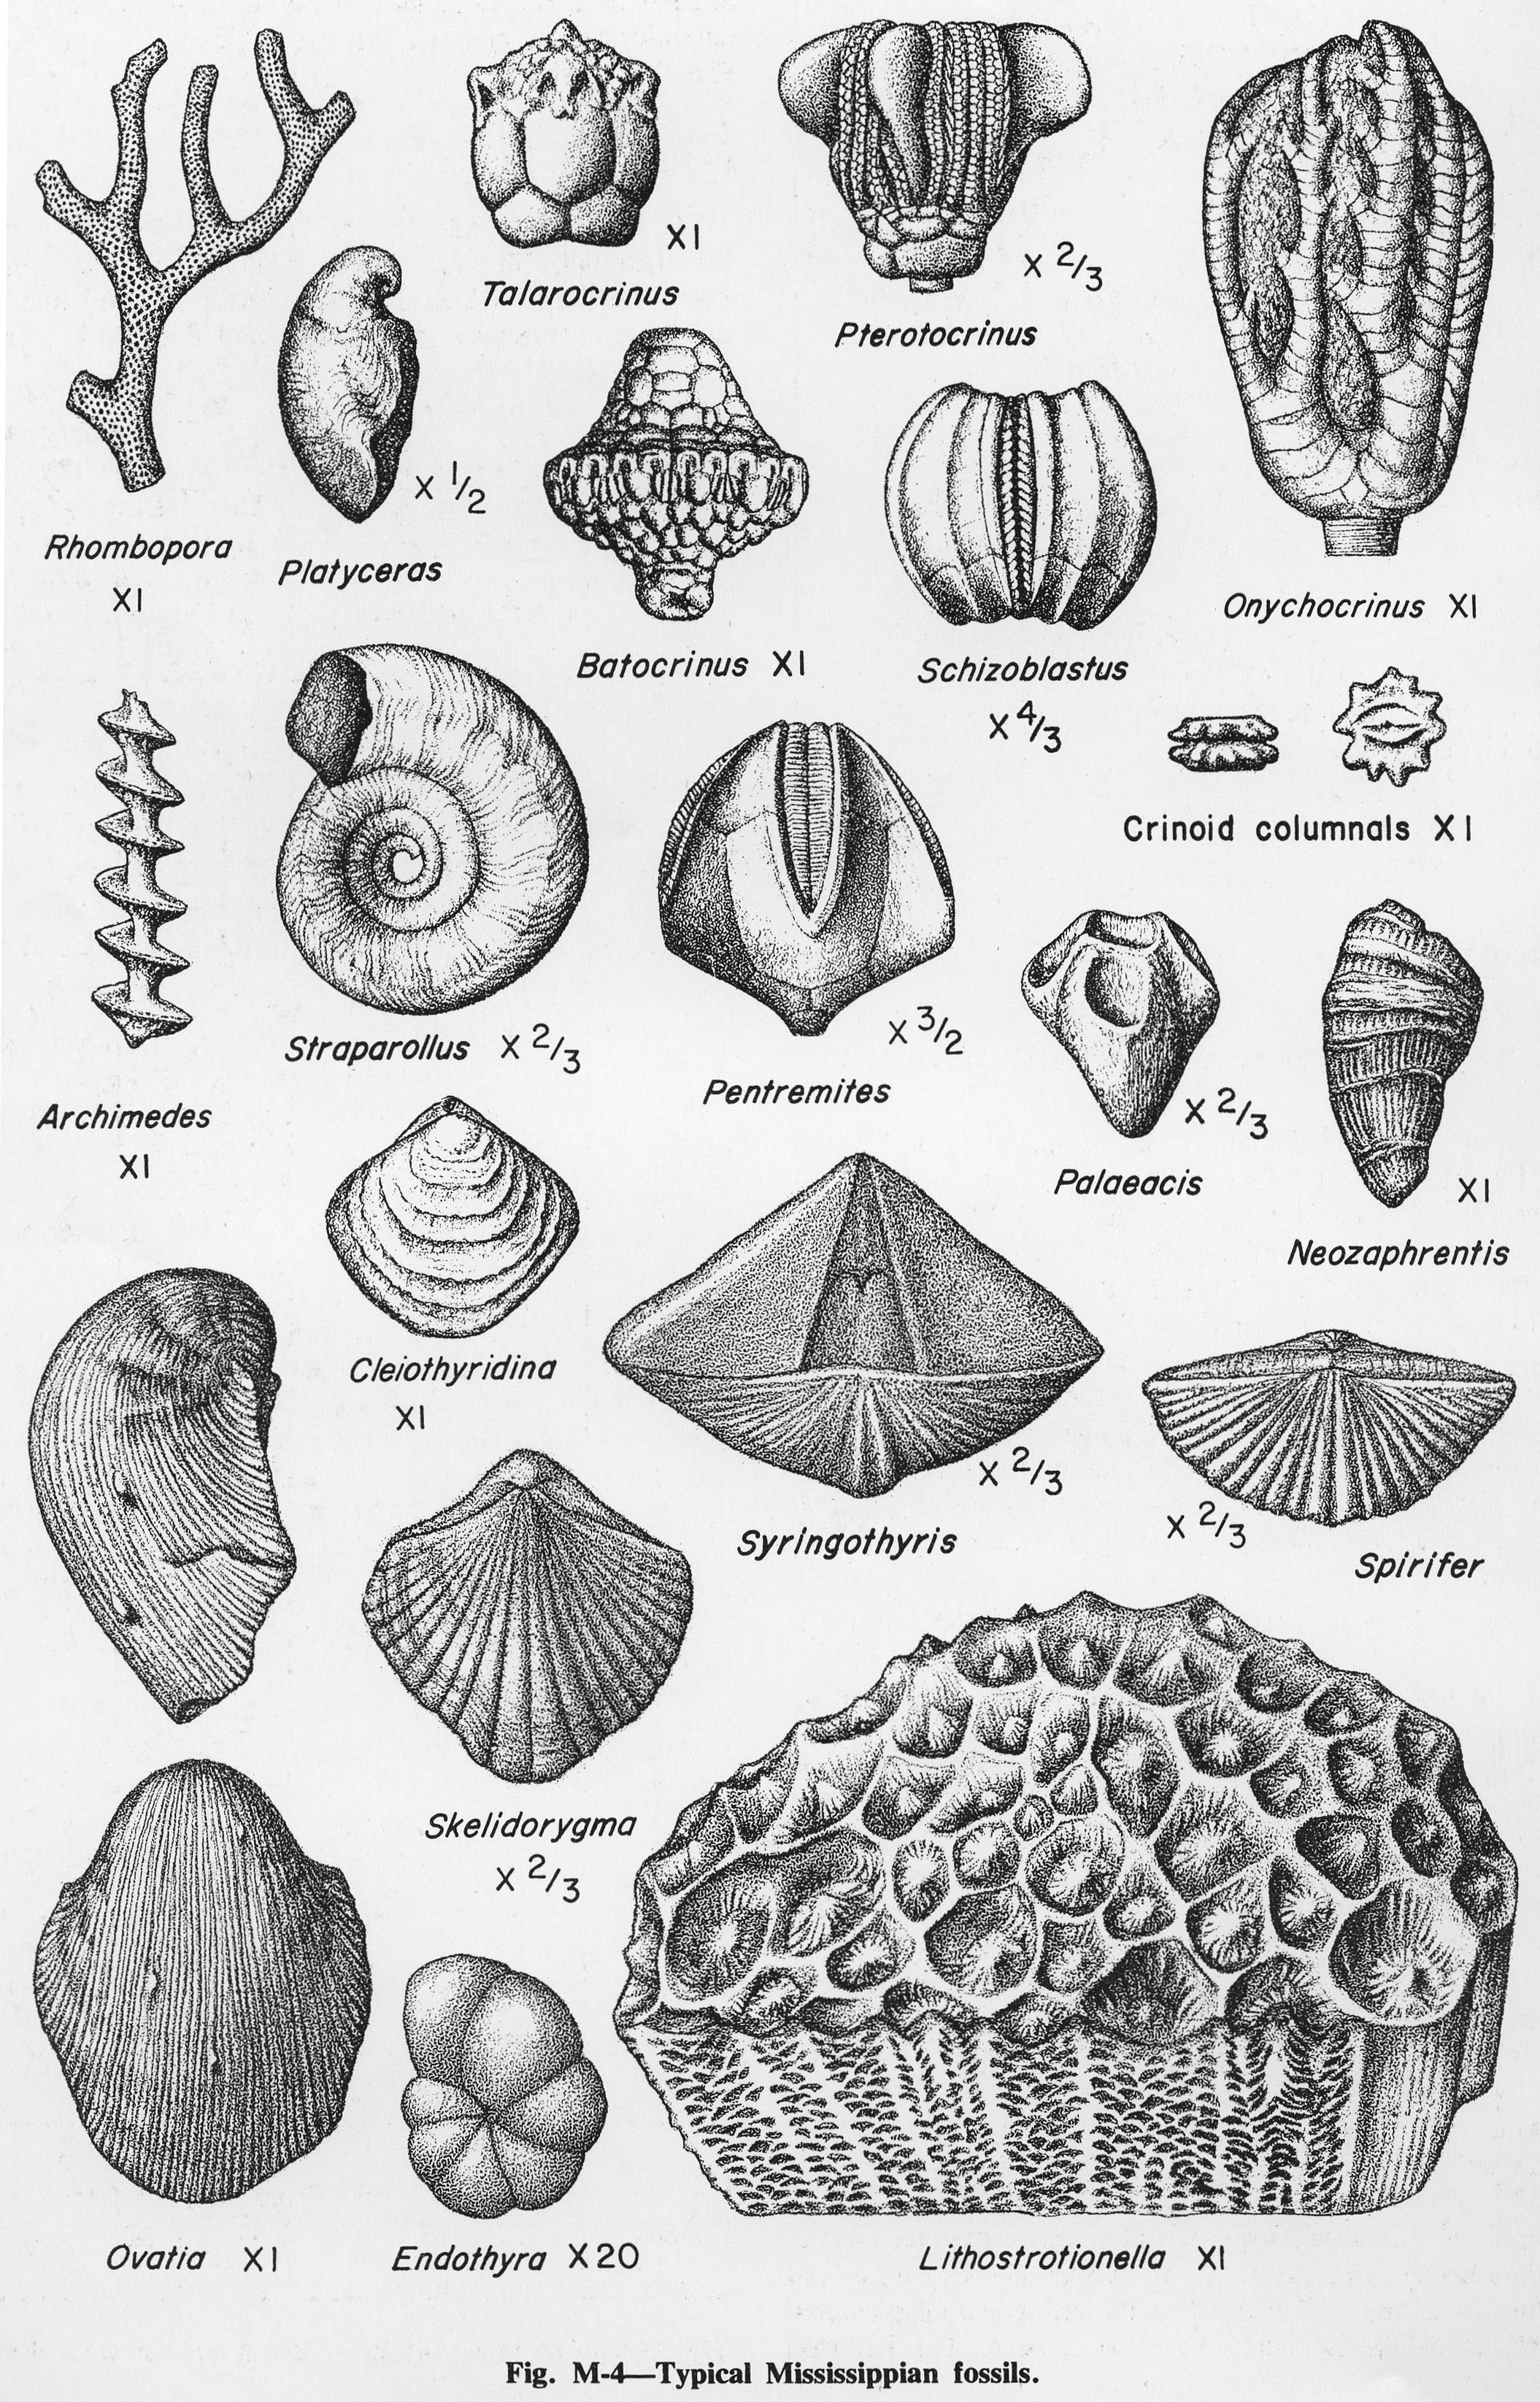
1.57 MB | Fig. M-4 -- Typical Mississippian fossils. | 1 |
| 13:24, 4 April 2016 | Figure M-5.jpg (file) |  |
257 KB | Fig. M-5 -- Thickness of the Kinderhookian Series. | 1 |
| 13:24, 4 April 2016 | Figure M-6.jpg (file) |  |
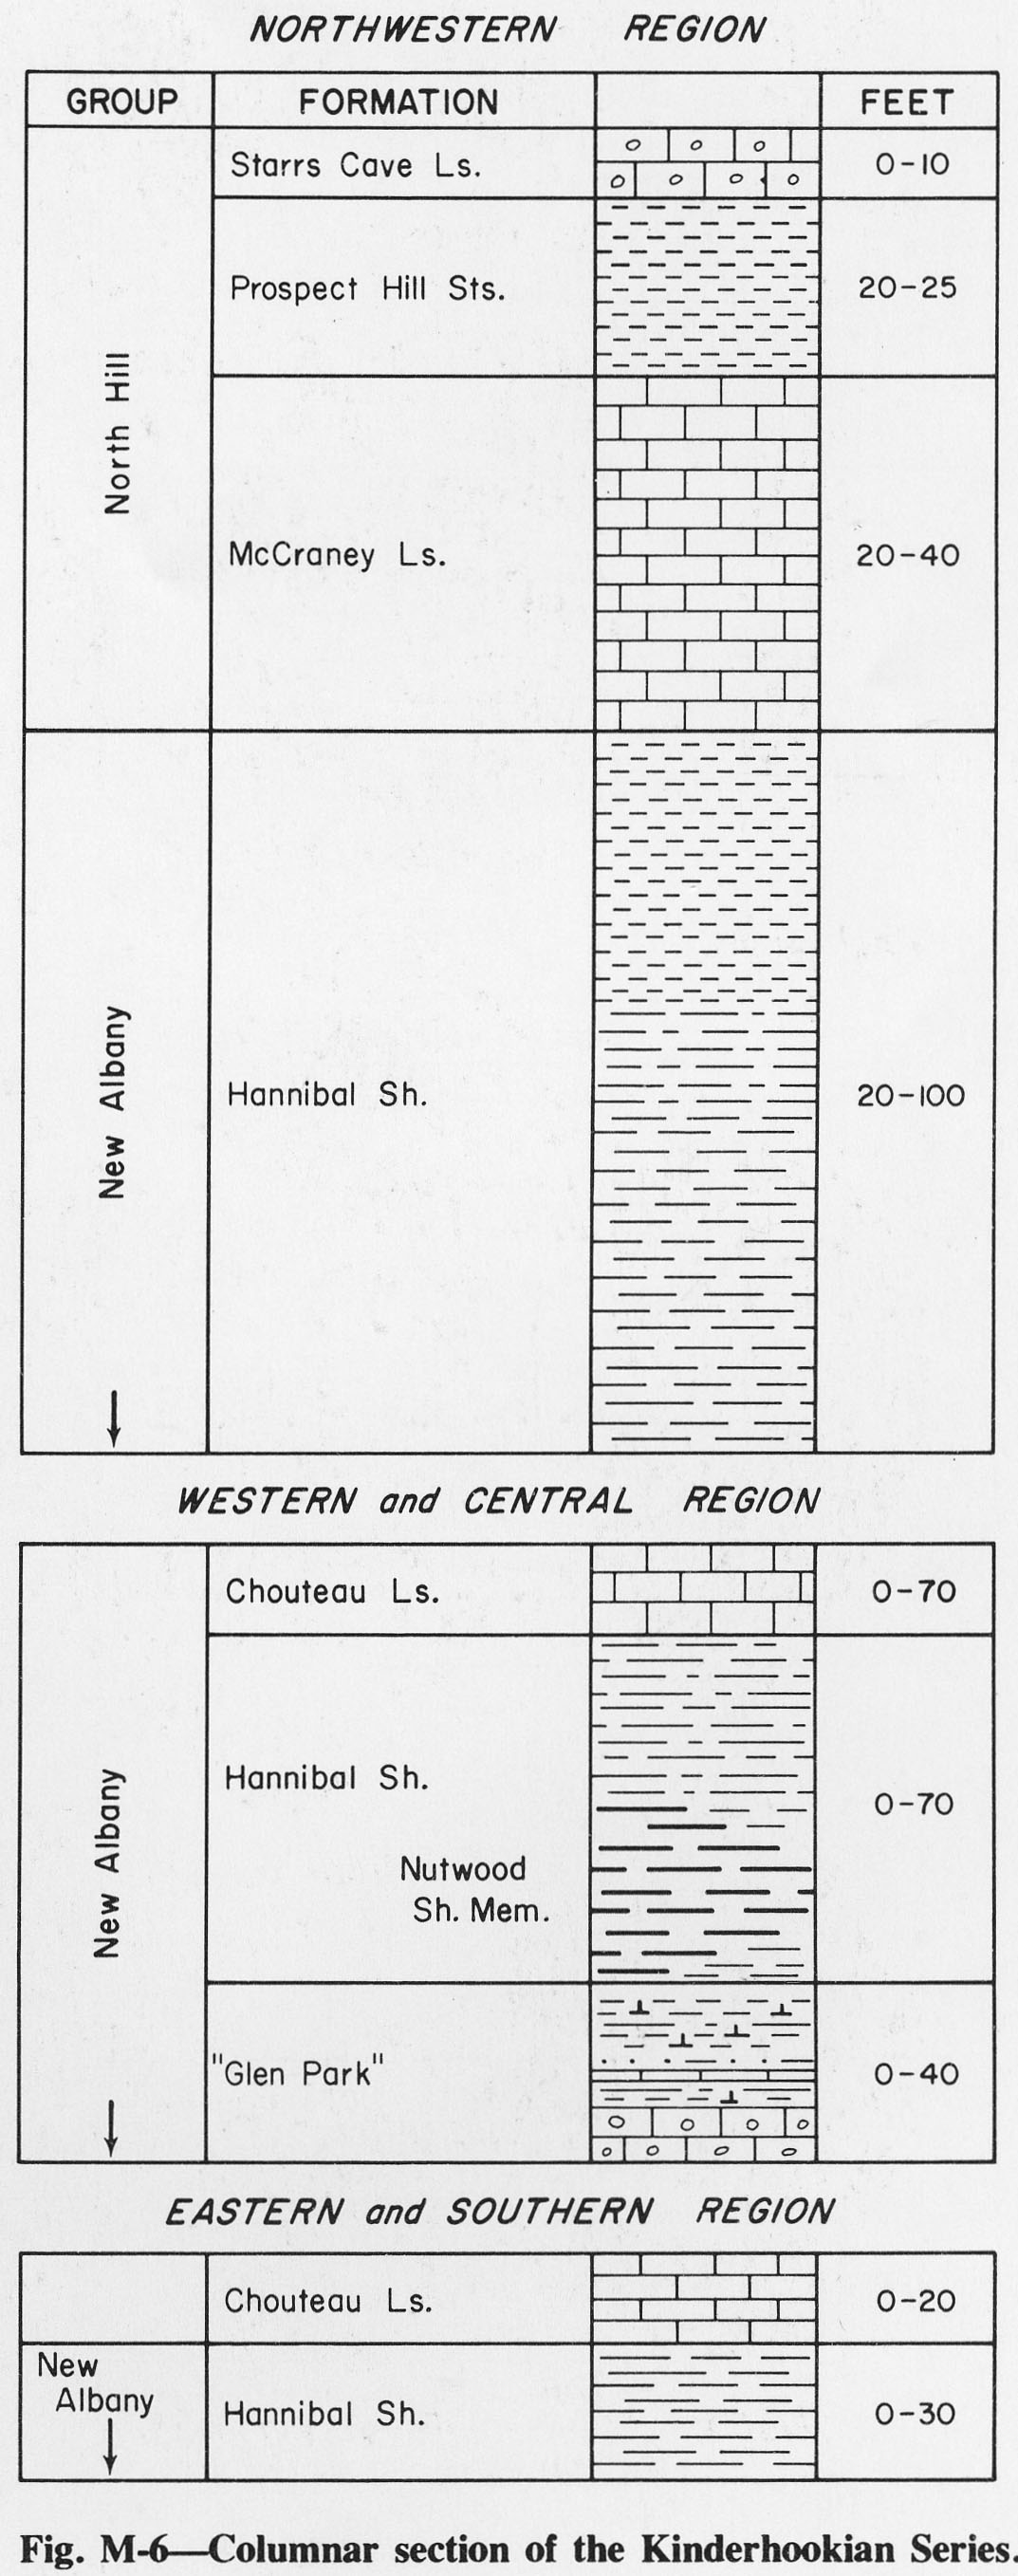
325 KB | Fig. M-6 -- Columnar section of the Kinderhookian Series. | 1 |
| 13:25, 4 April 2016 | Figure M-7.jpg (file) |  |
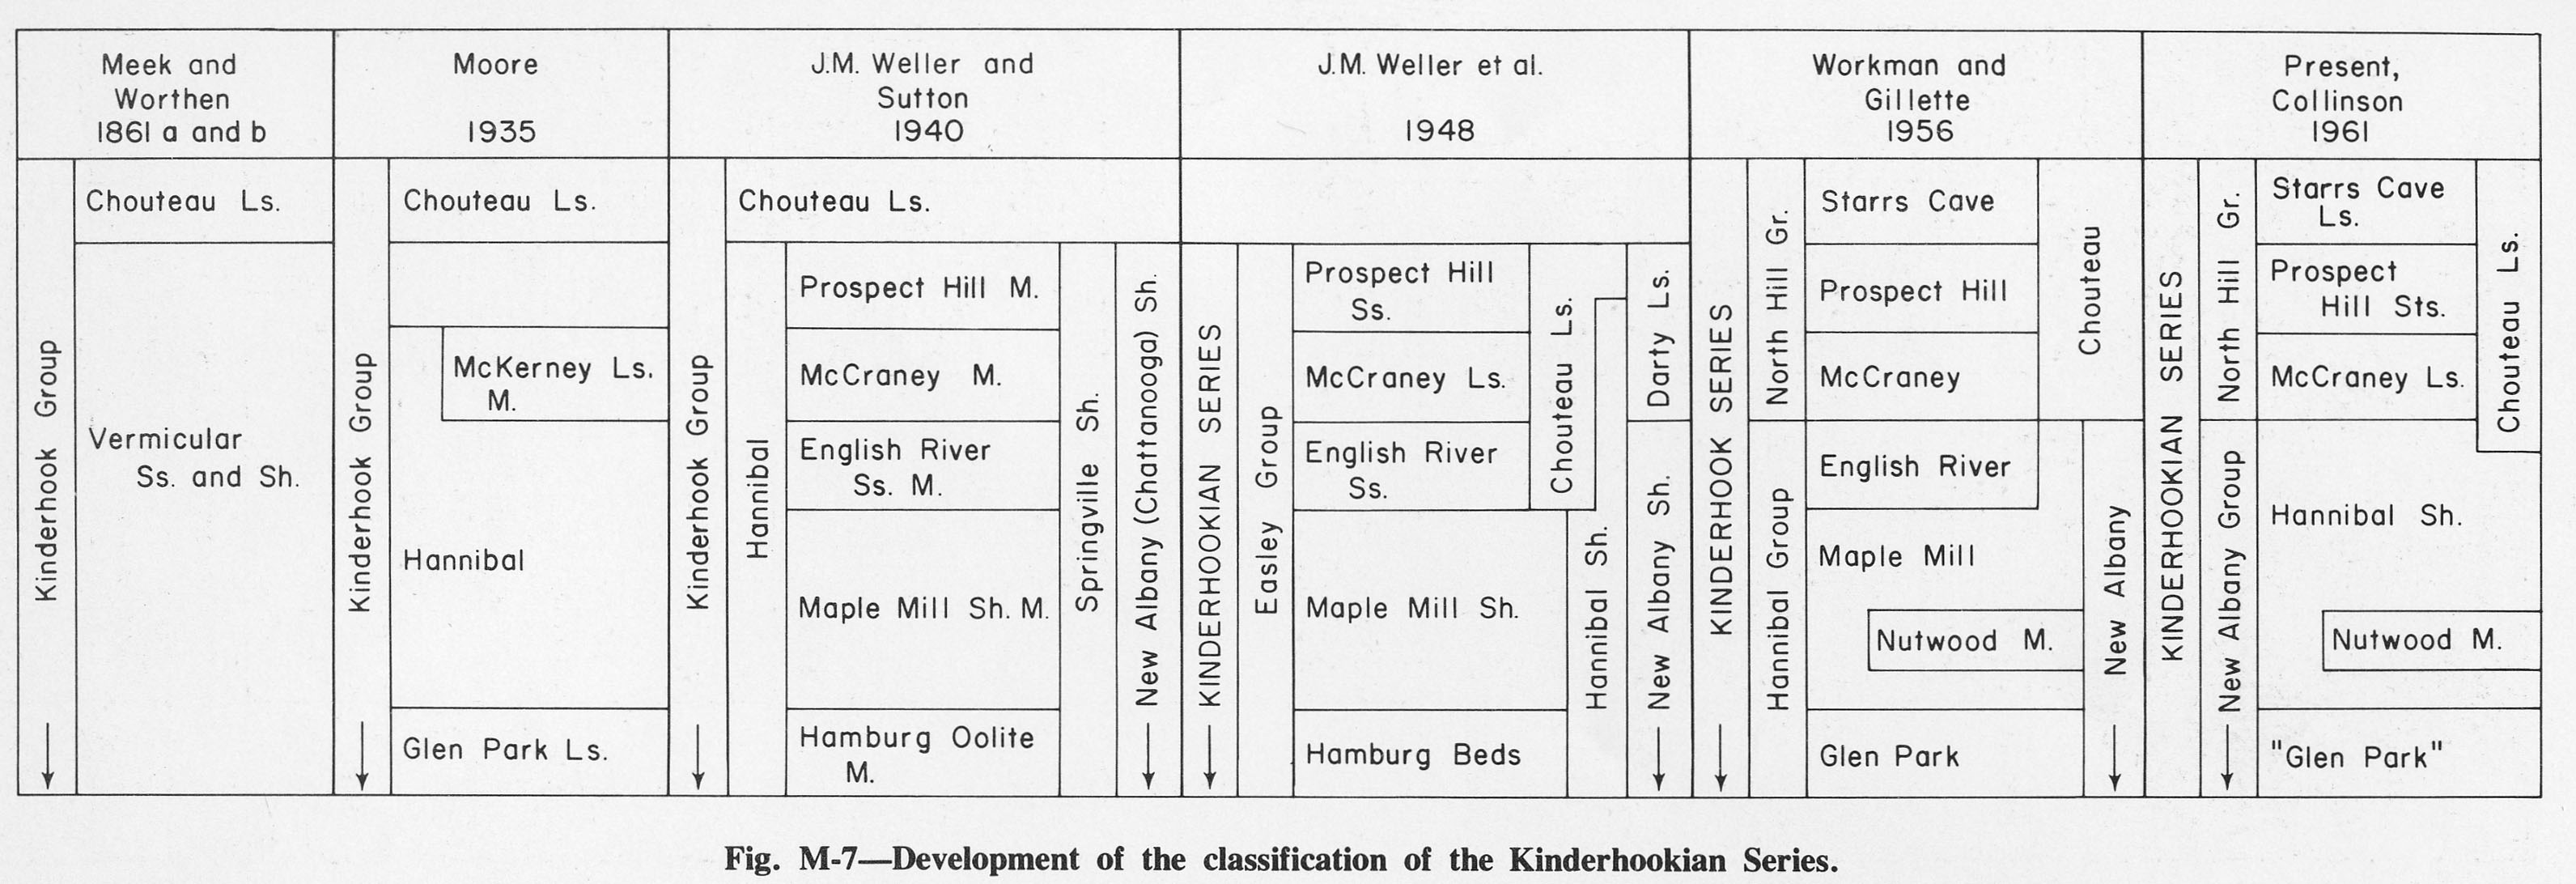
391 KB | Fig. M-7 -- Development of the classification of the Kinderhookian Series. | 1 |
| 13:30, 4 April 2016 | Figure M-8.jpg (file) |  |
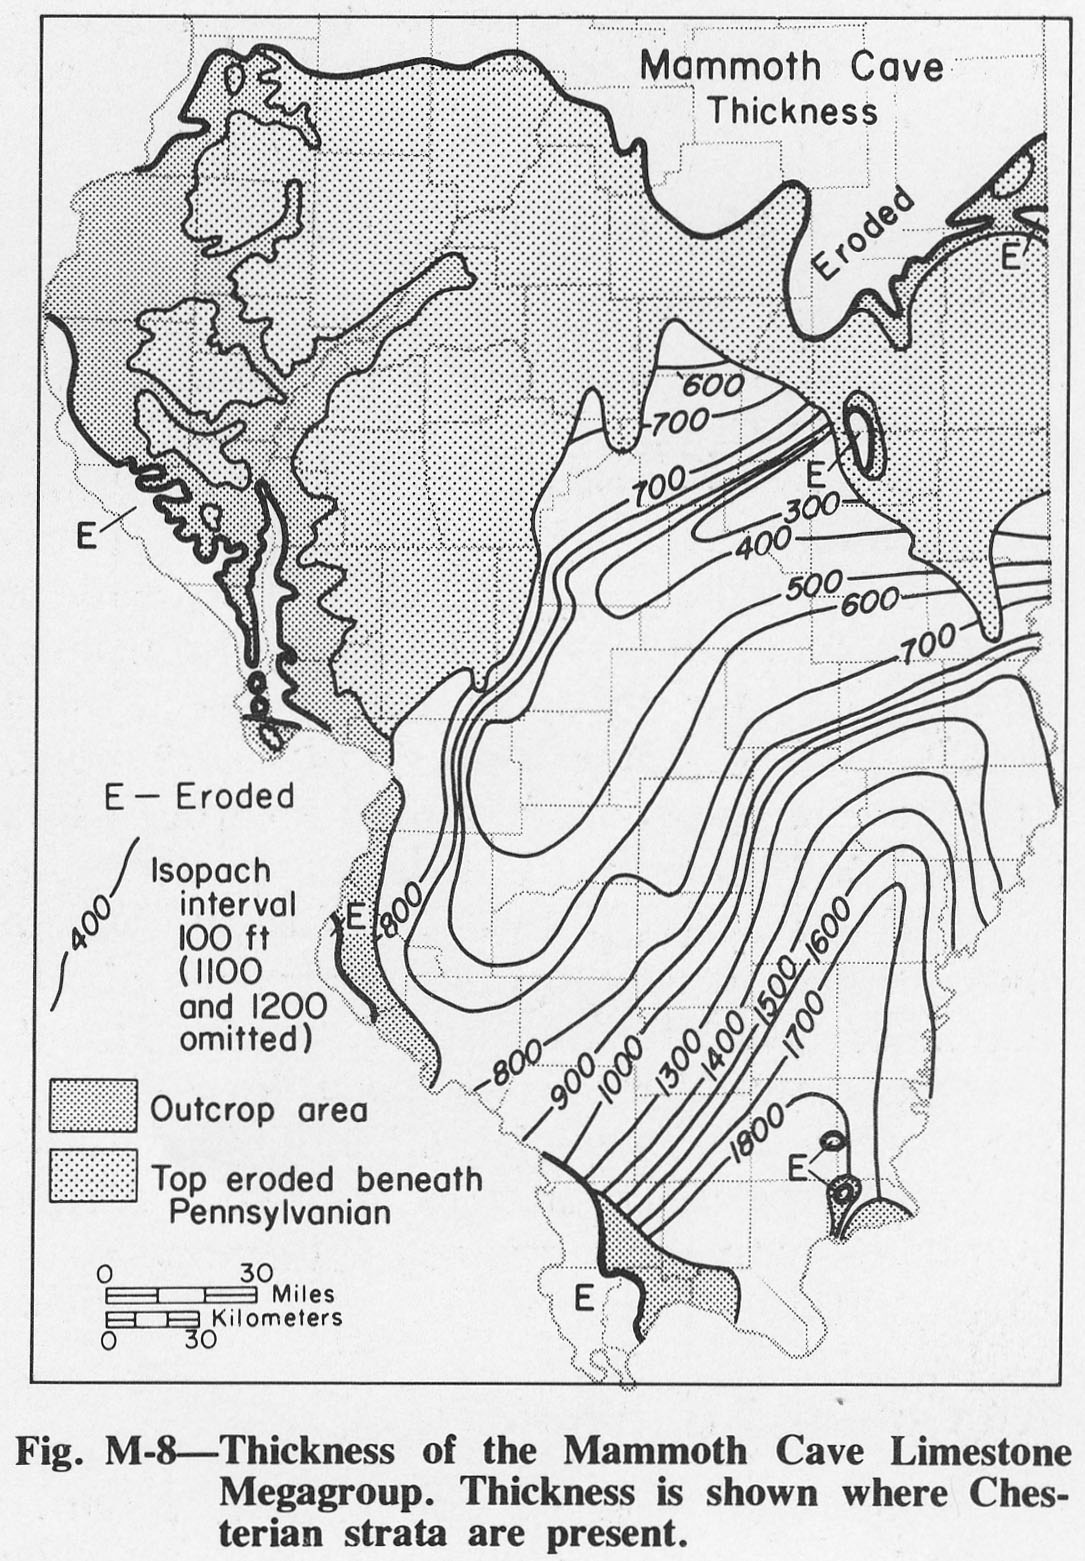
400 KB | Fig. M-8 -- Thickness of the Mammoth Cave Limestone Megagroup. Thickness is shown where Chesterian strata are present. | 1 |
| 13:53, 4 April 2016 | Figure M-9.jpg (file) |  |
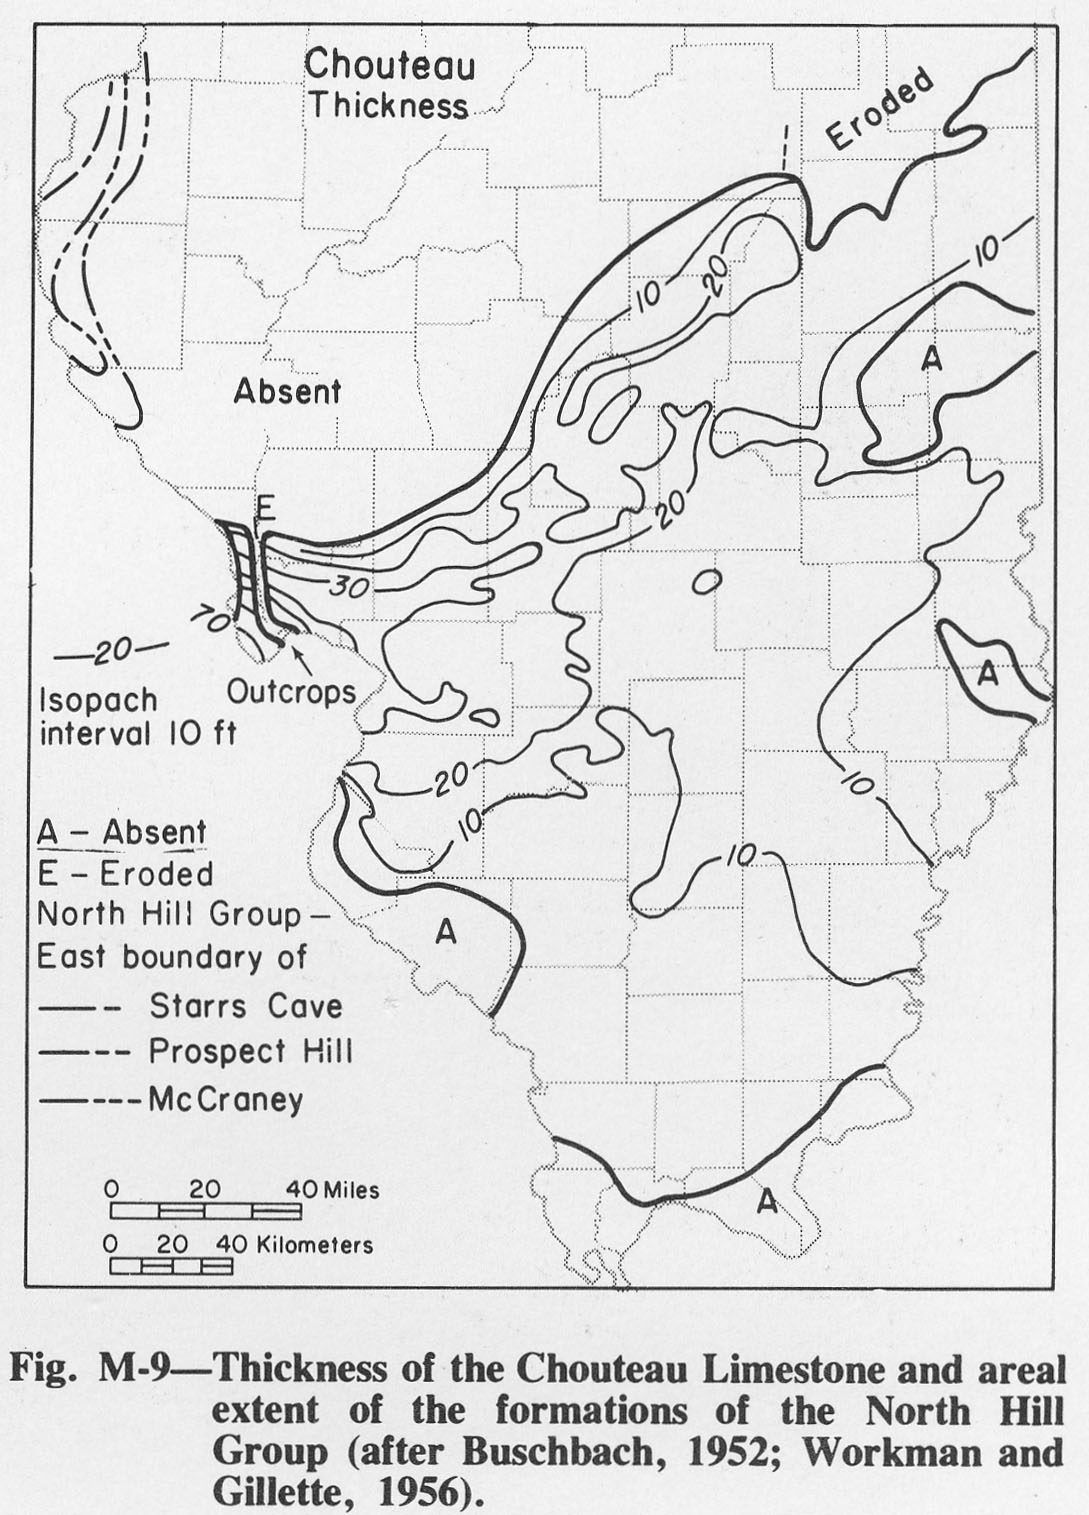
259 KB | Fig. M-9 -- Thickness of Chouteau Limestone and areal extent of formations of the North Hill Group (after Buschback, 1952; Workman and Gillete, 1956). | 1 |
| 13:54, 4 April 2016 | Figure M-10.jpg (file) |  |
362 KB | Fig. M-10 -- Thickness of the Valmeyeran Series. Thickness is shown where Chesterian strata are present. | 1 |
| 13:55, 4 April 2016 | Figure M-11.jpg (file) |  |
182 KB | Fig. M-11 -- Columnar section of the Valmeyeran Series in western Illinois. | 1 |
| 13:56, 4 April 2016 | Figure M-12.jpg (file) |  |
406 KB | Fig. M-12 -- Columnar section of the Valmeyeran Series in central Illinois. | 1 |
| 13:57, 4 April 2016 | Figure M-13.jpg (file) |  |
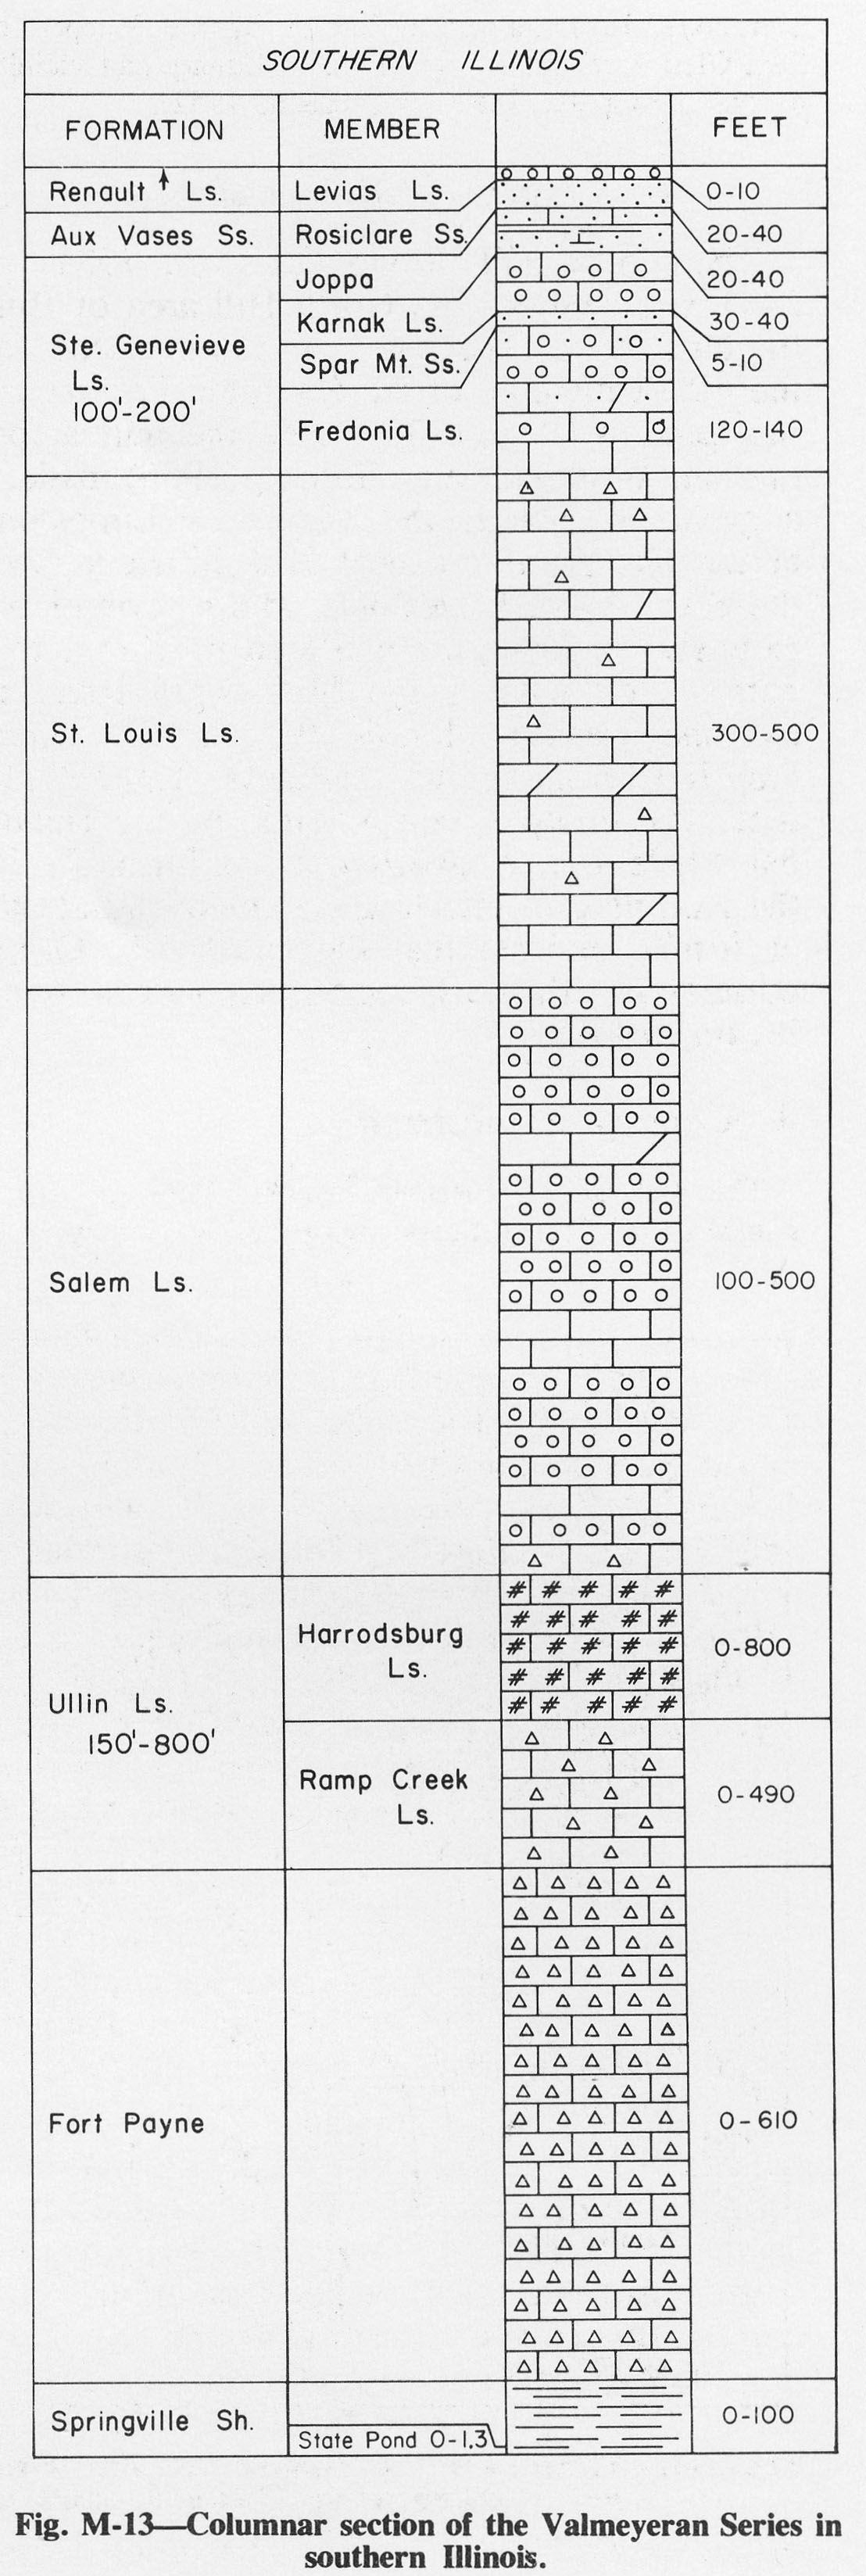
415 KB | Fig. M-13 -- Columnar section of the Valmeyeran Series in southern Illinois. | 1 |
| 13:58, 4 April 2016 | Figure M-14.jpg (file) |  |
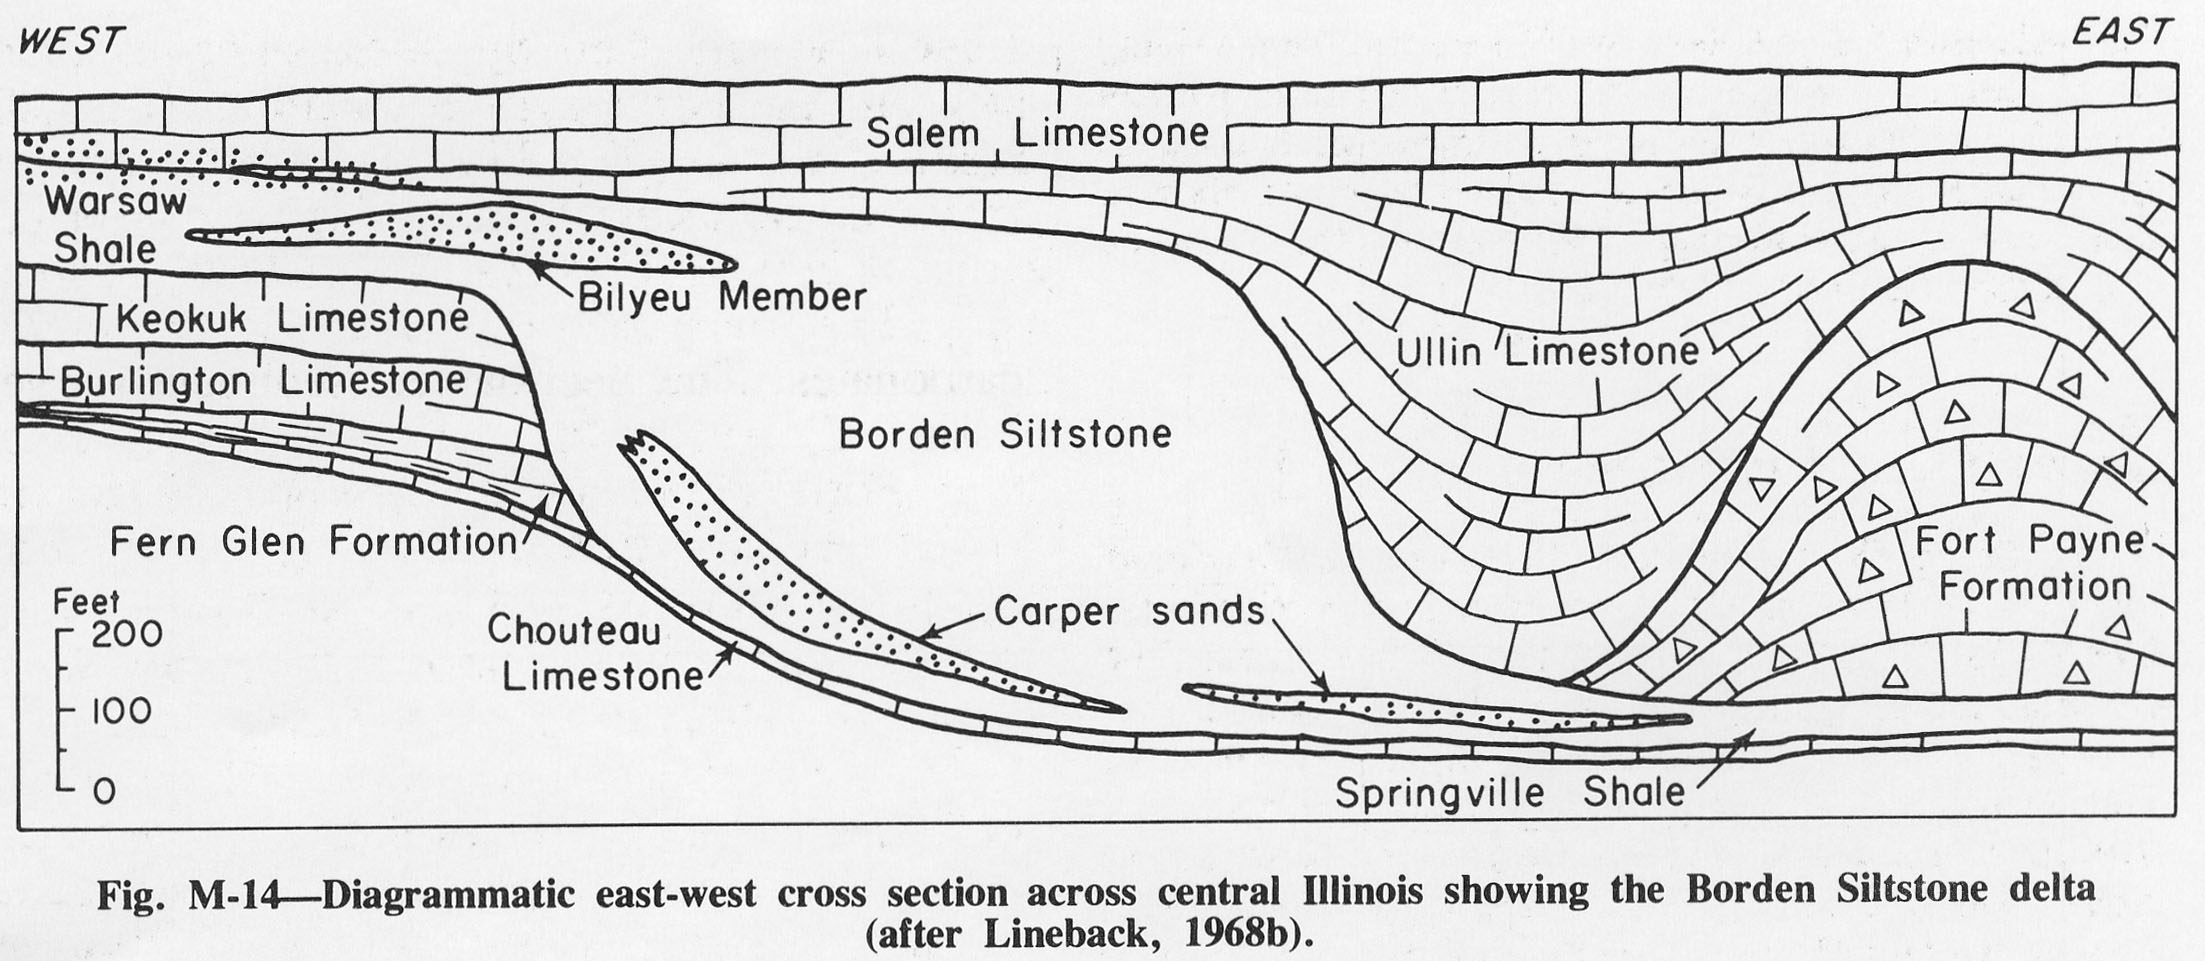
319 KB | Fig. M-14 -- Diagrammatic east-west cross section across central Illinois showing the Borden Siltstone delta (after Lineback, 1968b). | 1 |
| 13:59, 4 April 2016 | Figure M-15.jpg (file) |  |
847 KB | Fig M-15 -- Development of the classification of the Valmeyeran Series. | 1 |
| 14:00, 4 April 2016 | Figure M-16.jpg (file) |  |
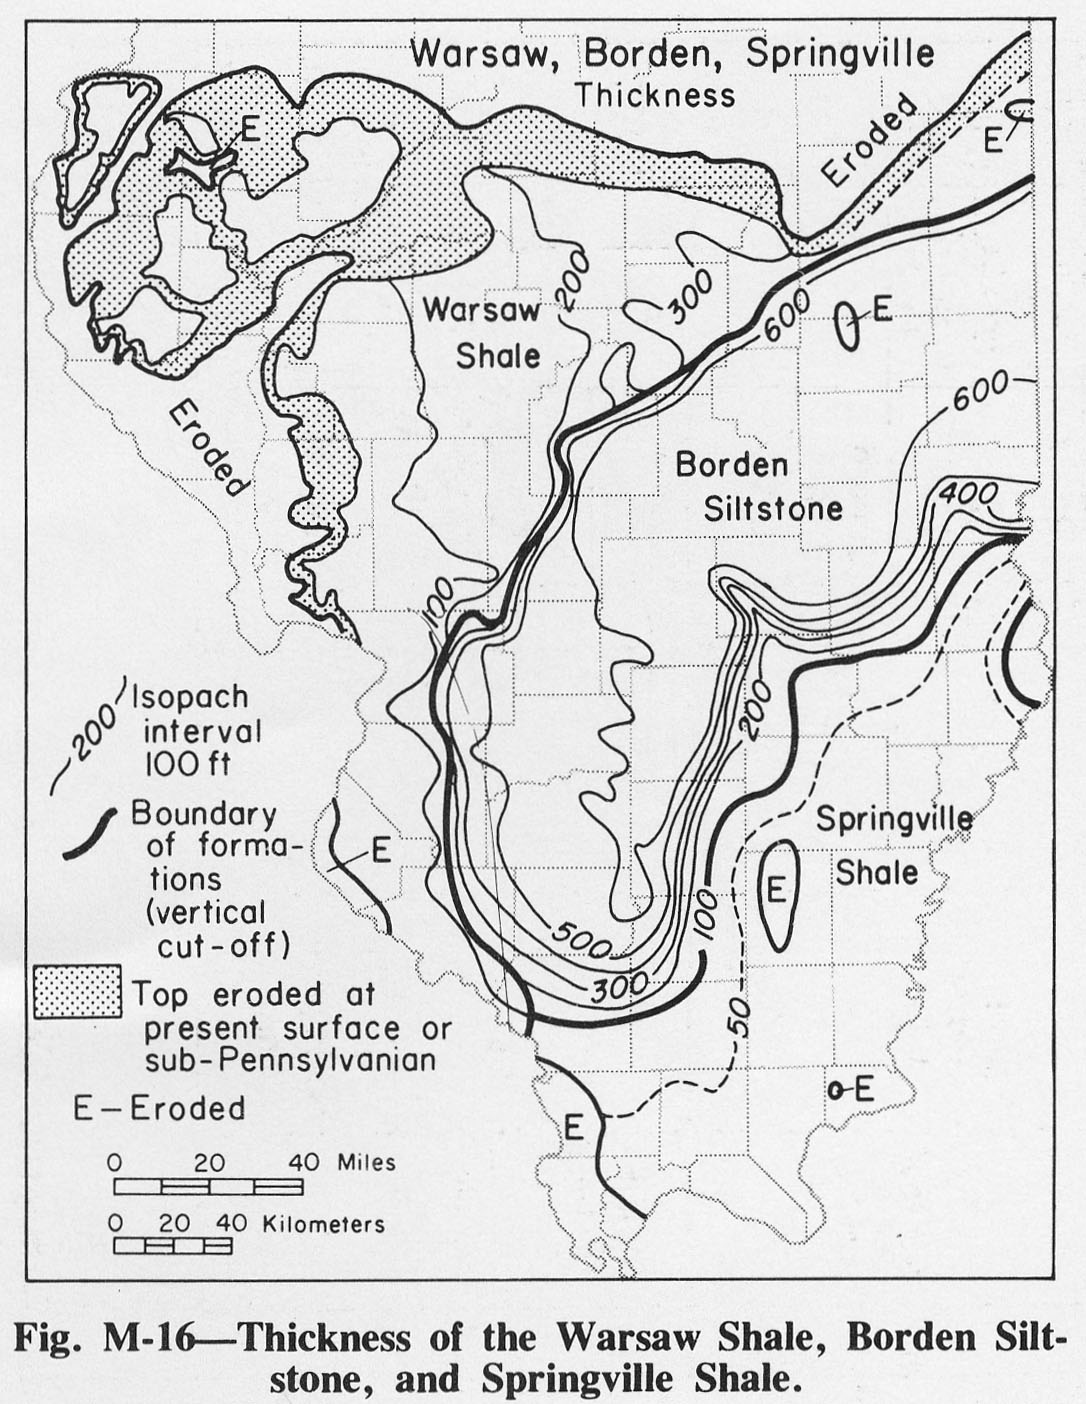
306 KB | Fig. M-16 -- Thickness of the Warsaw Shale, Borden Siltstone, and Springville Shale. | 1 |
| 14:01, 4 April 2016 | Figure M-17.jpg (file) |  |
251 KB | Fig. M-17 -- Thickness of Burlington Limestone. | 1 |
| 14:01, 4 April 2016 | Figure M-18.jpg (file) |  |
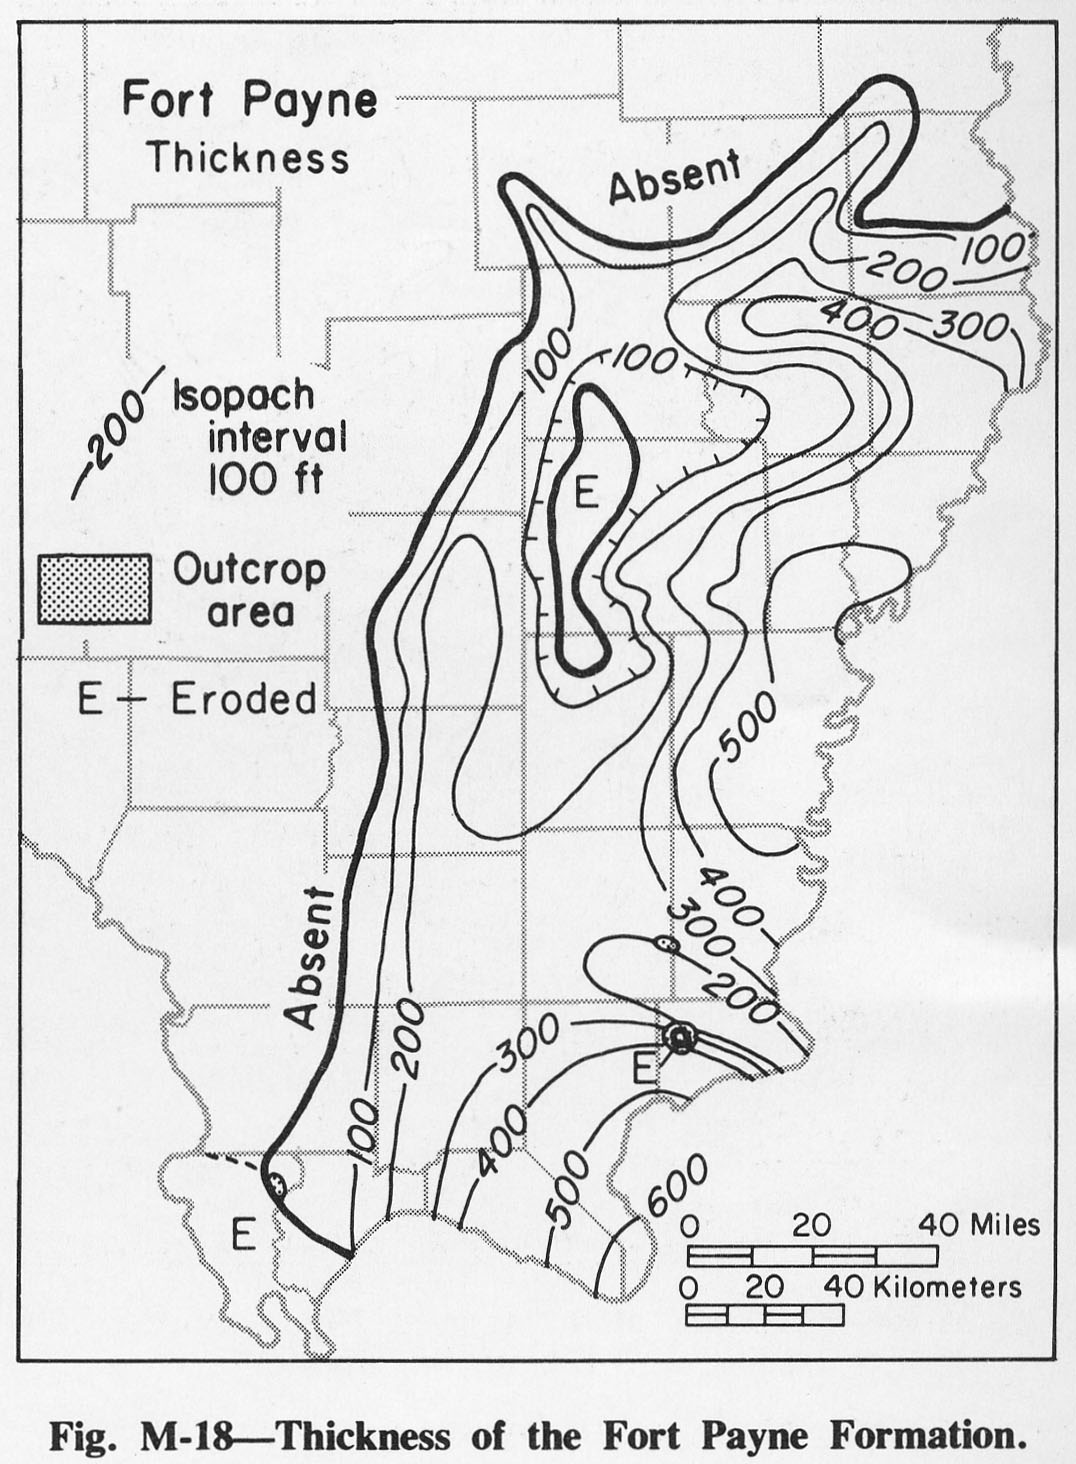
254 KB | Fig M-18 -- Thickness of the Fort Payne Formation. | 1 |
| 14:02, 4 April 2016 | Figure M-19.jpg (file) |  |
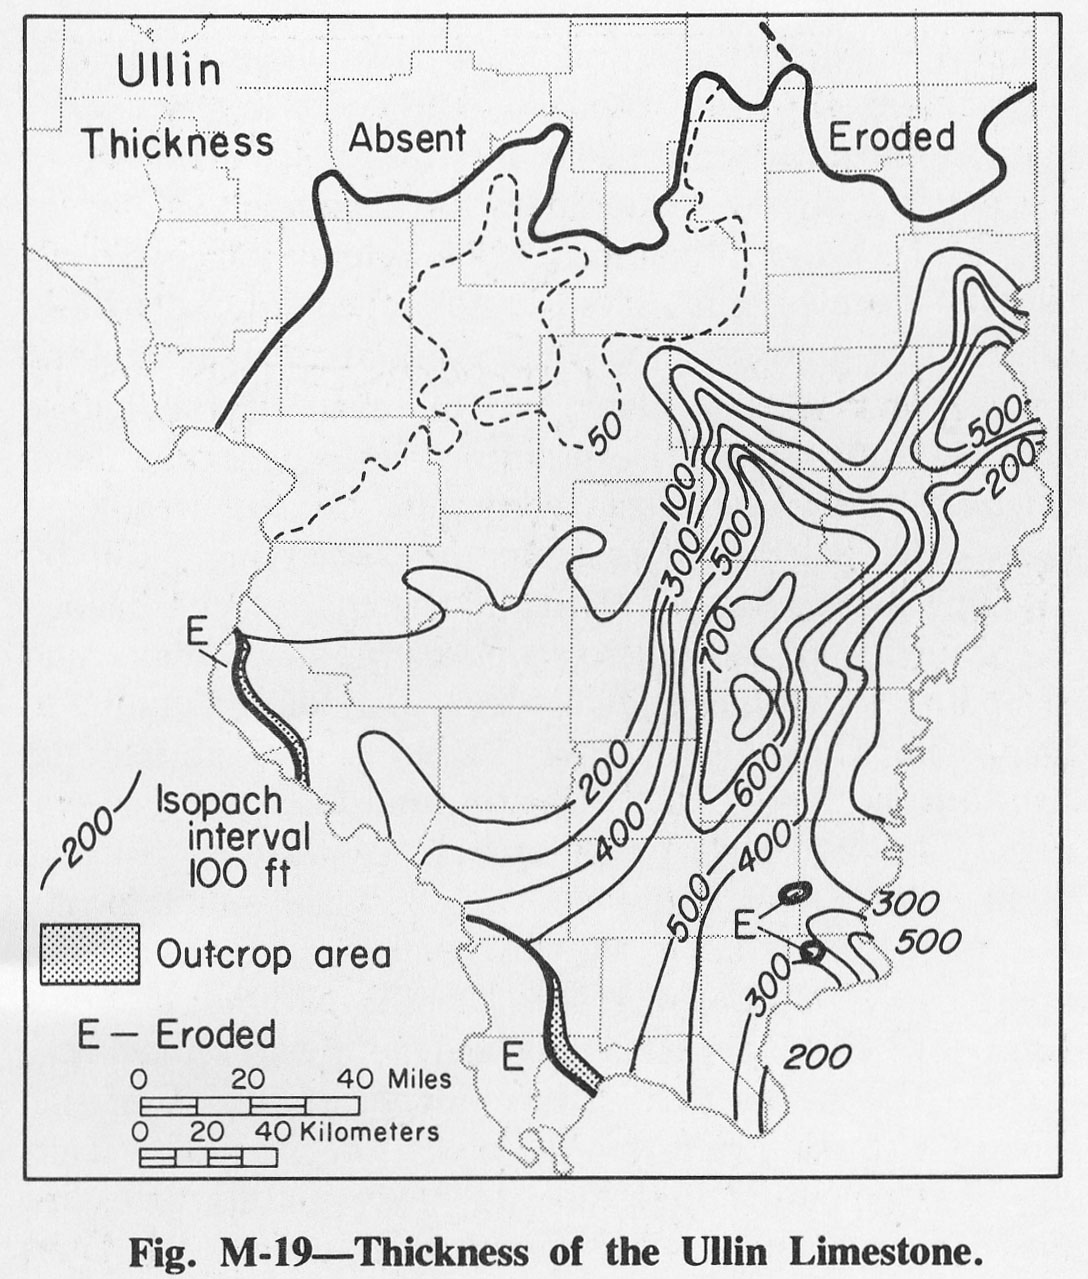
285 KB | Fig. M-19 -- Thickness of the Ullin Limestone. | 1 |
| 14:03, 4 April 2016 | Figure M-20.jpg (file) |  |
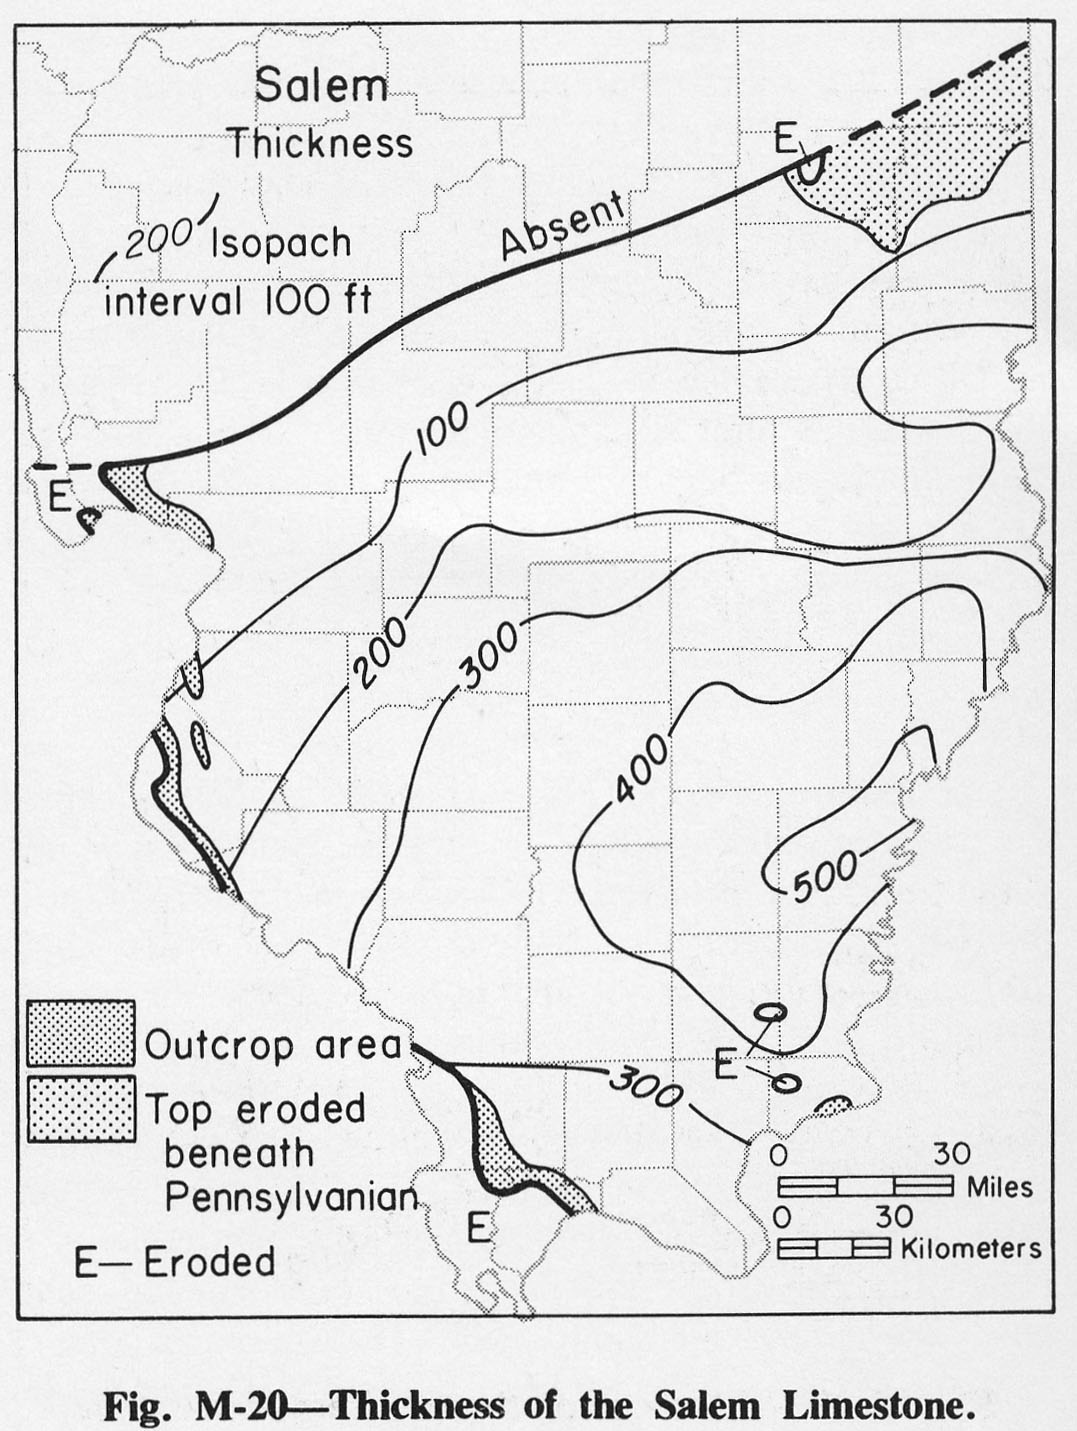
248 KB | Fig. M-20 -- Thickness of the Salem Limestone. | 1 |
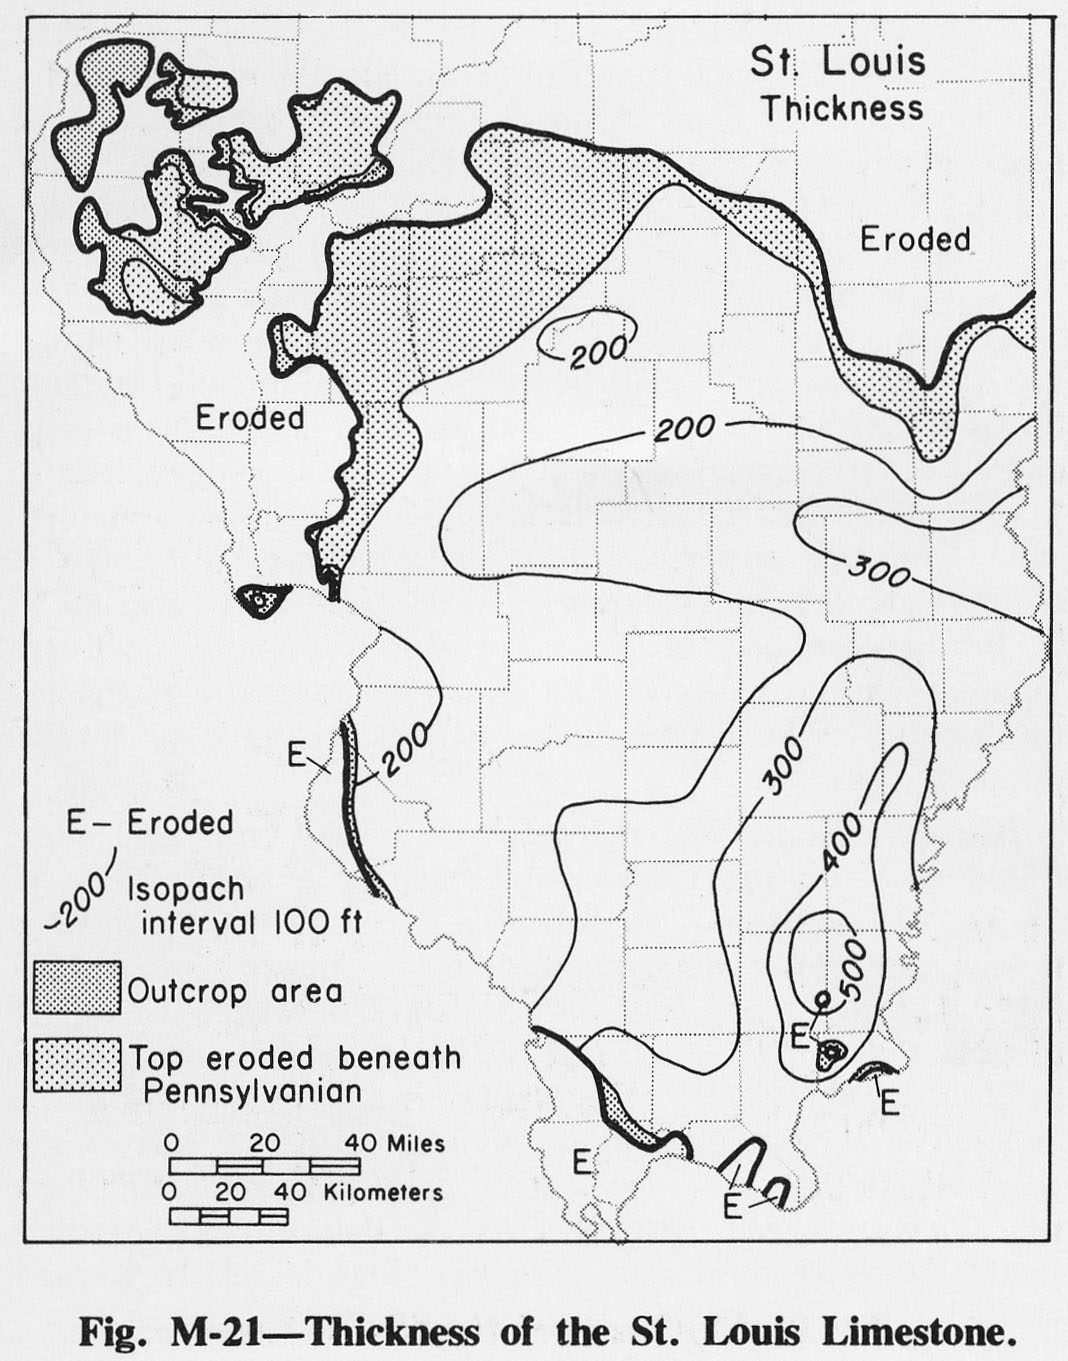
| 14:03, 4 April 2016 | Figure M-21.jpg (file) |  |
253 KB | Fig. M-21 -- THickness of the St. Louis Limestone. | 1 |
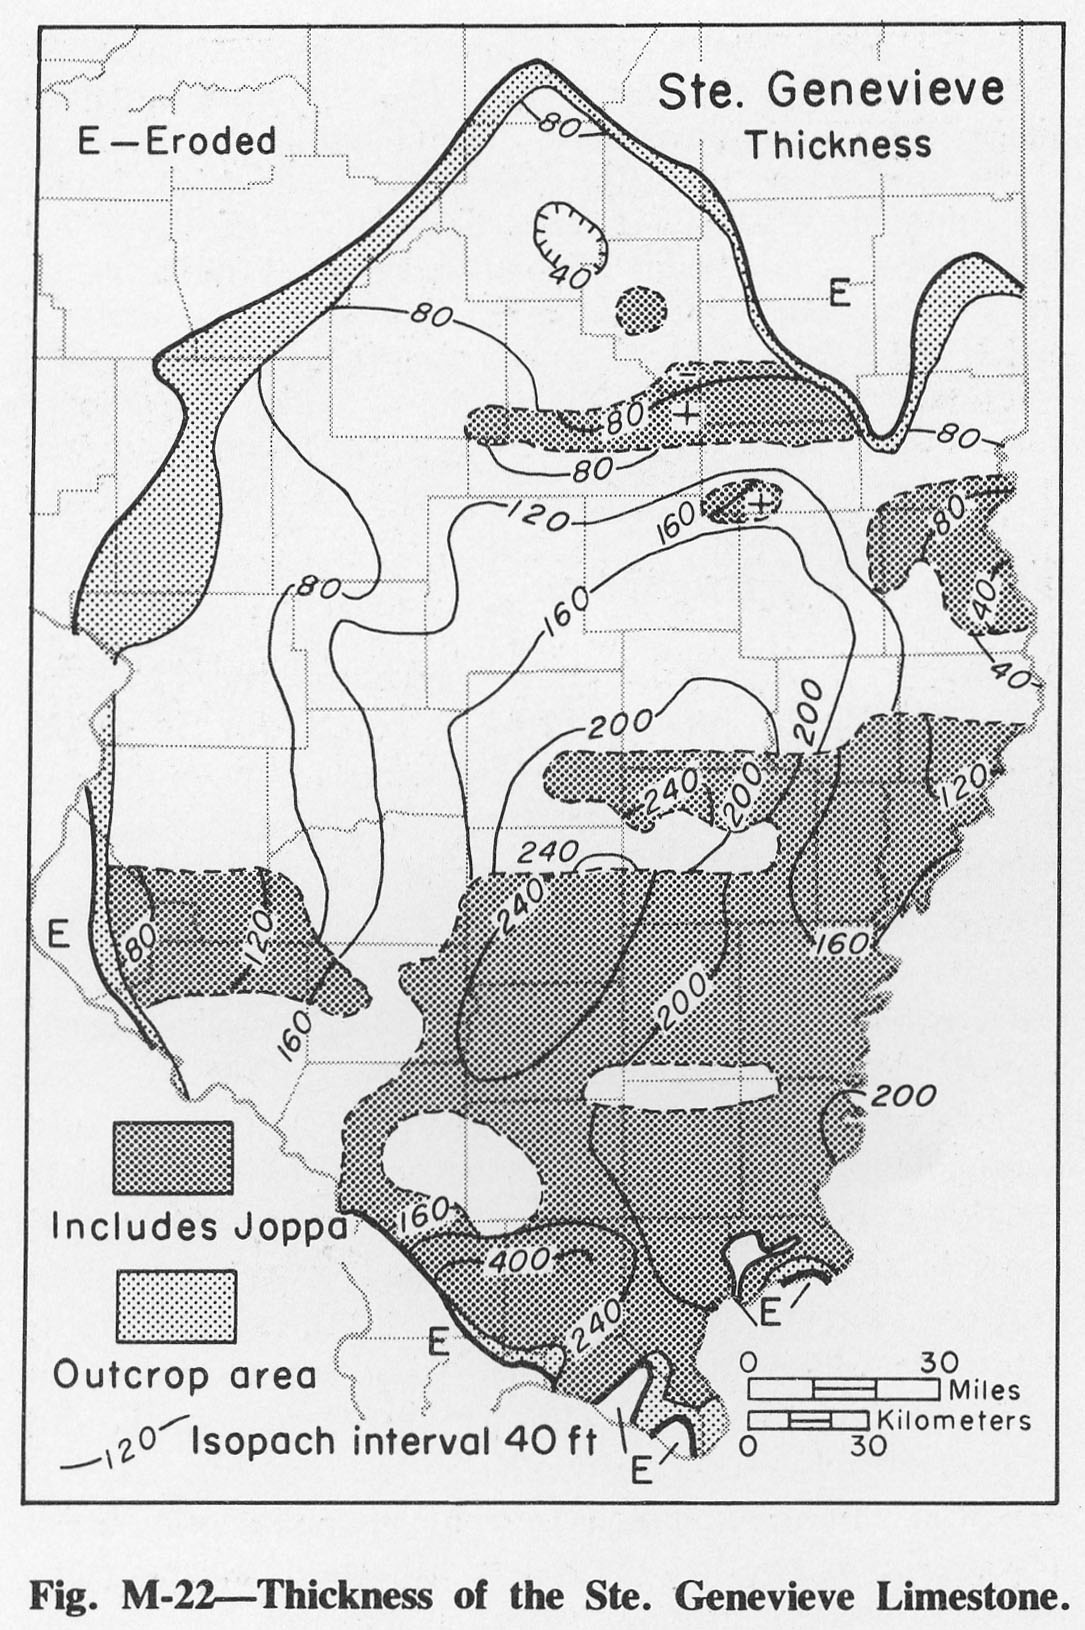
| 14:05, 4 April 2016 | Figure M-22.jpg (file) |  |
378 KB | Fig. M-22 -- Thickness of the Ste. Genevieve Limestone. | 1 |
| 14:05, 4 April 2016 | Figure M-23.jpg (file) |  |
386 KB | Fig. M-23 -- Thickness of the Aux Vases Sandstone. | 1 |
| 14:06, 4 April 2016 | Figure M-24.jpg (file) |  |
233 KB | Fig. M-24 -- Thickness of the Renault Limestone. | 1 |
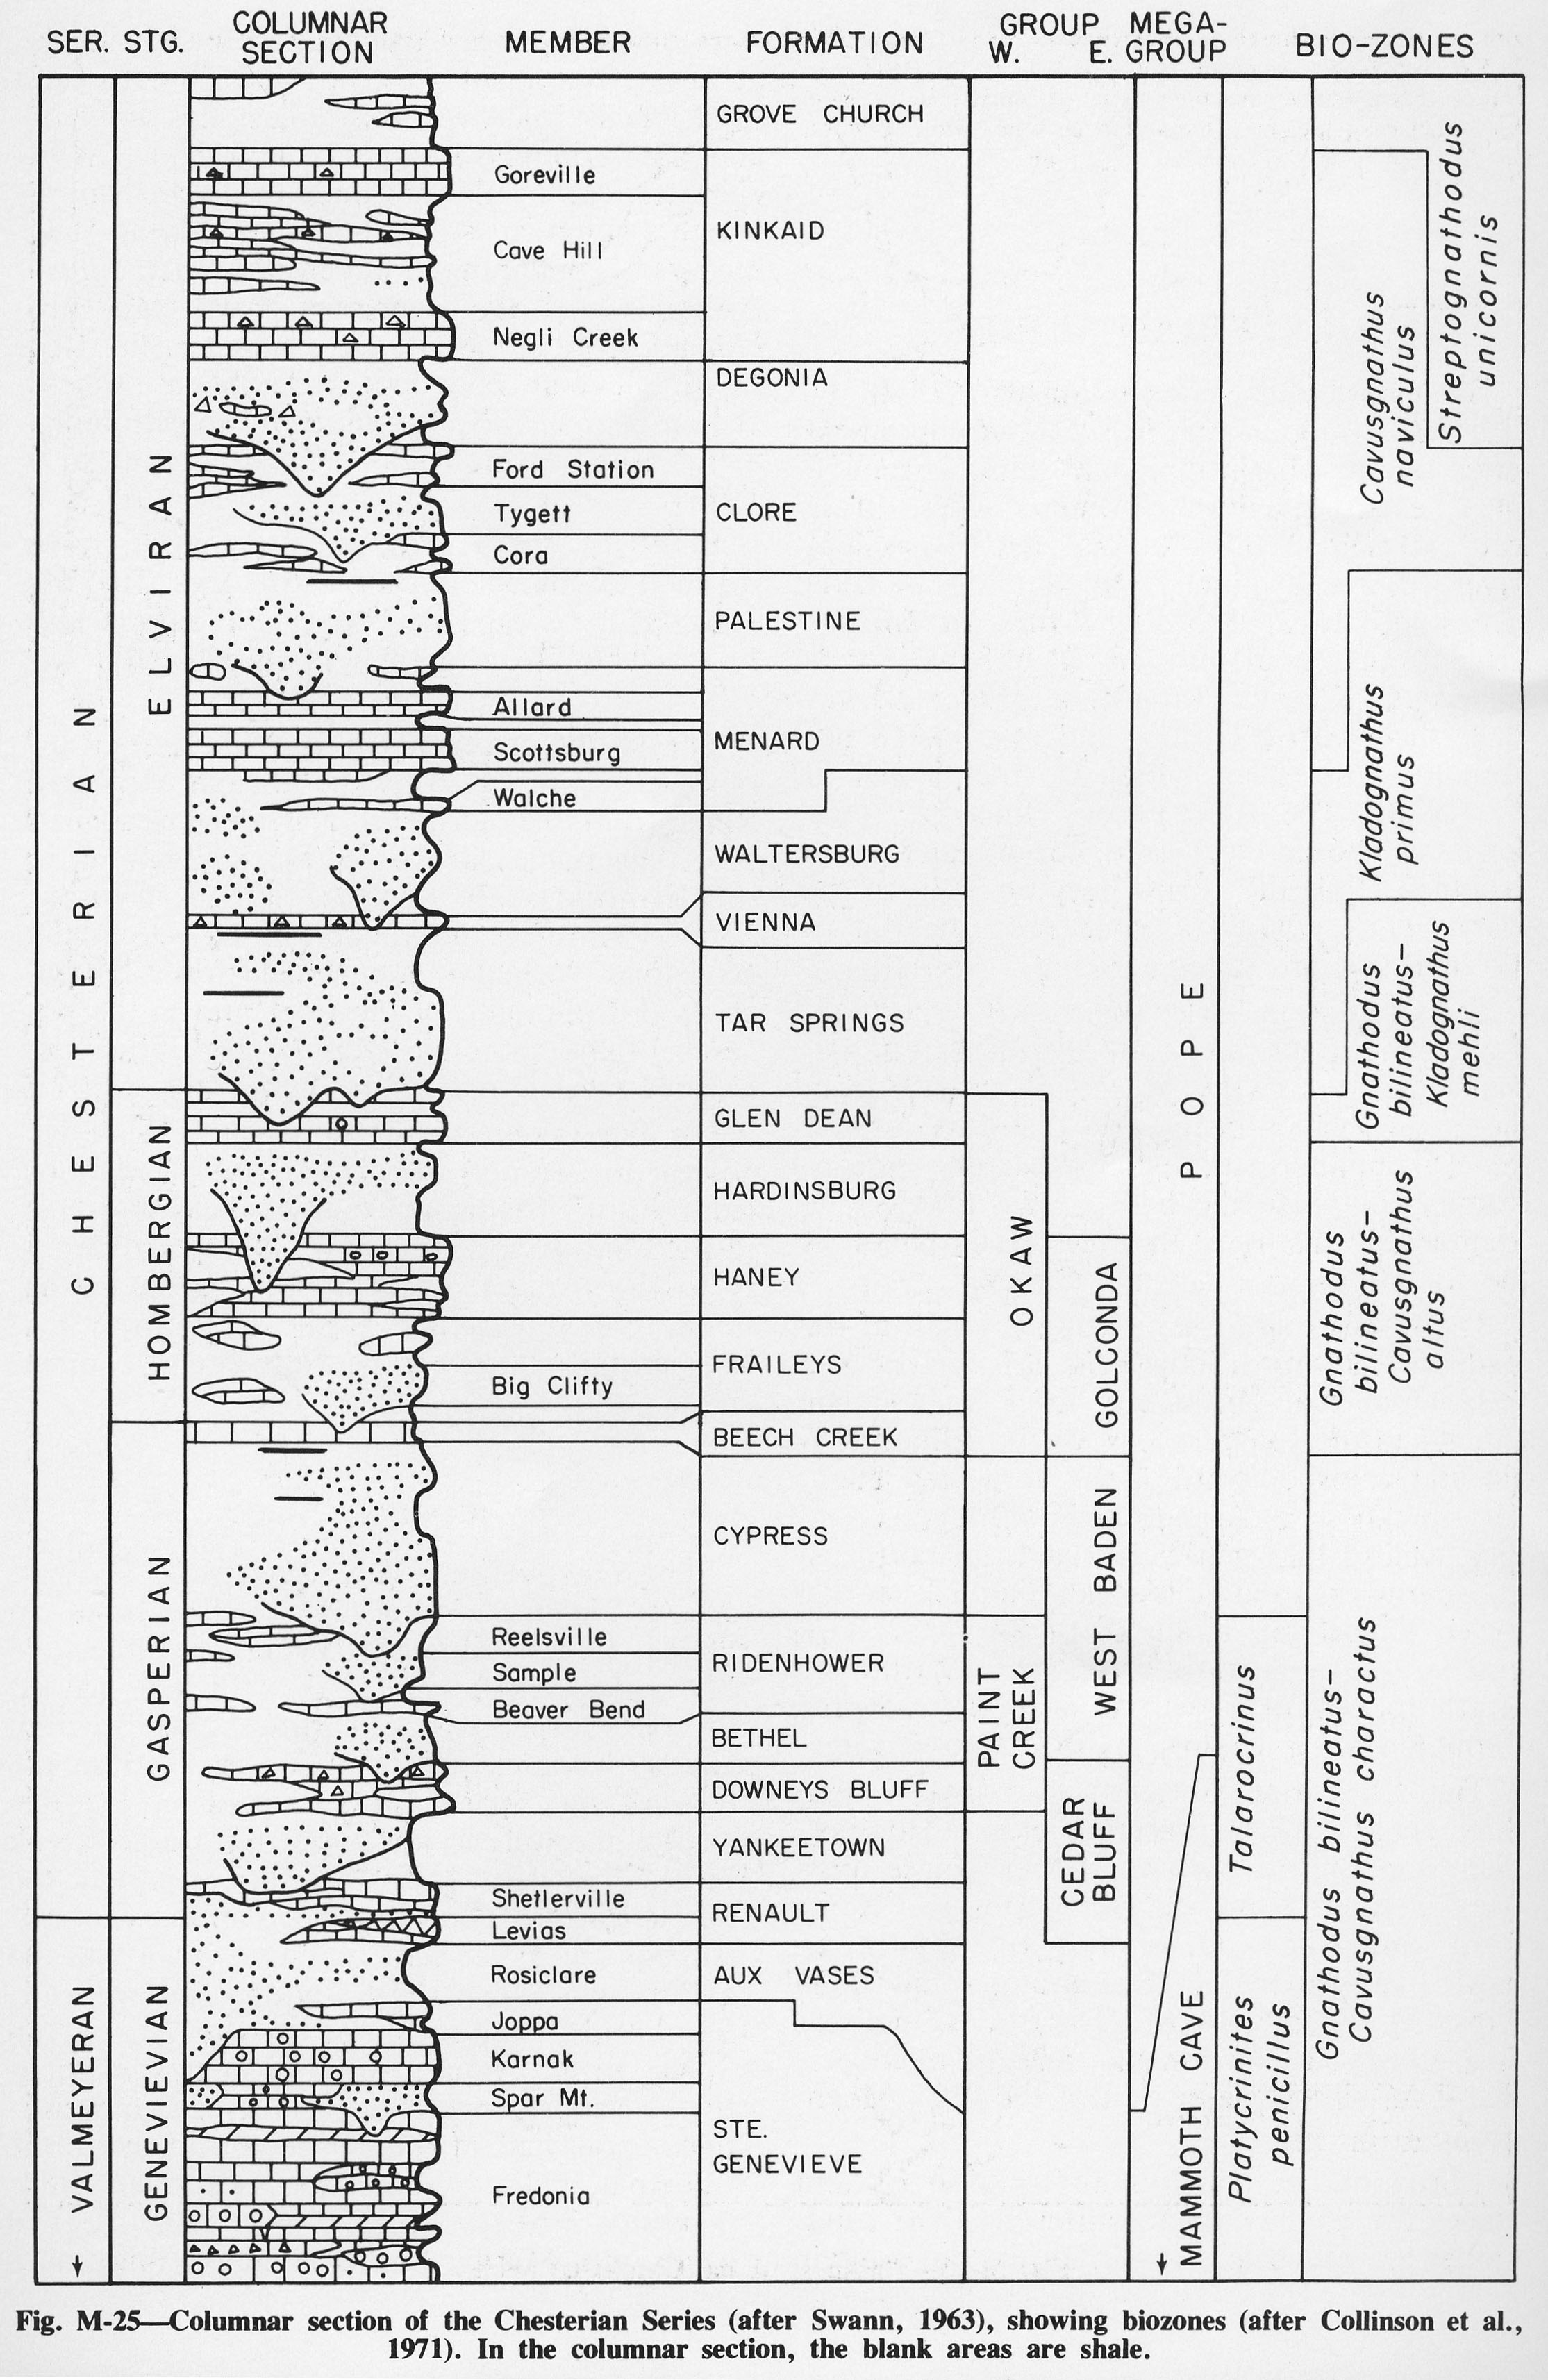
| 14:08, 4 April 2016 | Figure M-25.jpg (file) |  |
930 KB | Fig. M-25 -- Columnar section of the Chesterian Series (after Swan, 1963), showing biozones (after Collinson et al., 1971). In the columnar section, the blank areas are shale. | 1 |
| 14:08, 4 April 2016 | Figure M-26.jpg (file) |  |
923 KB | Fig. M-26 -- Thickness of the Chesterian Series. | 1 |
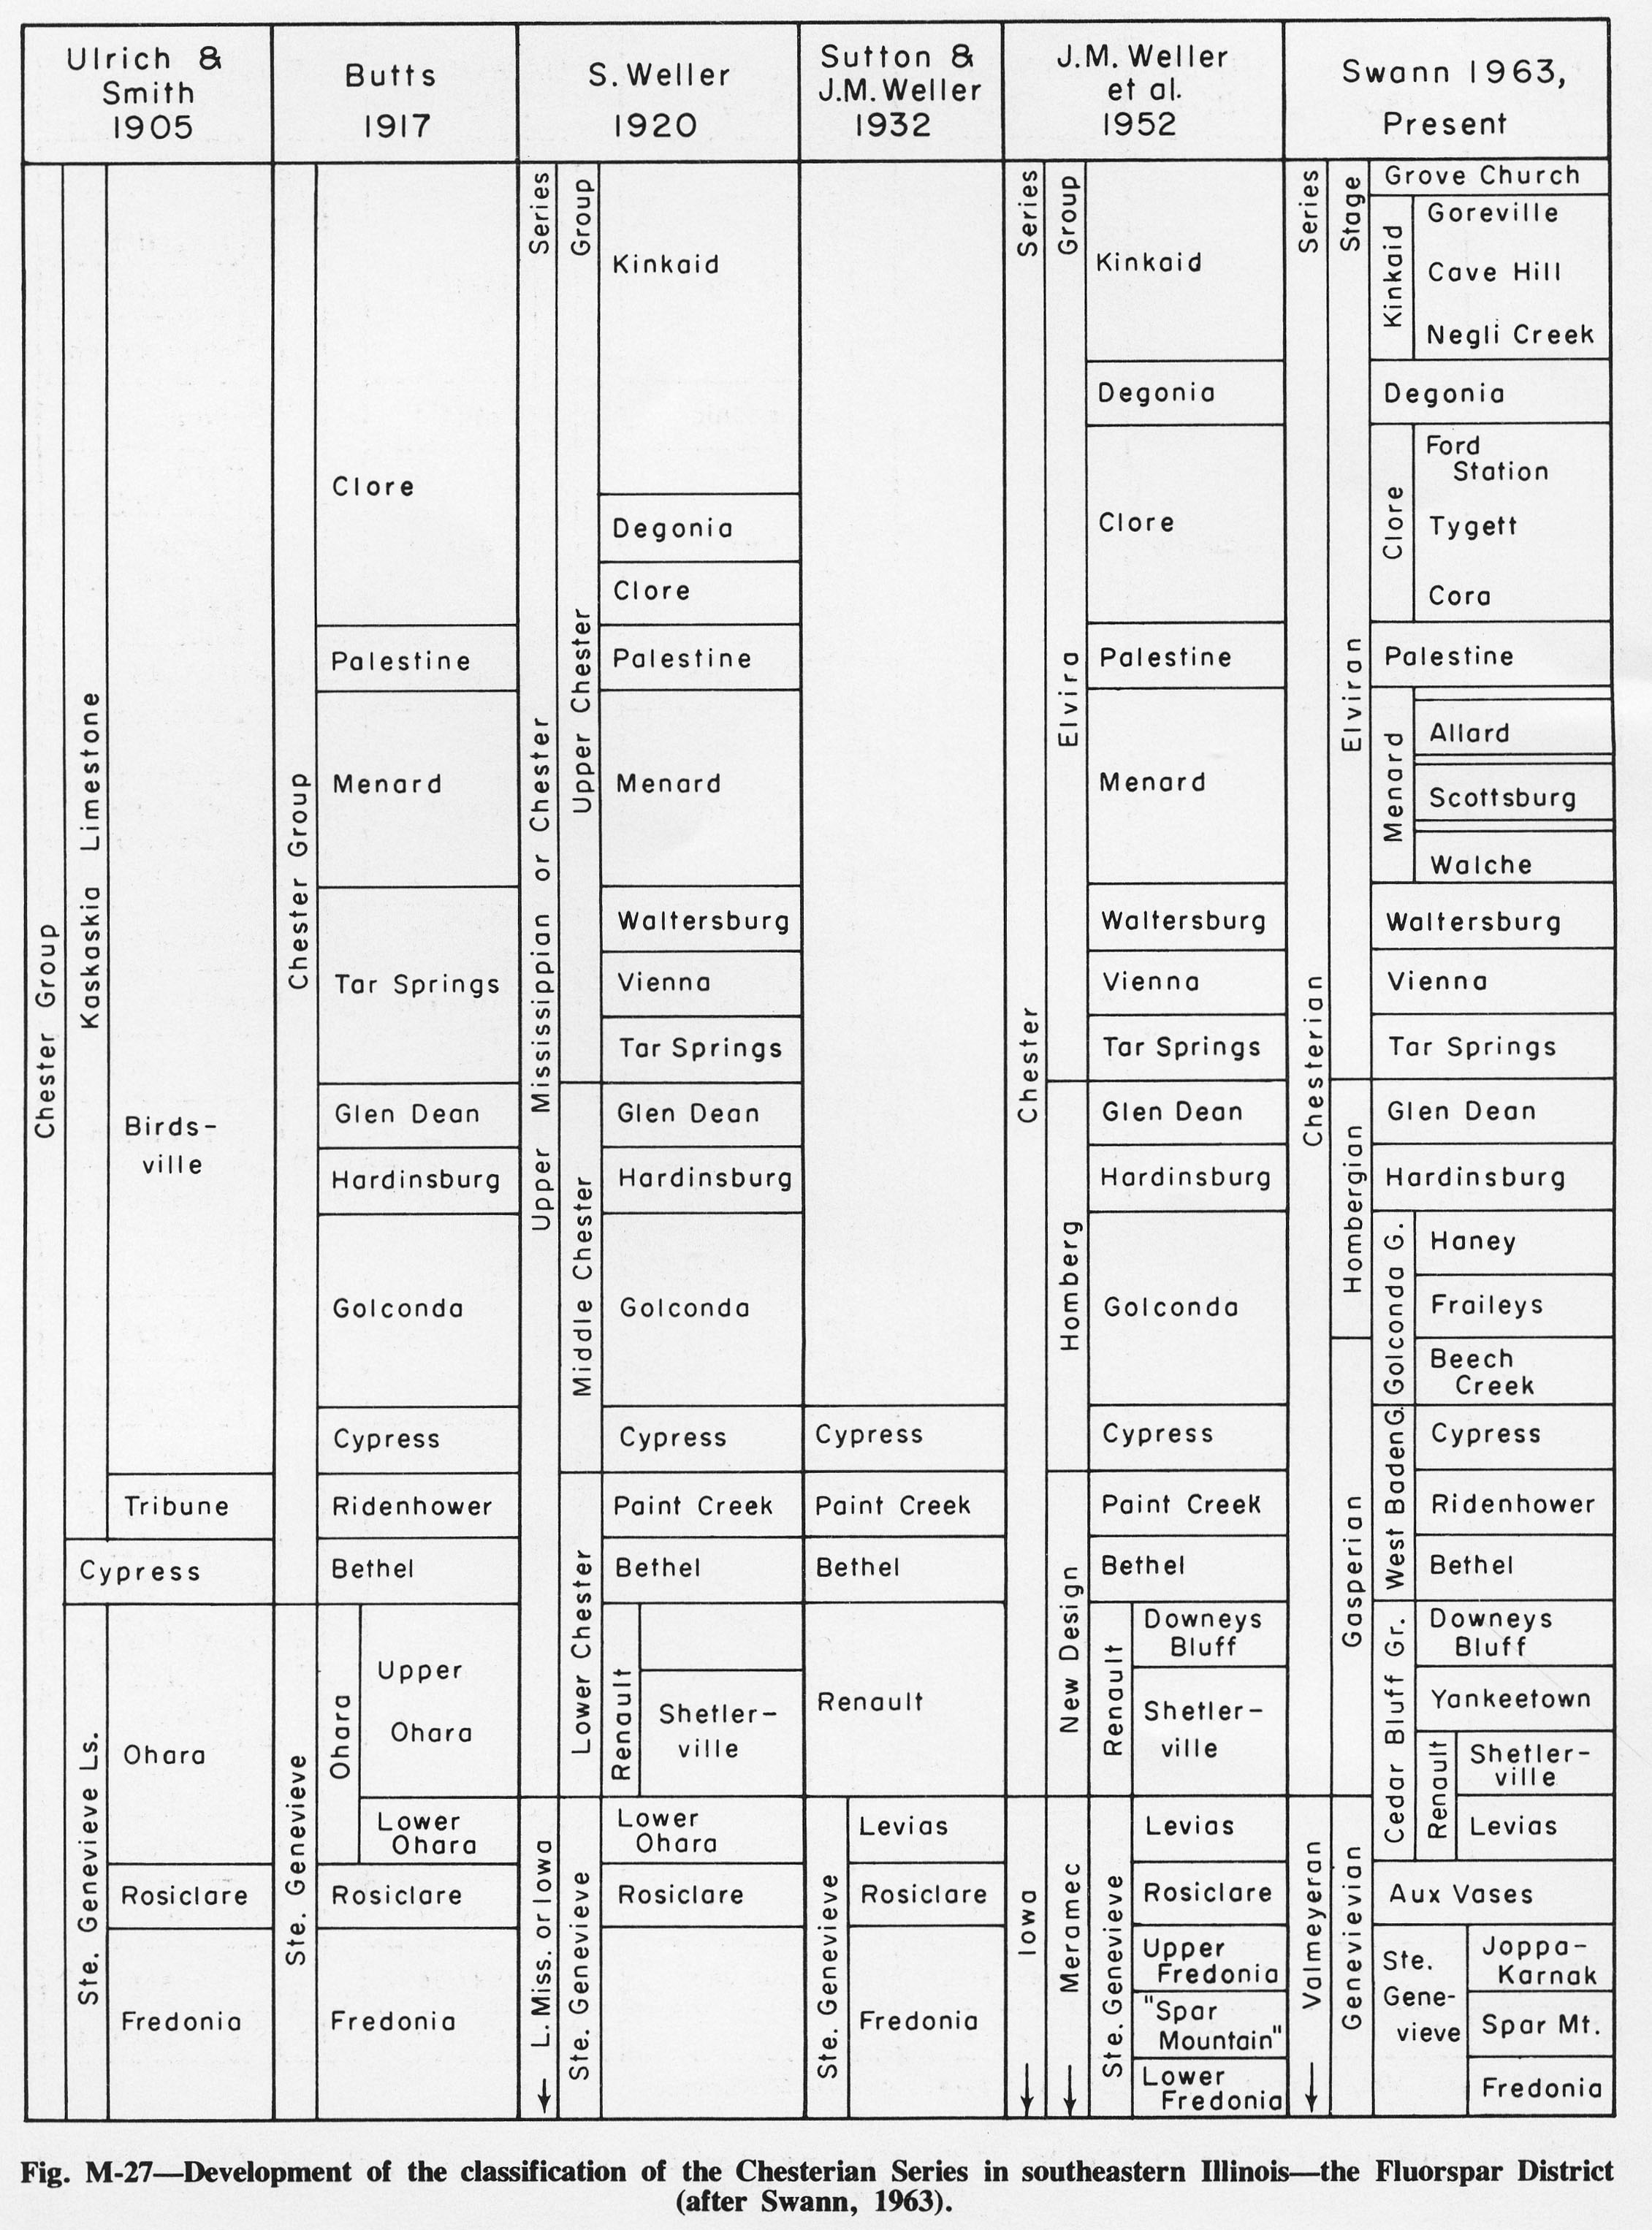
| 14:10, 4 April 2016 | Figure M-27.jpg (file) |  |
848 KB | Fig. M-27 -- Development of the classification of the Chesterian Series in southeastern Illinois -- the Fluorspar District (after Swann, 1963). | 1 |
| 14:12, 4 April 2016 | Figure M-28.jpg (file) |  |
718 KB | Fig. M-28 -- Development of the classification of the Chesterian Series in southwestern Illinois -- the Chester District (after Swann, 1963). | 1 |
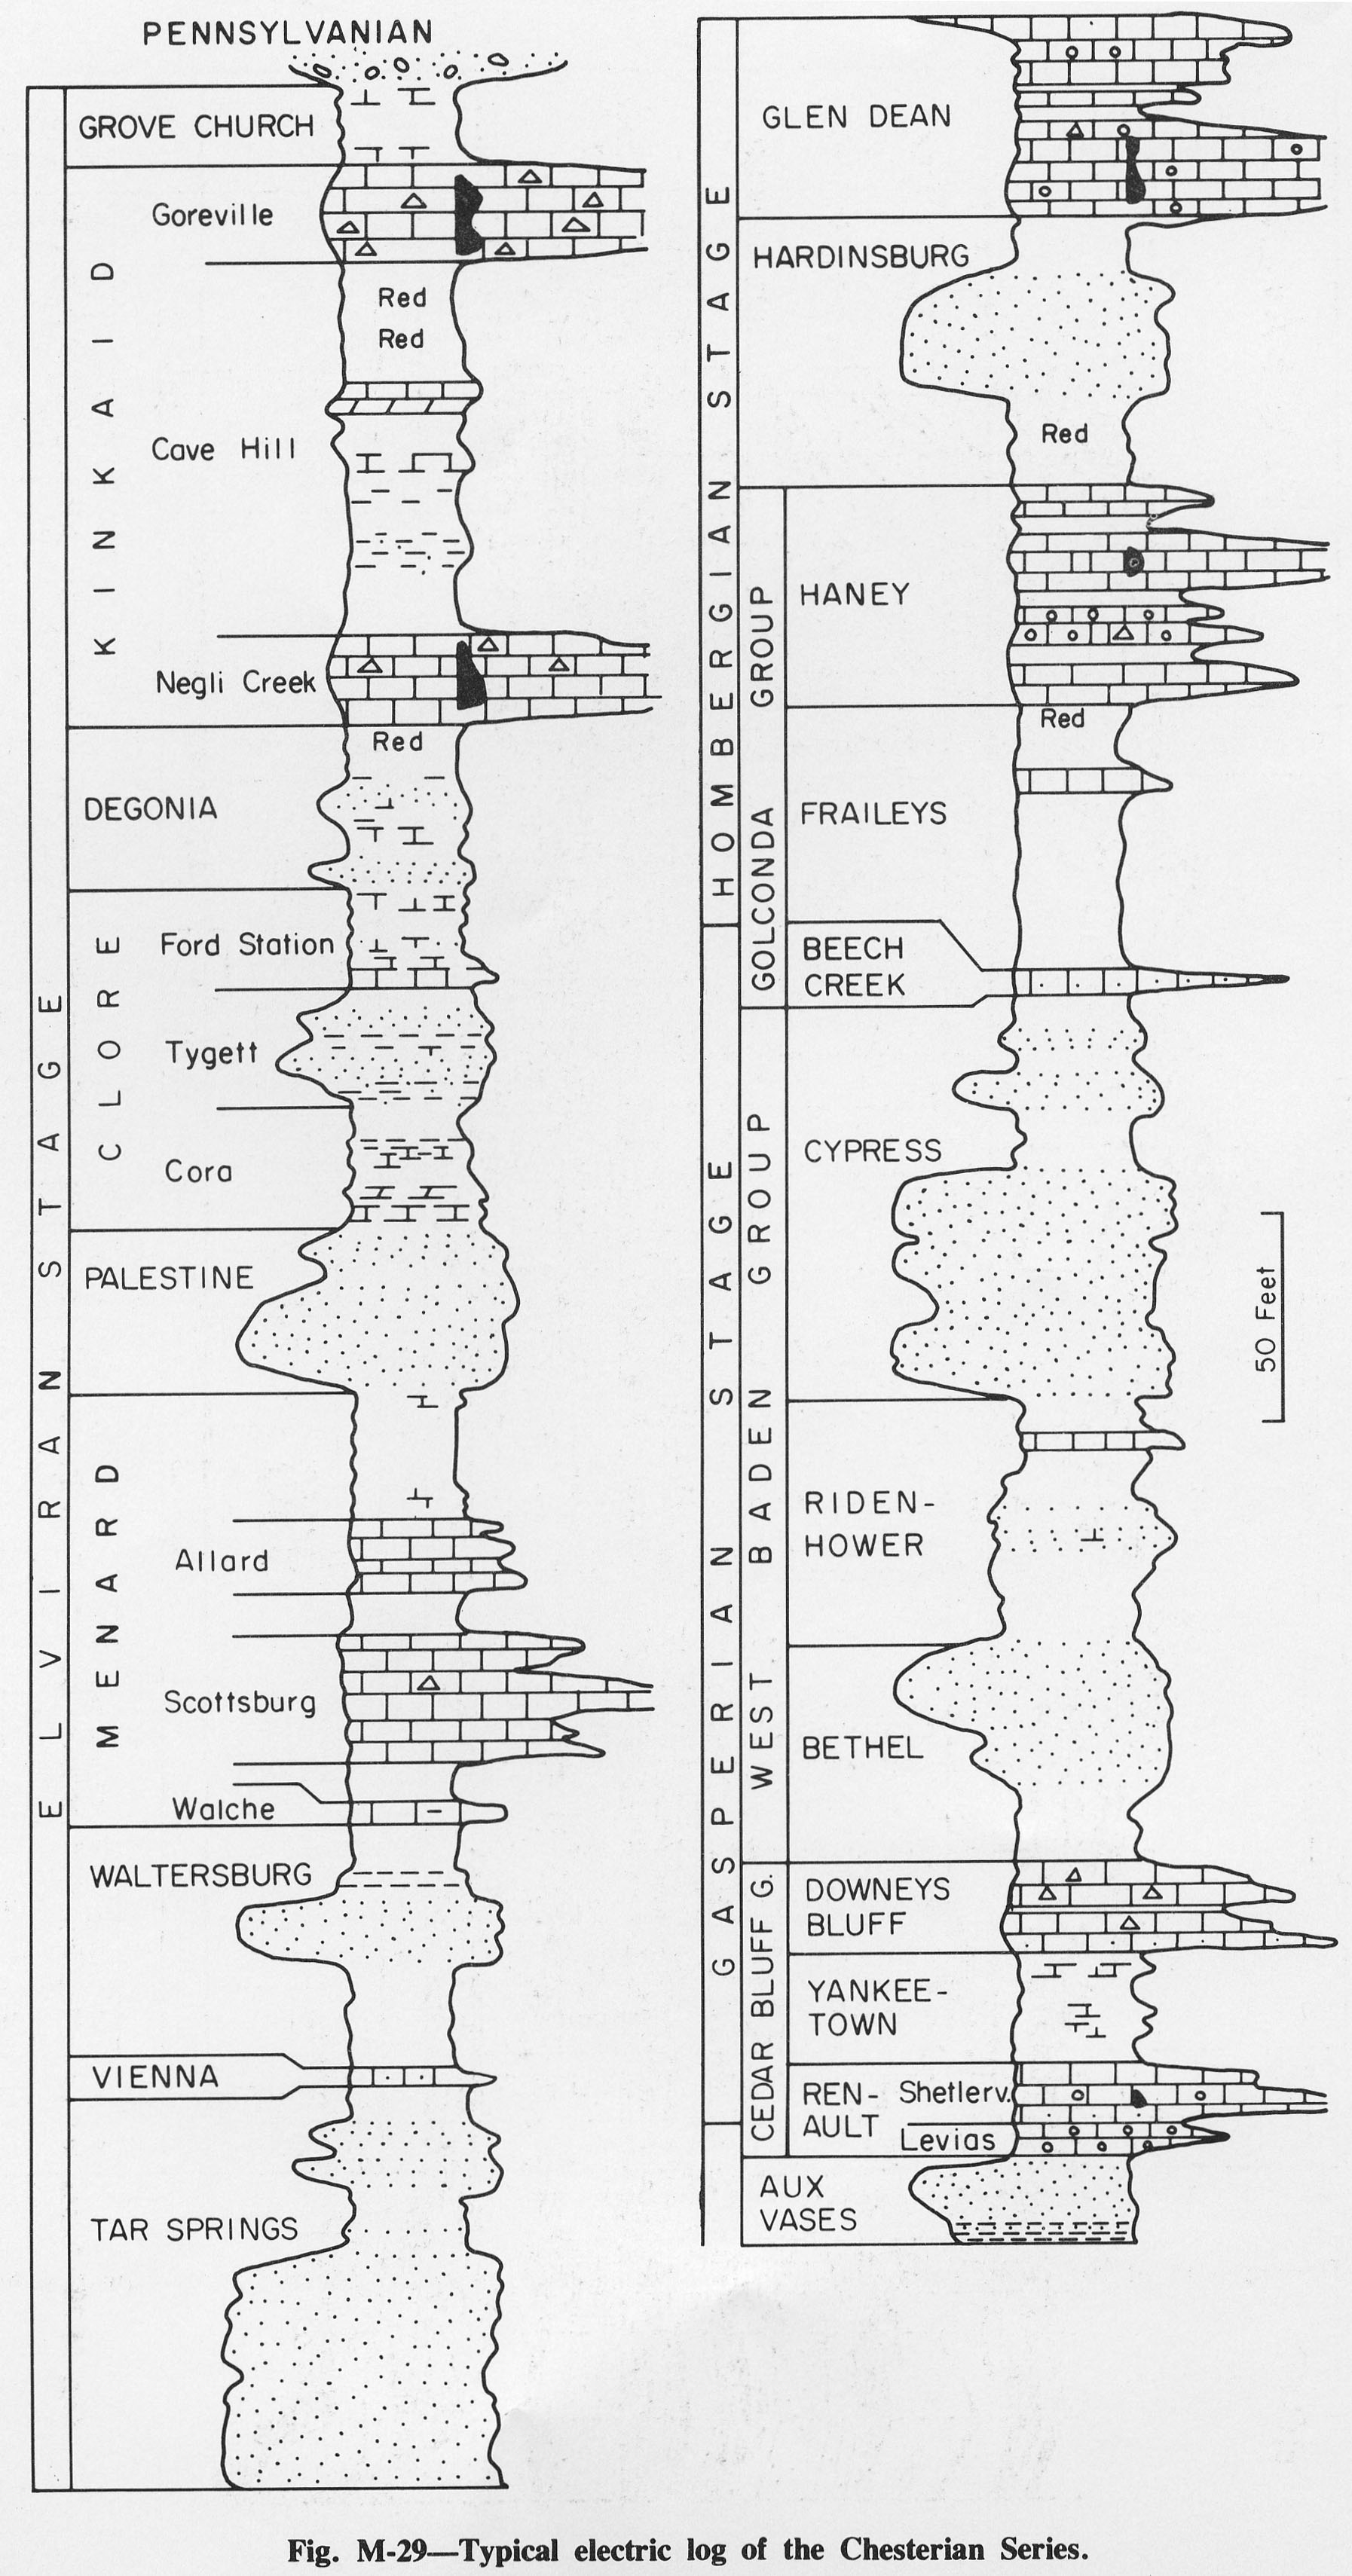
| 14:12, 4 April 2016 | Figure M-29.jpg (file) |  |
687 KB | Fig. M-29 -- Typical electric log of the Chesterian Series. | 1 |
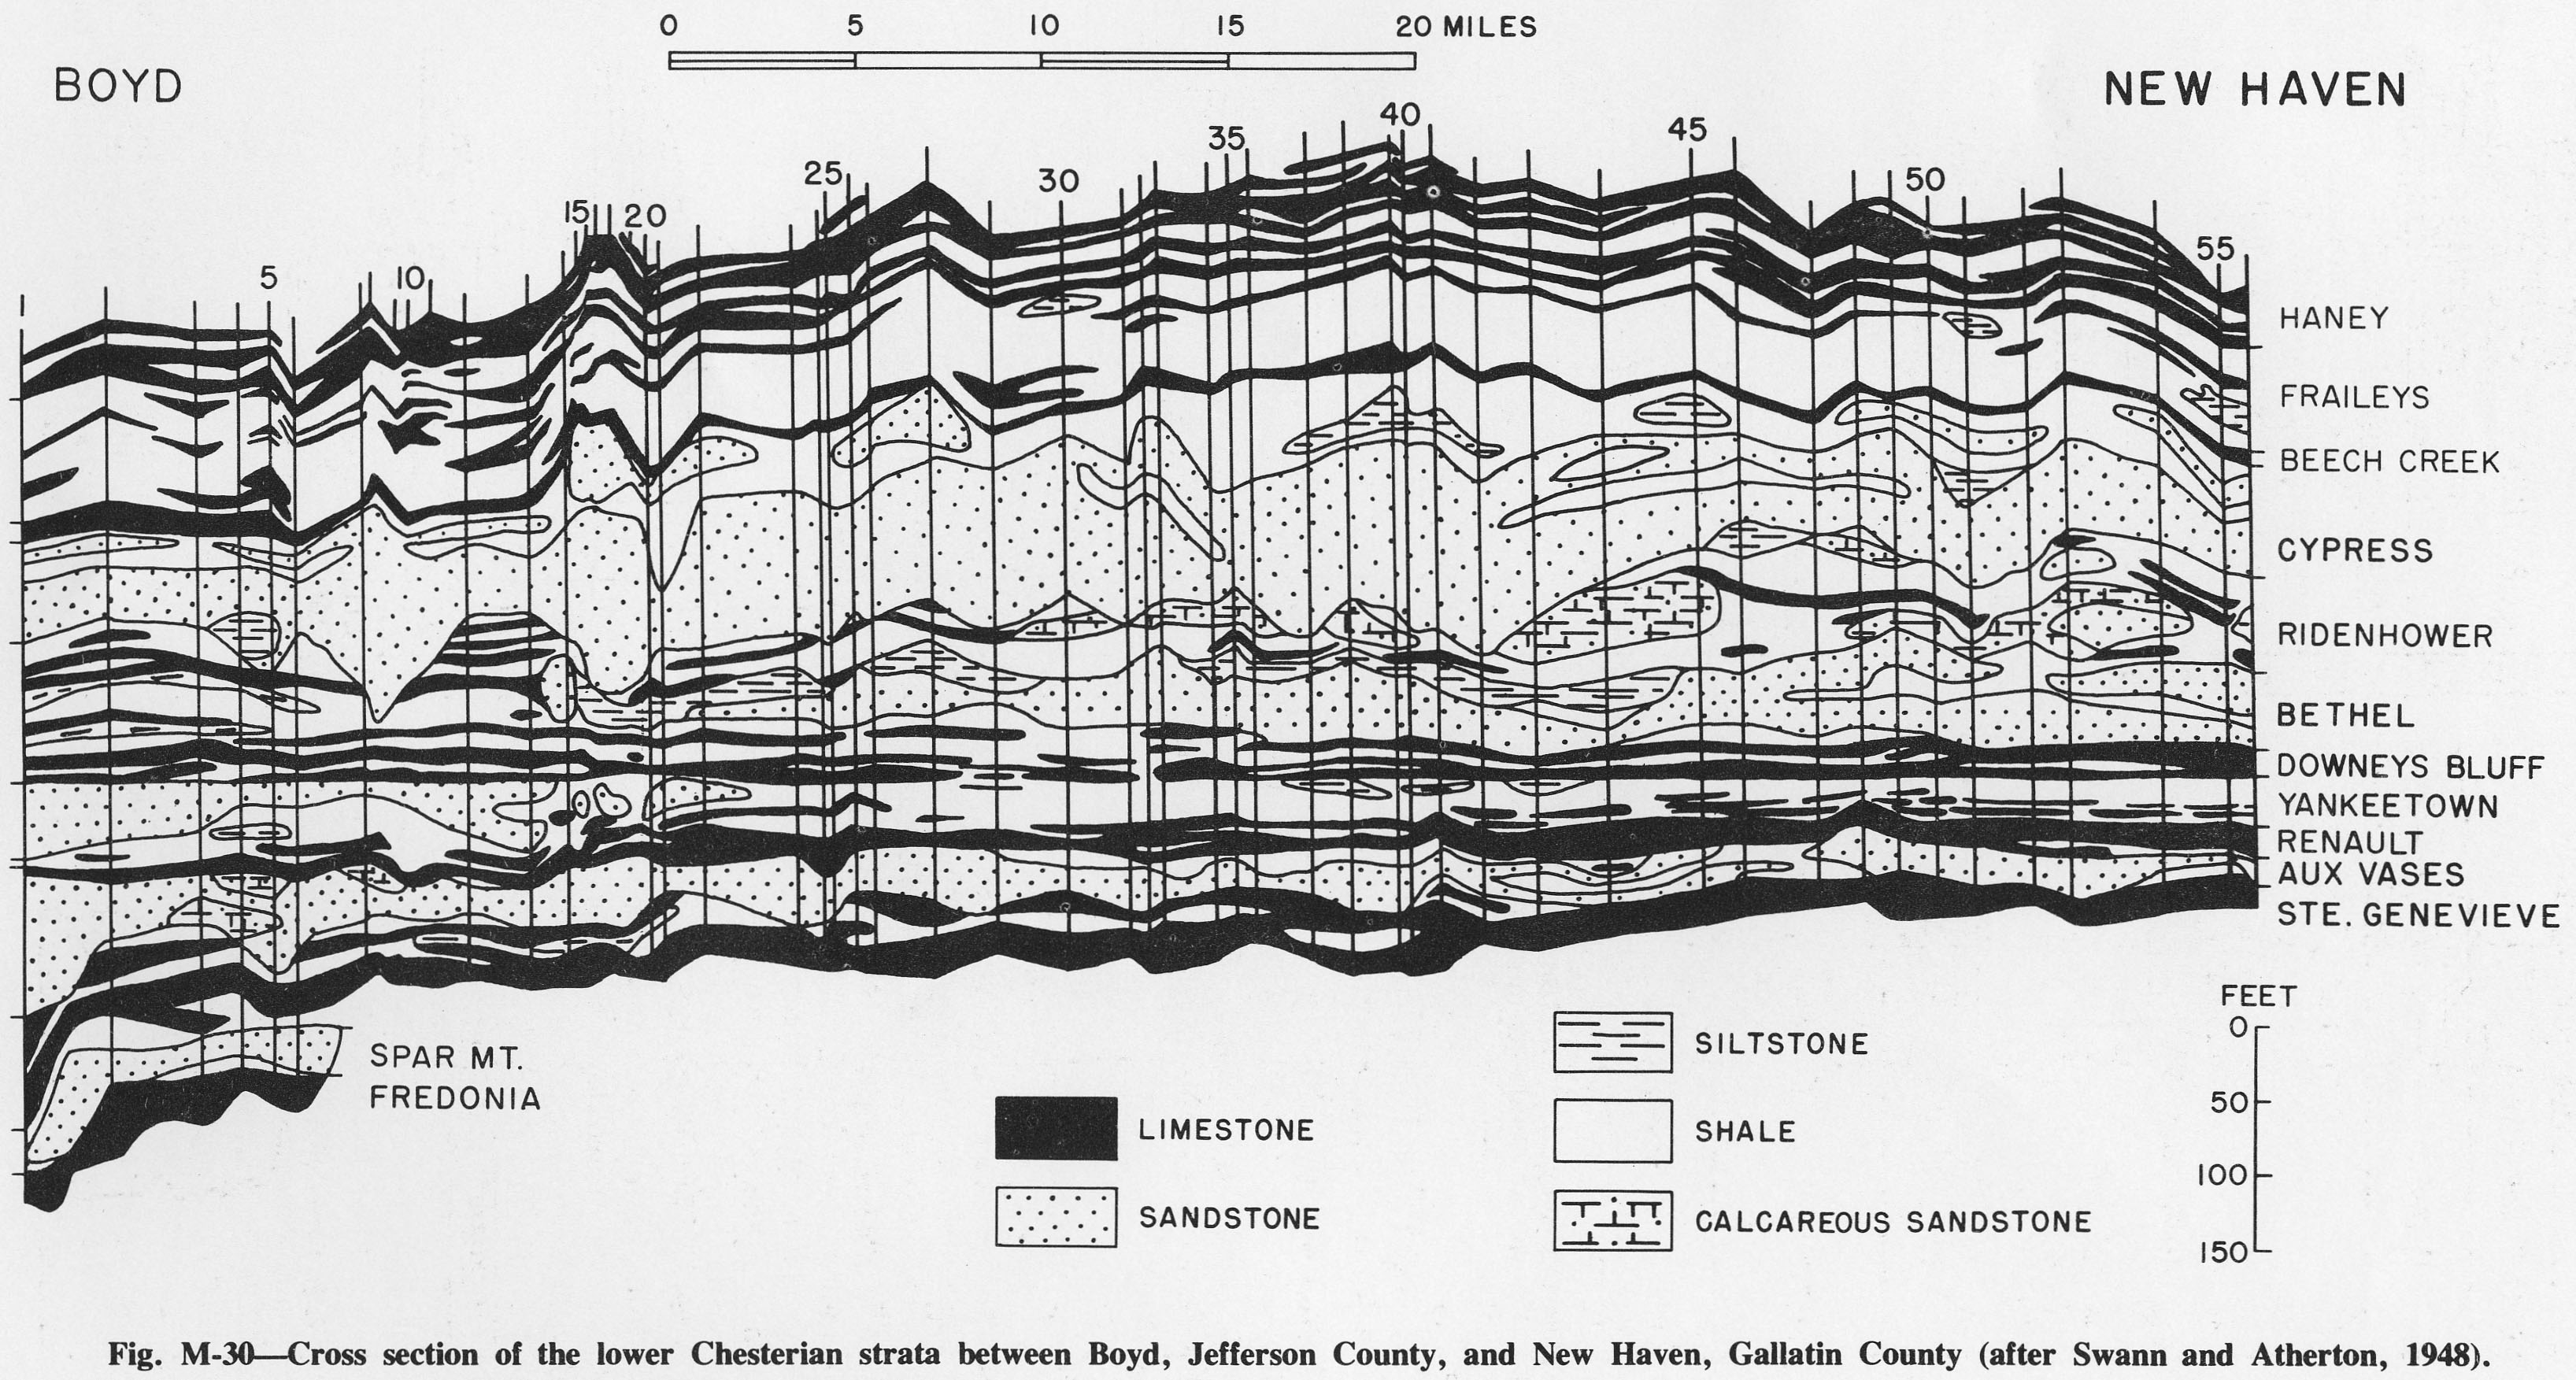
| 14:14, 4 April 2016 | Figure M-30.jpg (file) |  |
891 KB | Fig. M-30 -- Cross section of the lower Chesterian strata between Boyd, Jefferson County, and New Haven, Gallatin County (after Swann and Atherton, 1948). | 1 |
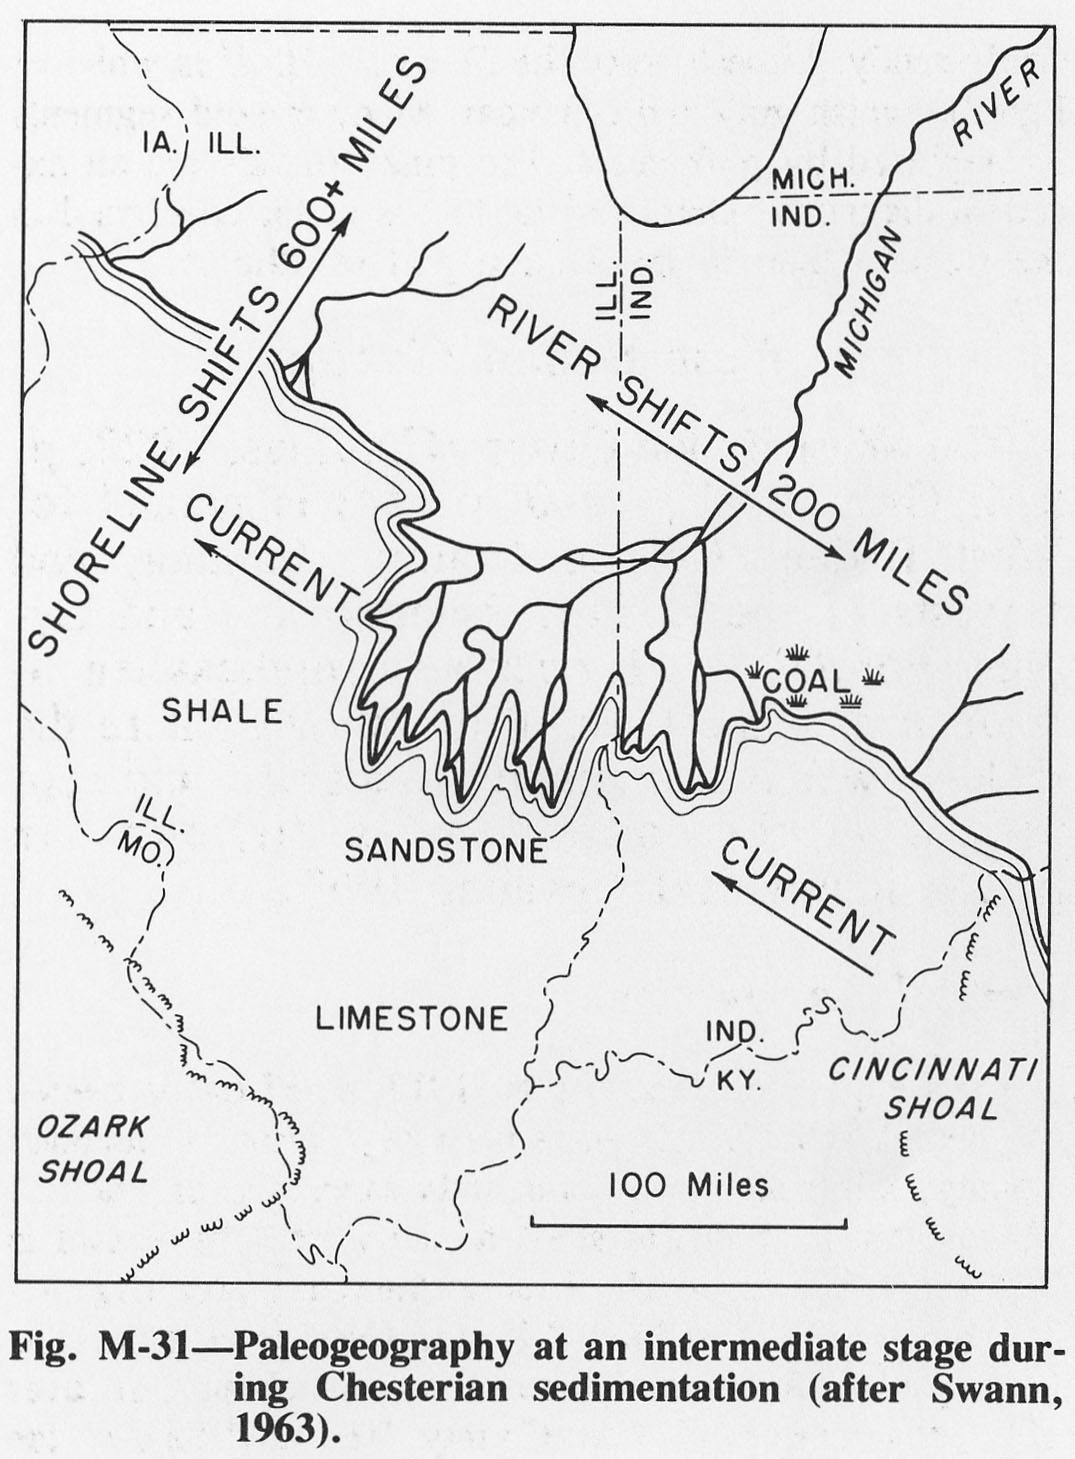
| 14:15, 4 April 2016 | Figure M-31.jpg (file) |  |
219 KB | Fig. M-31 -- Paleogeography at an intermediate state during the Chesterian sedimentation (after Swann, 1963). | 1 |
| 14:17, 4 April 2016 | Figure M-32.jpg (file) |  |
299 KB | Fig. M-32 -- Changes in position of the shoreline and the position of the Michigan River during late Valmeyeran and Chesterian times (after Swann, 1963). | 1 |
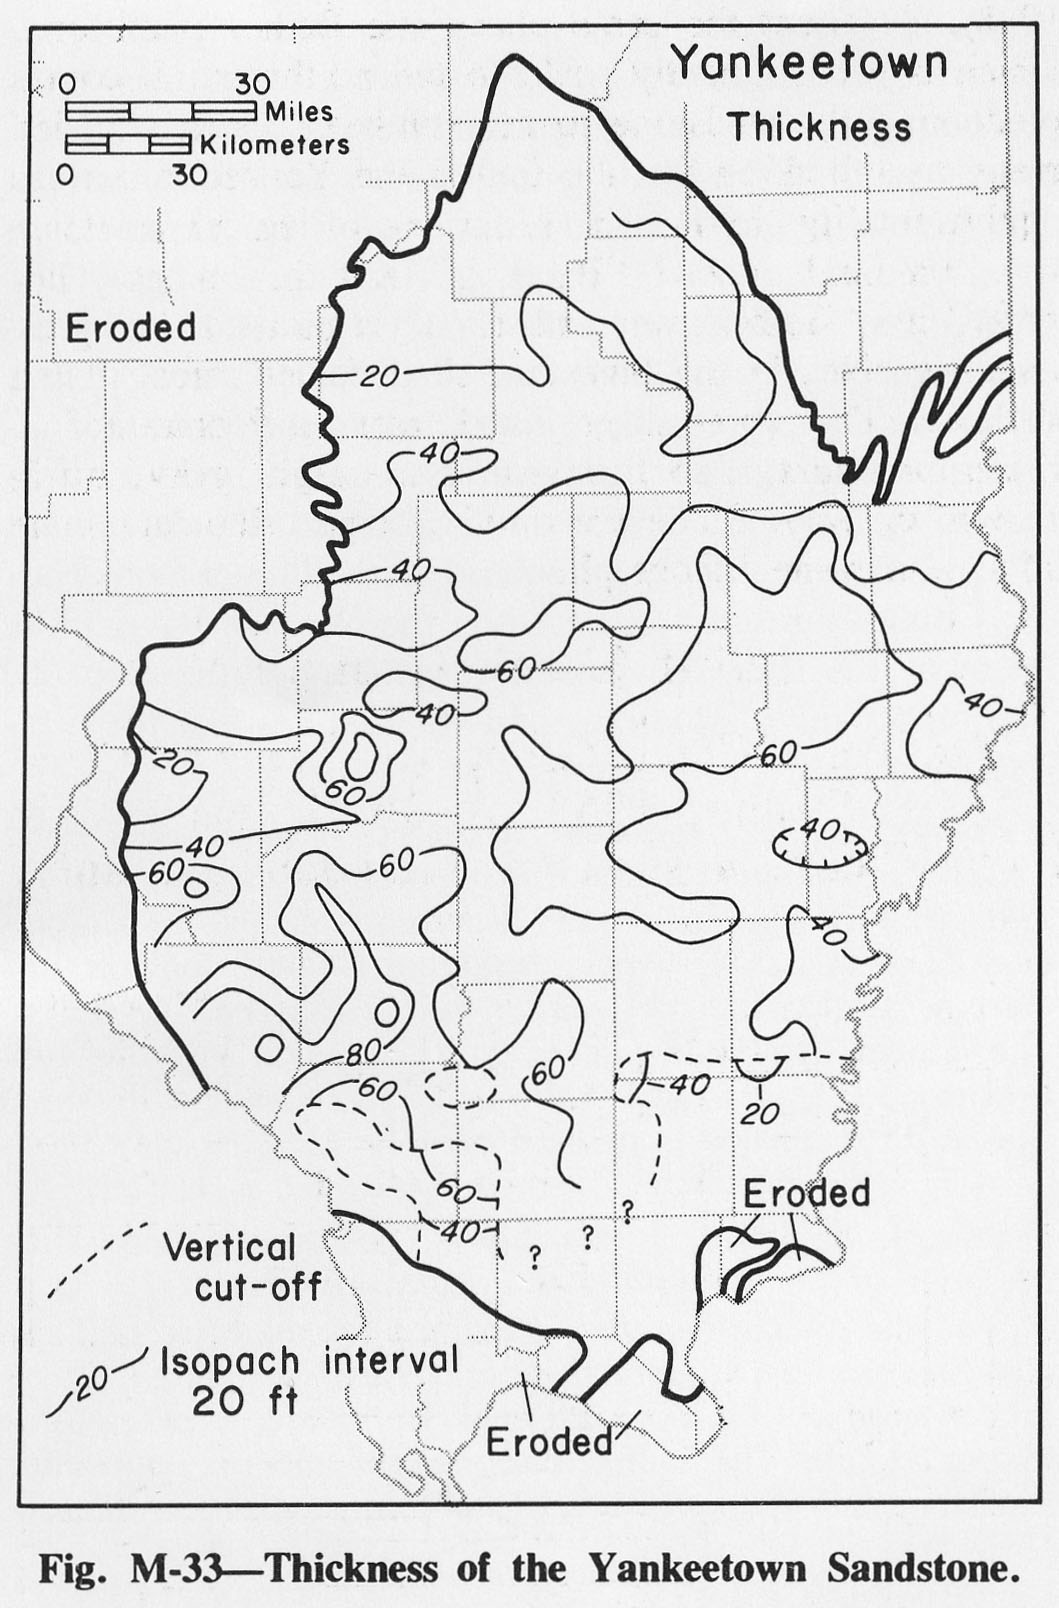
| 14:17, 4 April 2016 | Figure M-33.jpg (file) |  |
261 KB | Fig. M-33 -- Thickness of the Yankeetown Sandstone. | 1 |
| 14:18, 4 April 2016 | Figure M-34.jpg (file) |  |
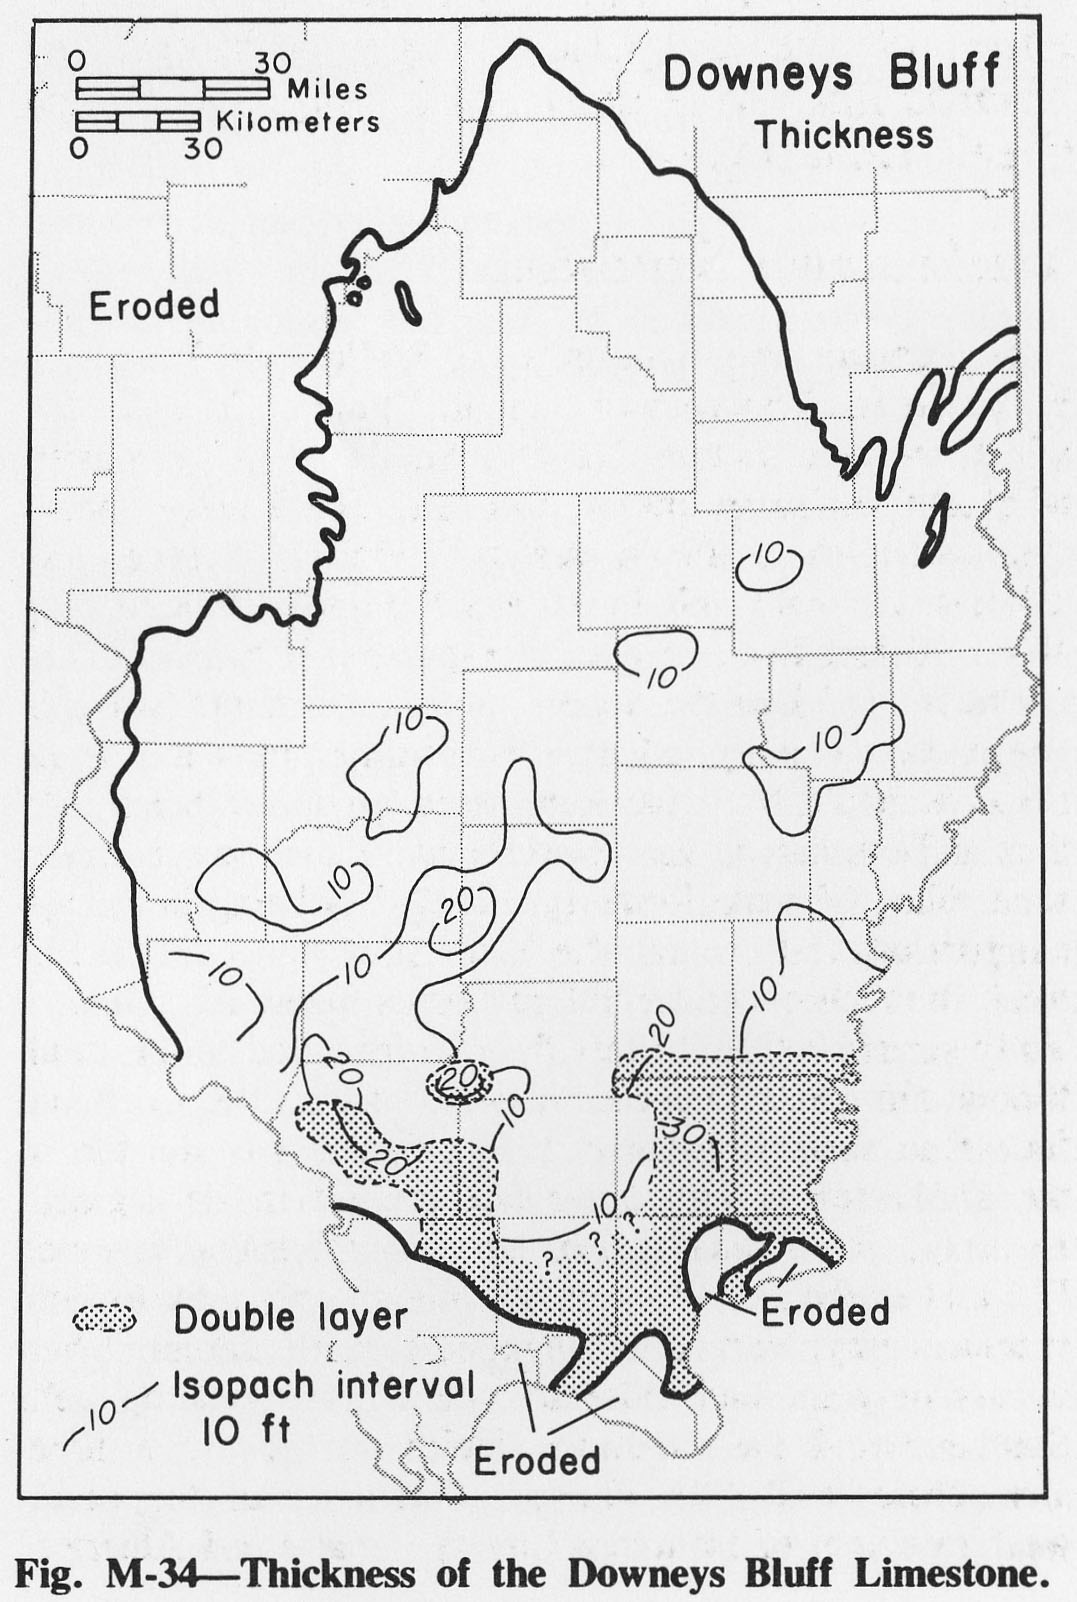
267 KB | Fig. M-34 -- Thickness of the Downeys Bluff Limestone. | 1 |
| 14:19, 4 April 2016 | Figure M-35.jpg (file) |  |
258 KB | Fig. M-35 -- Thickness of the Bethel Sandstone. | 1 |
| 14:19, 4 April 2016 | Figure M-36.jpg (file) |  |
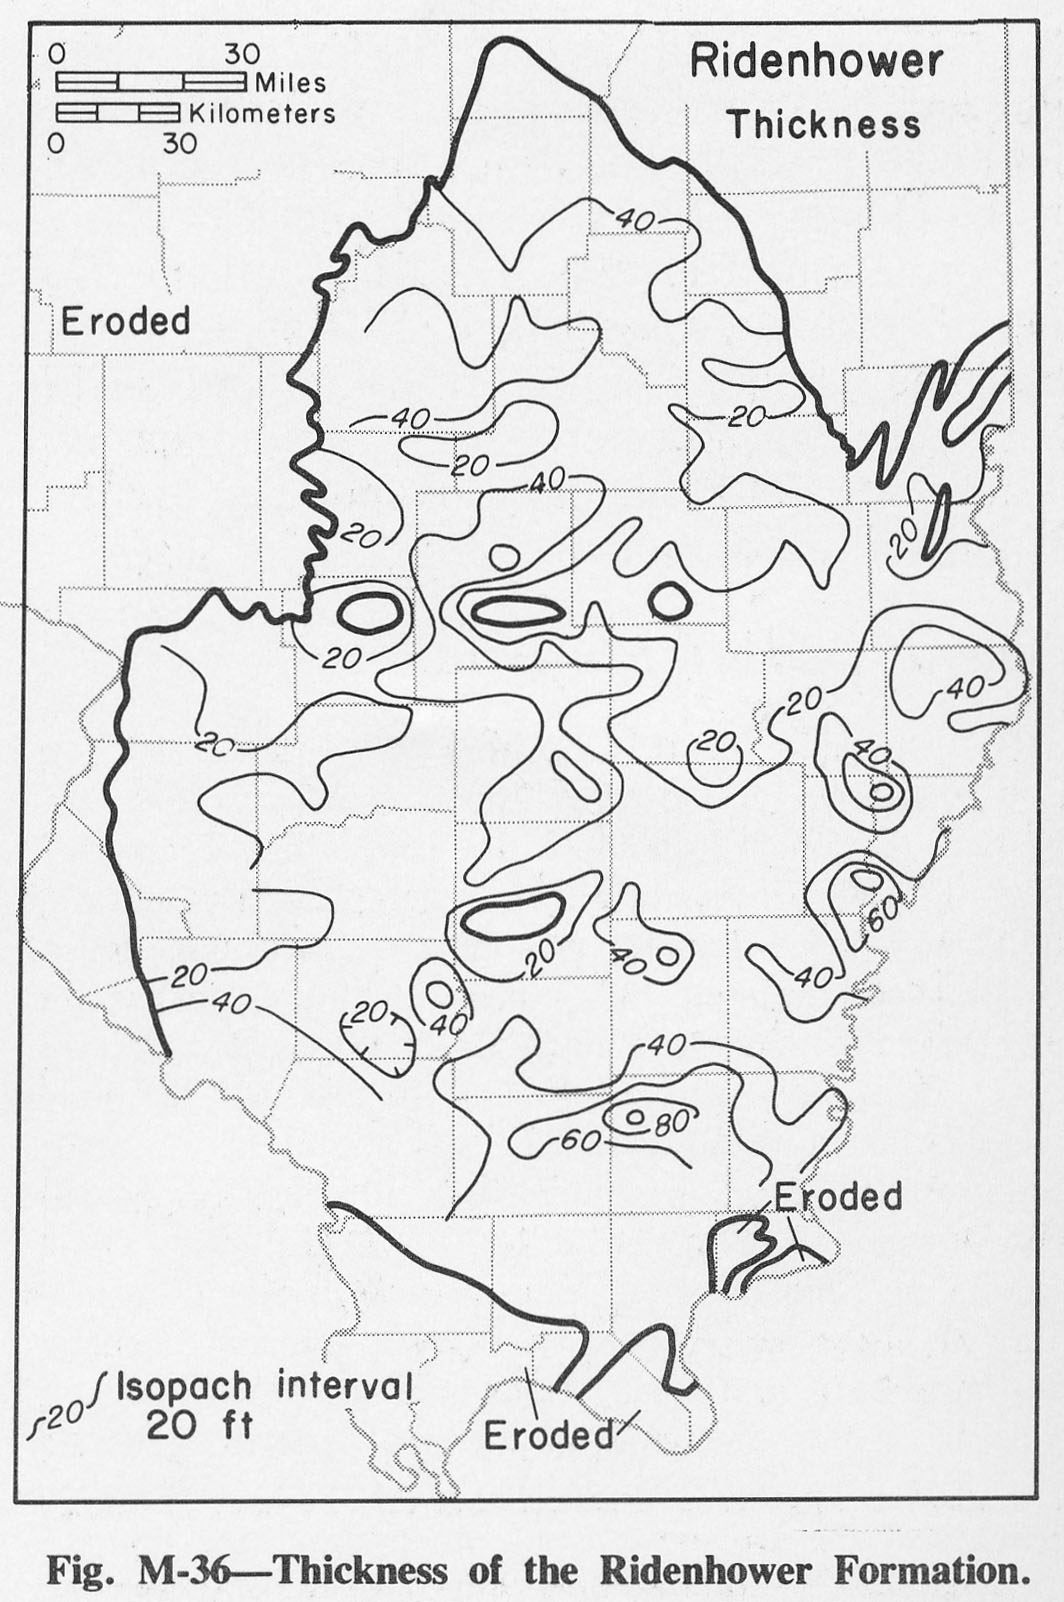
264 KB | Fig. M-36 -- Thickness of the Ridenhower Formation. | 1 |
| 14:20, 4 April 2016 | Figure M-37.jpg (file) |  |
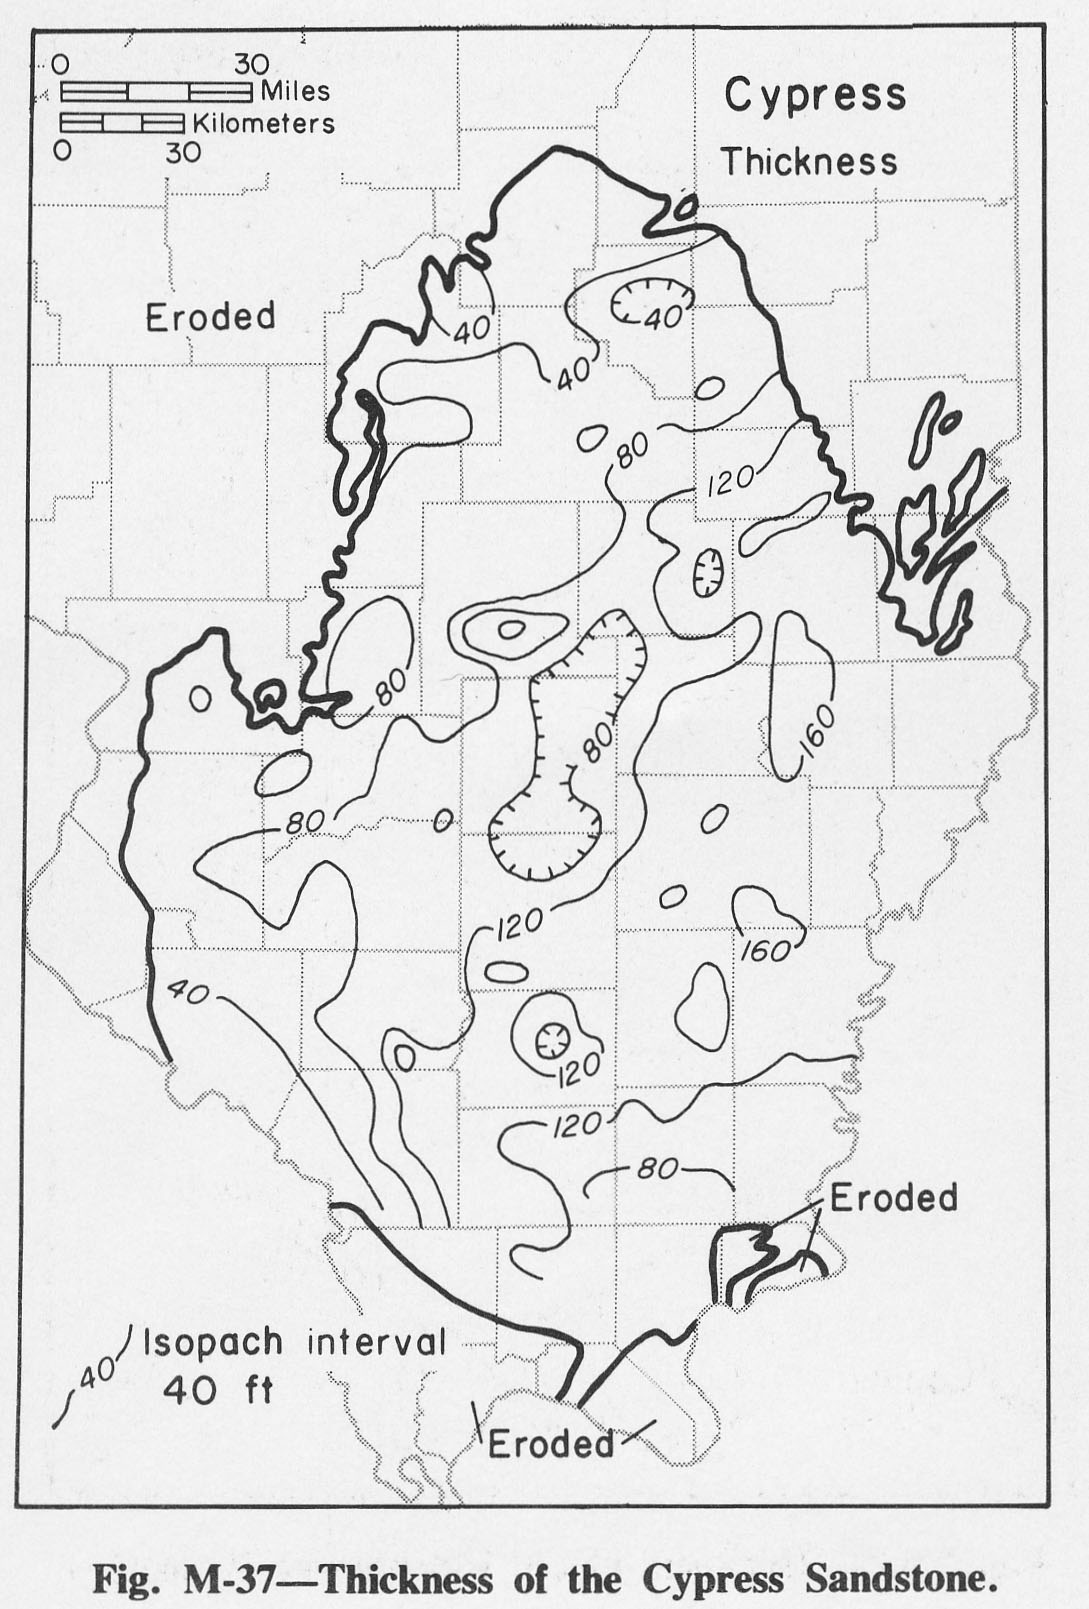
256 KB | Fig. M-37 -- Thickness of the Cypress Sandstone. | 1 |
| 14:21, 4 April 2016 | Figure M-38.jpg (file) |  |
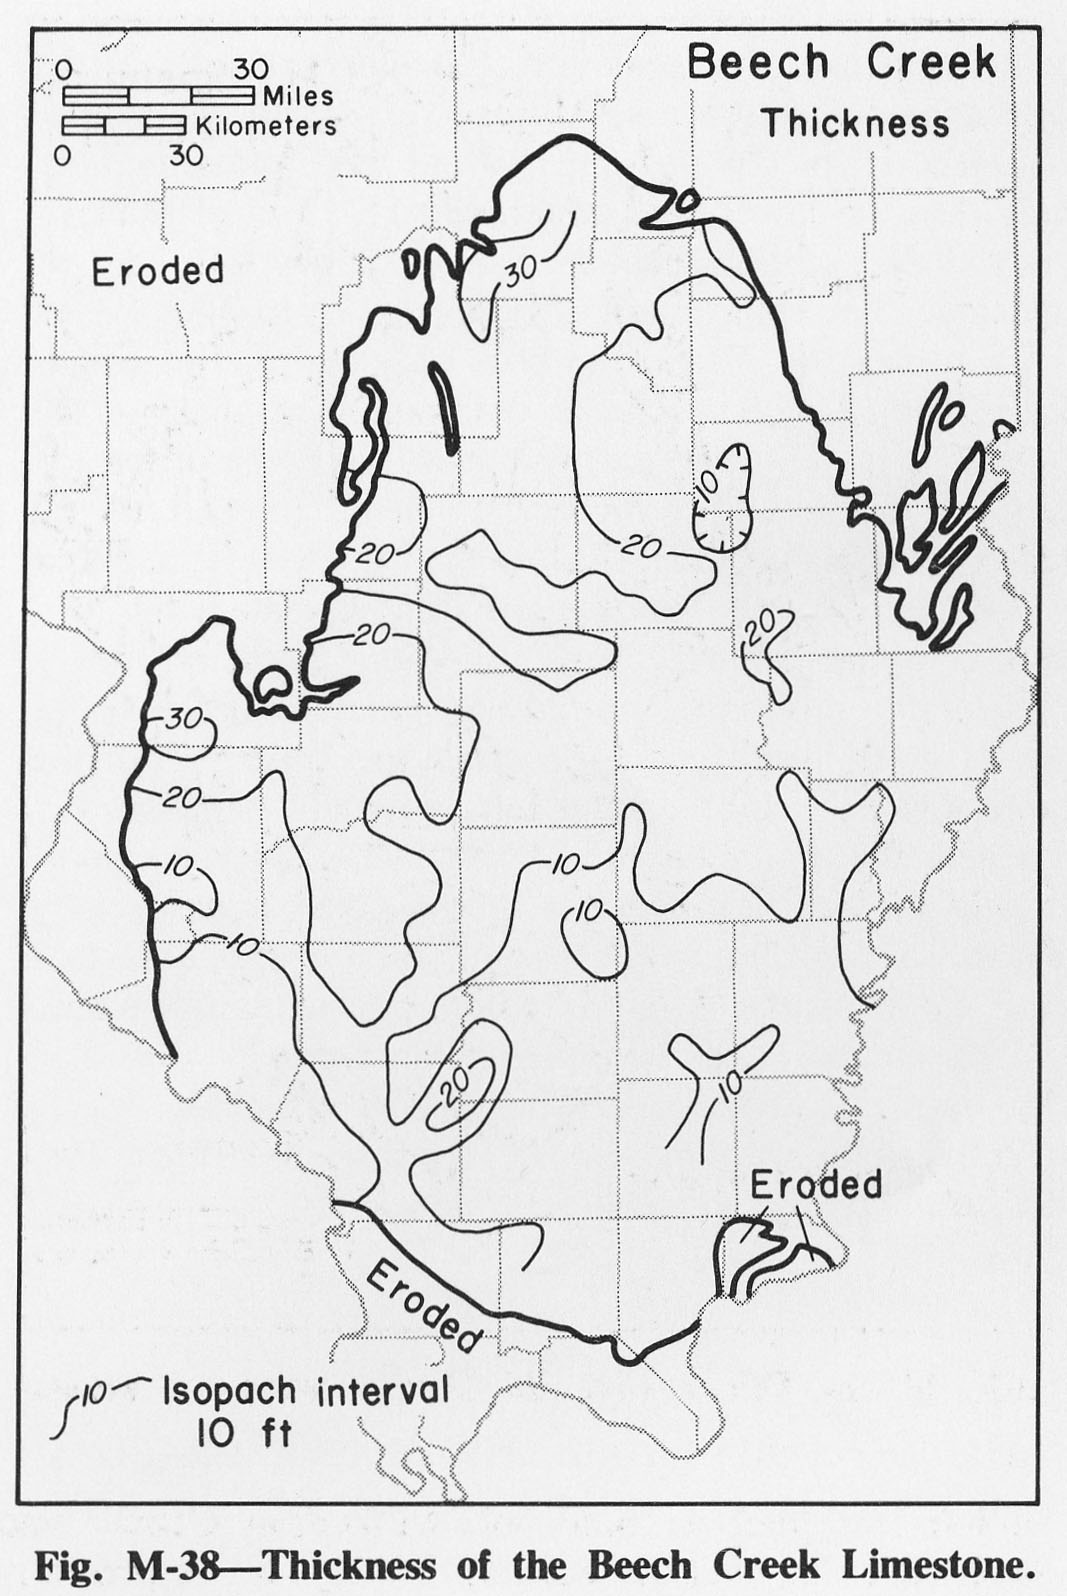
245 KB | Fig. M-38 -- Thickness of the Beech Creek Limestone. | 1 |
| 14:22, 4 April 2016 | Figure M-39.jpg (file) |  |
210 KB | Fig. M-39 -- Thickness of the Fraileys Shale. | 1 |
| 14:22, 4 April 2016 | Figure M-40.jpg (file) |  |
235 KB | Fig. M-40 -- Thickness of the Haney Limestone. | 1 |
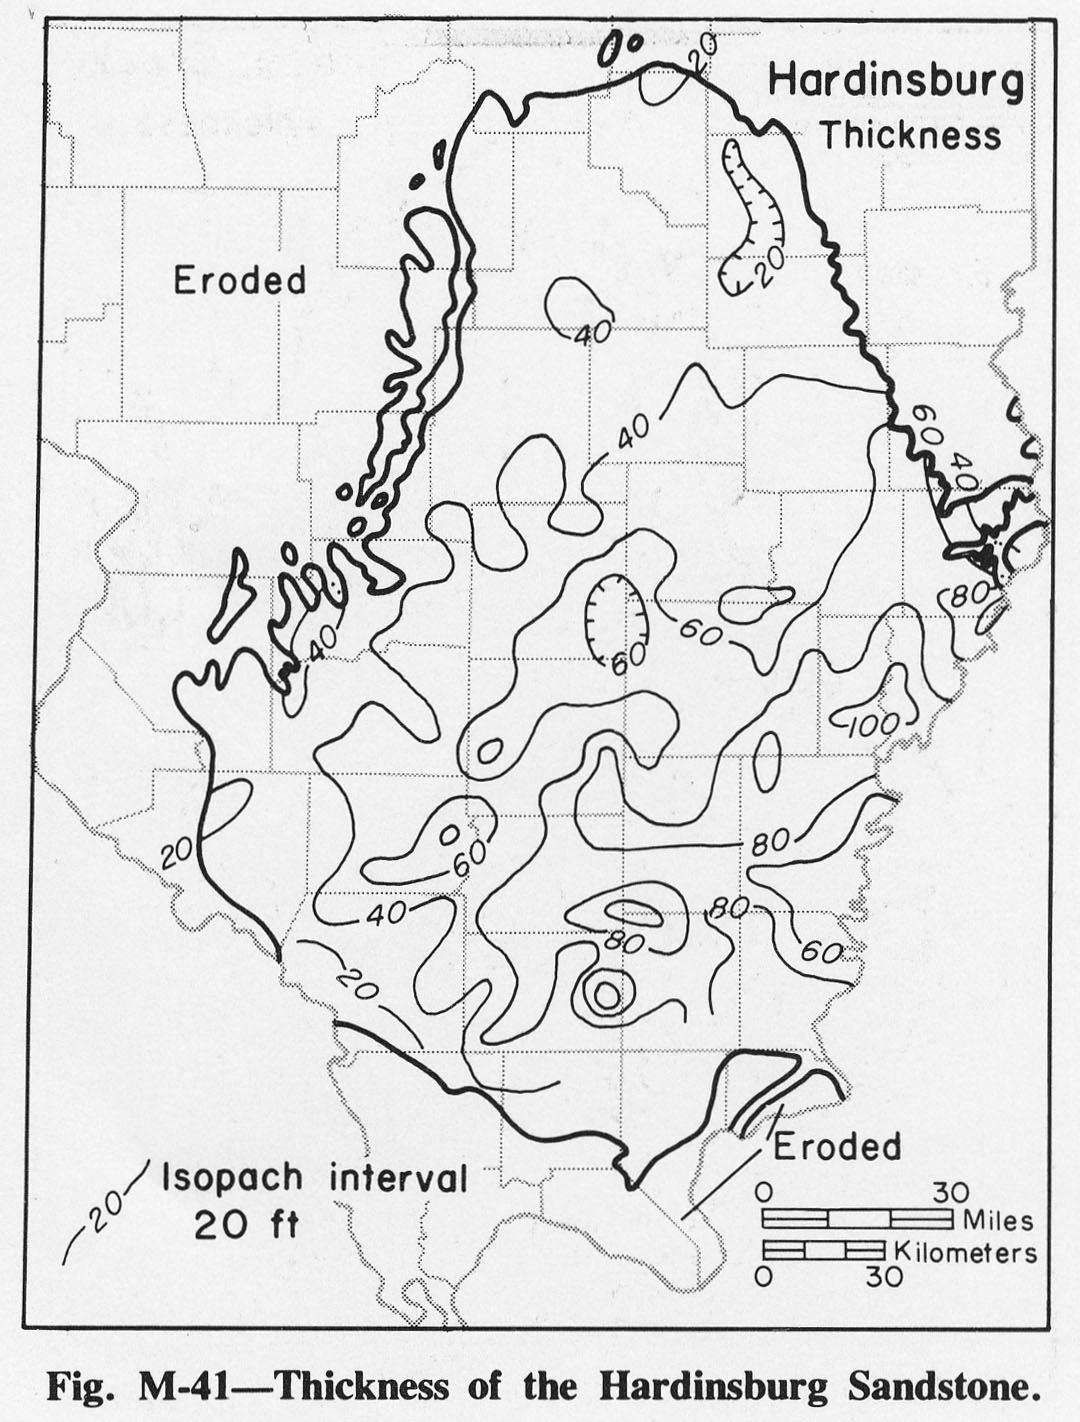
| 14:23, 4 April 2016 | Figure M-41.jpg (file) |  |
249 KB | Fig. M-41 -- Thickness of the Hardinsburg Sandstone. | 1 |
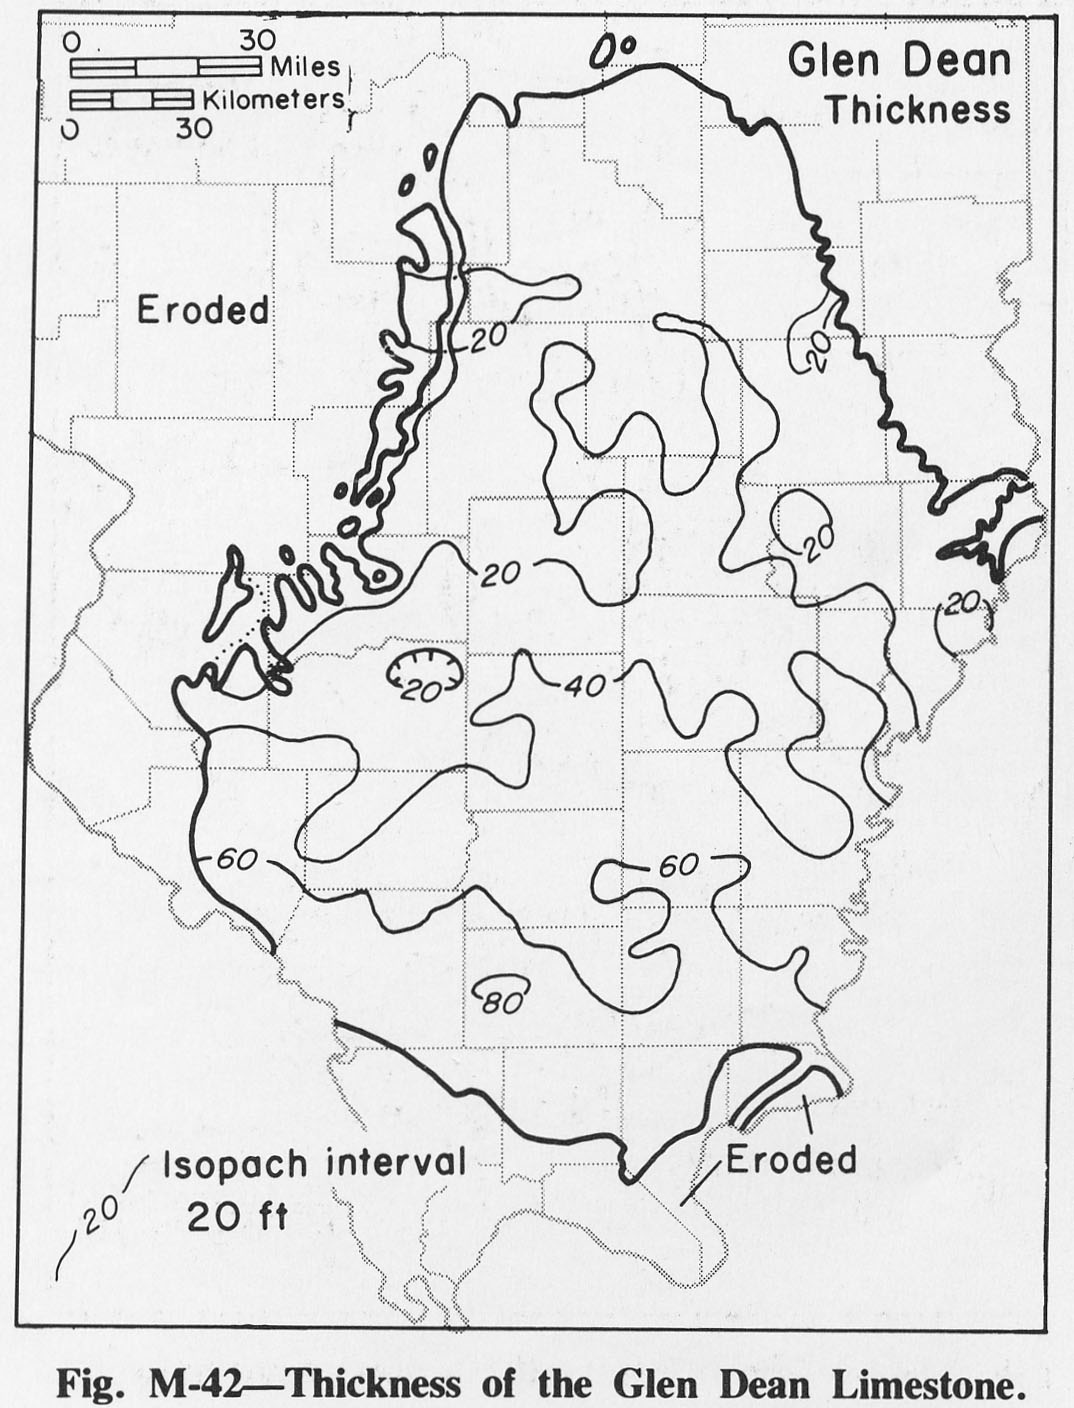
| 14:24, 4 April 2016 | Figure M-42.jpg (file) |  |
226 KB | Fig. M-42 -- Thickness of the Glen Dean Limestone. | 1 |
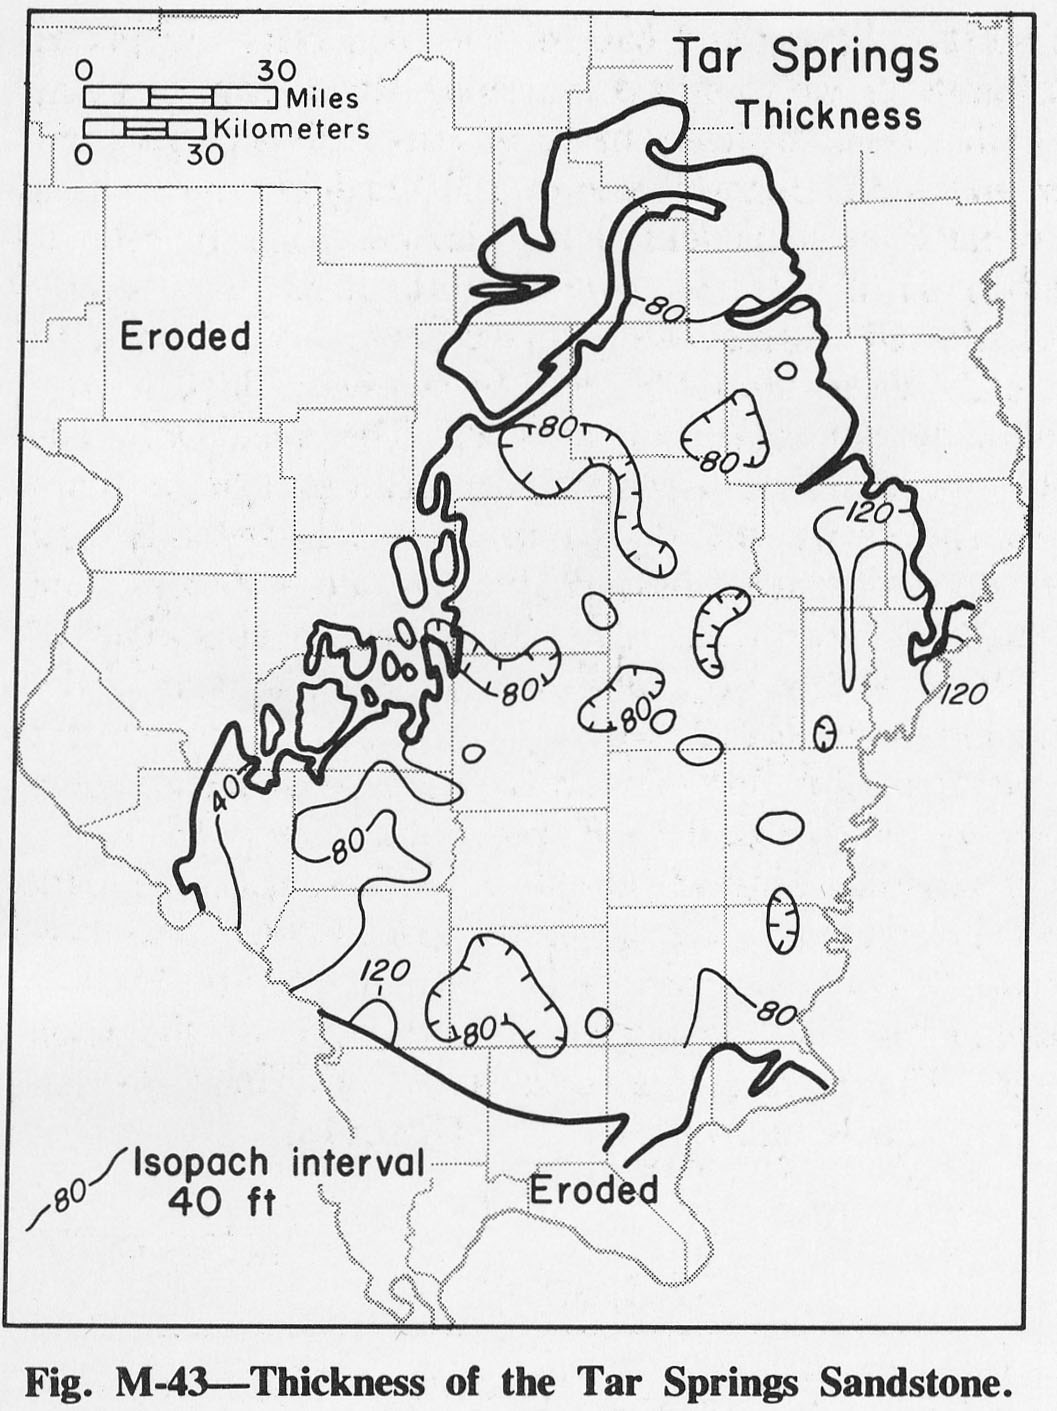
| 14:24, 4 April 2016 | Figure M-43.jpg (file) |  |
228 KB | Fig. M-43 -- Thickness of the Tar Springs Sandstone. | 1 |