File list
Jump to navigation
Jump to search
This special page shows all uploaded files.
| Date | Name | Thumbnail | Size | User | Description | Versions |
|---|---|---|---|---|---|---|
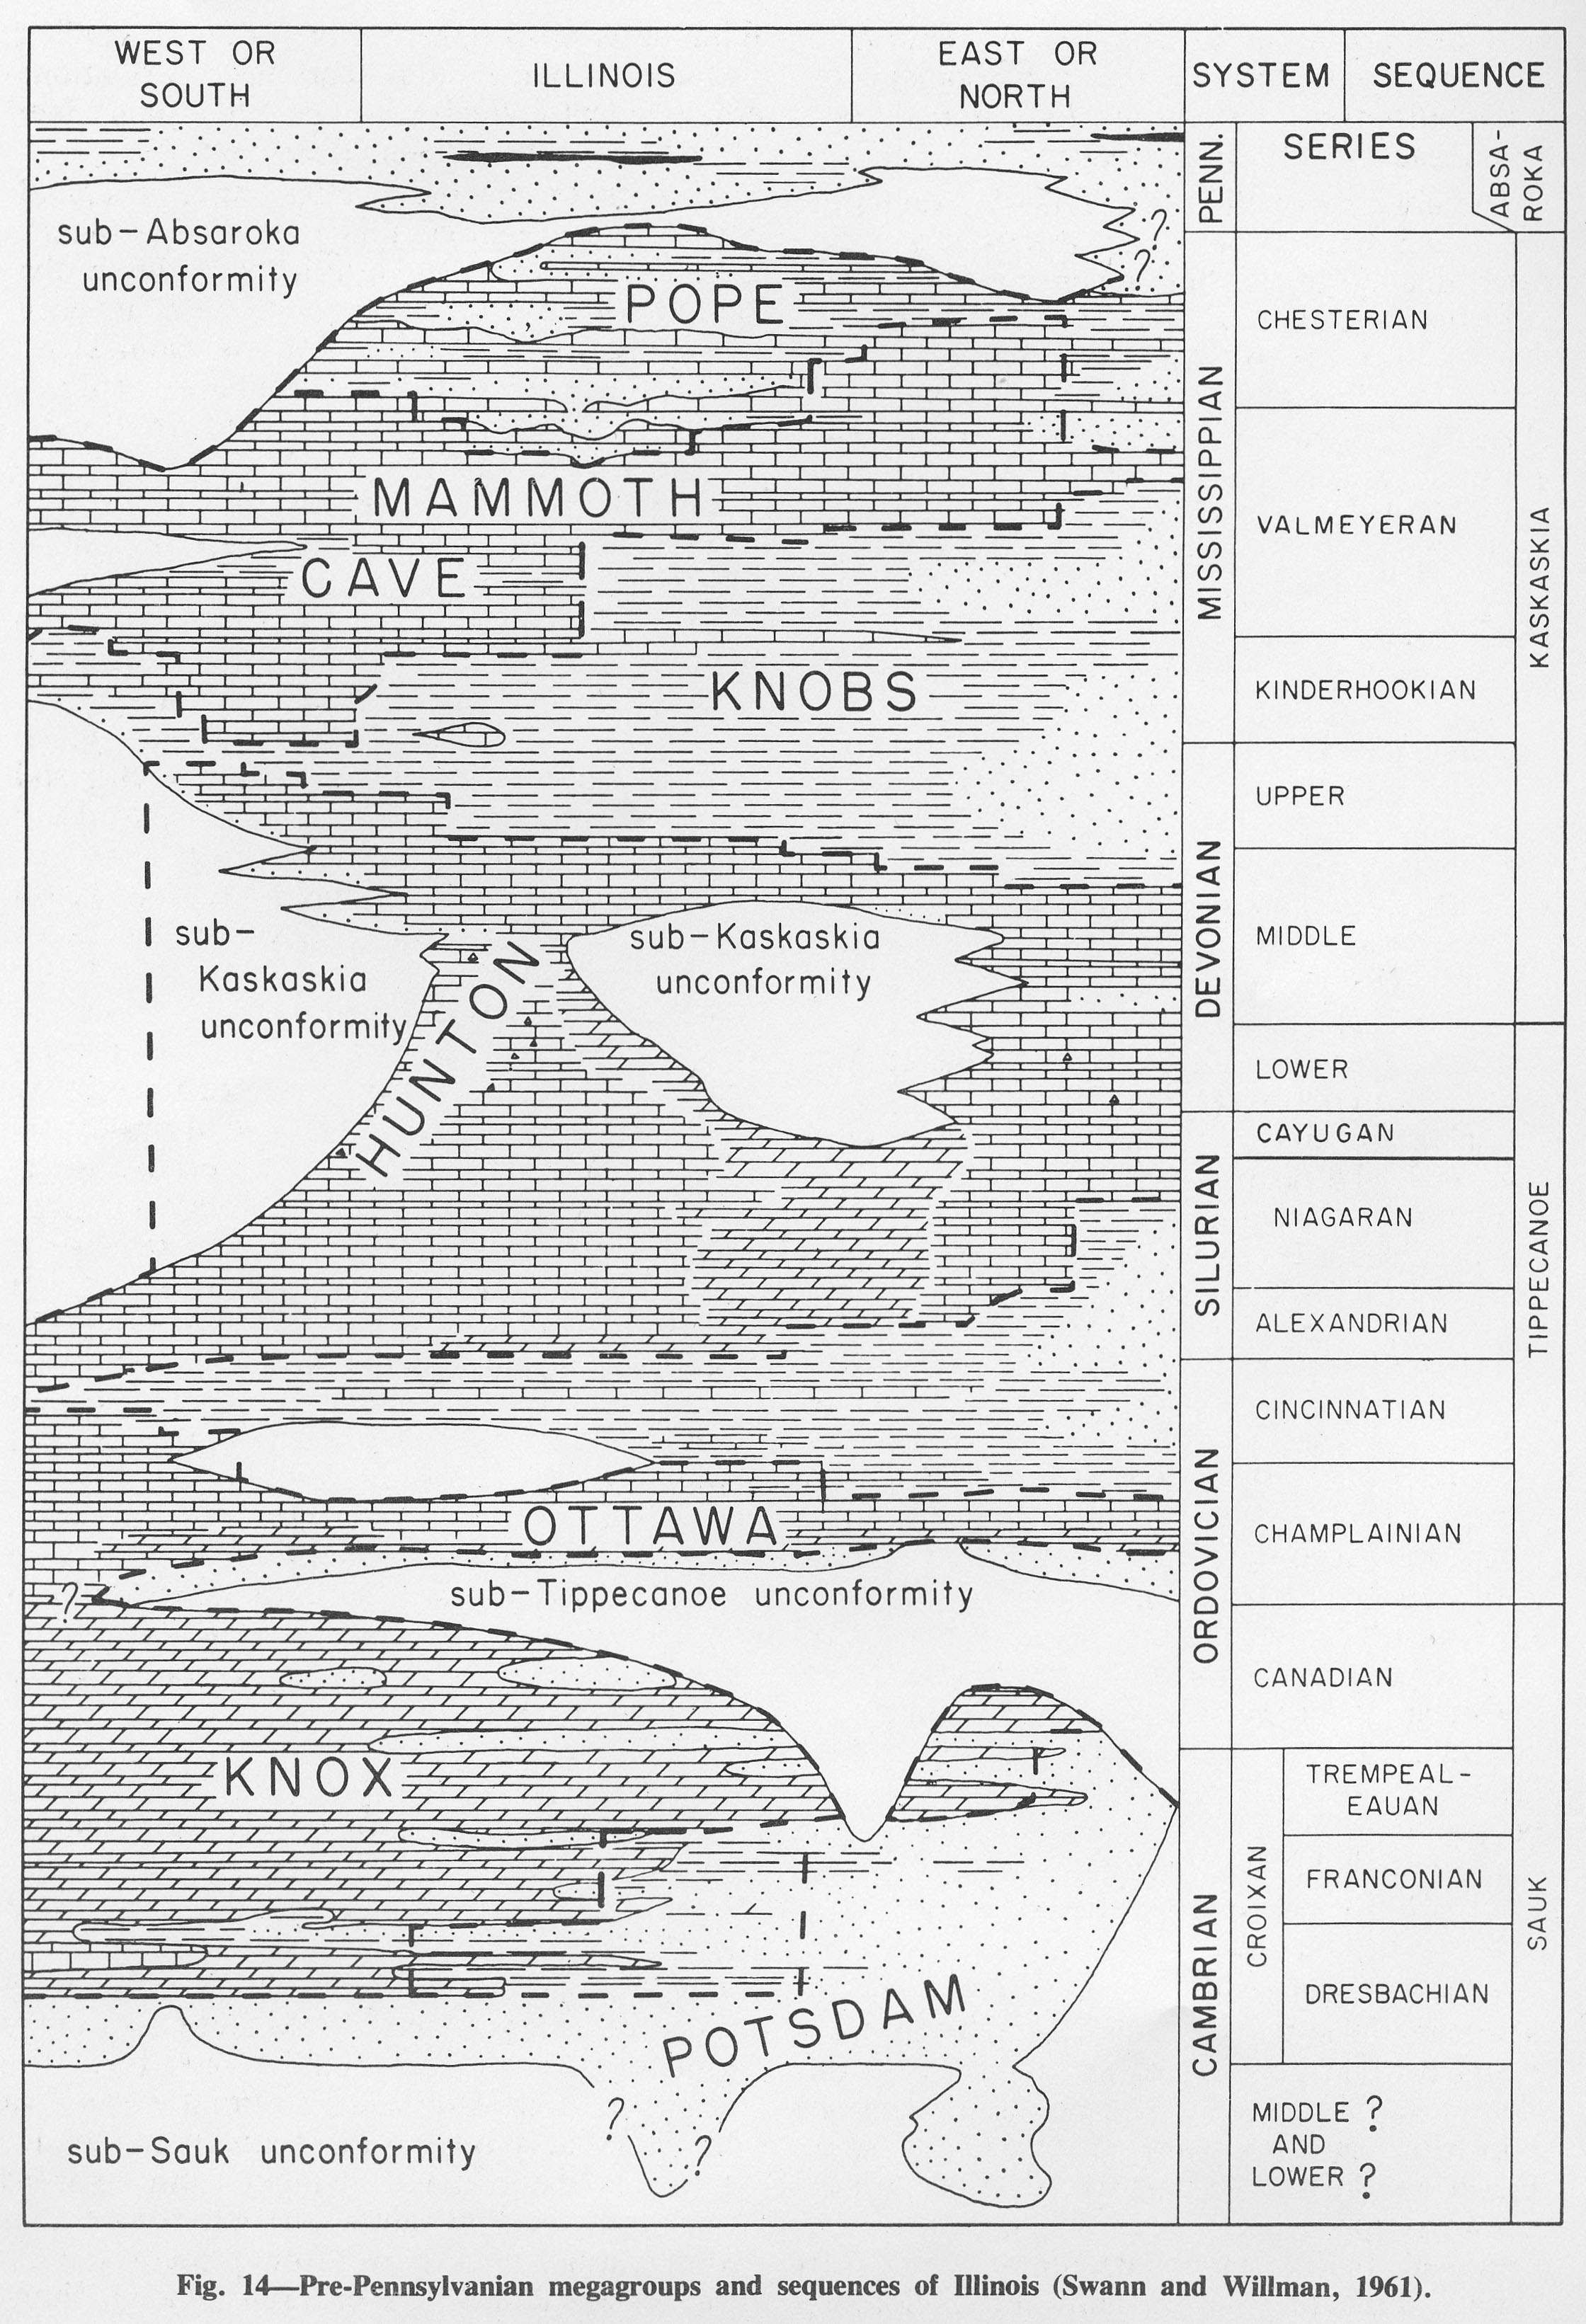
| 19:36, 1 April 2016 | Figure 14.jpg (file) |  |
1.08 MB | Alan.Myers | Fig. 14 -- Pre-Pennsylvanian megagroups and sequences of Illinois (Swann and Willman, 1961). | 1 |
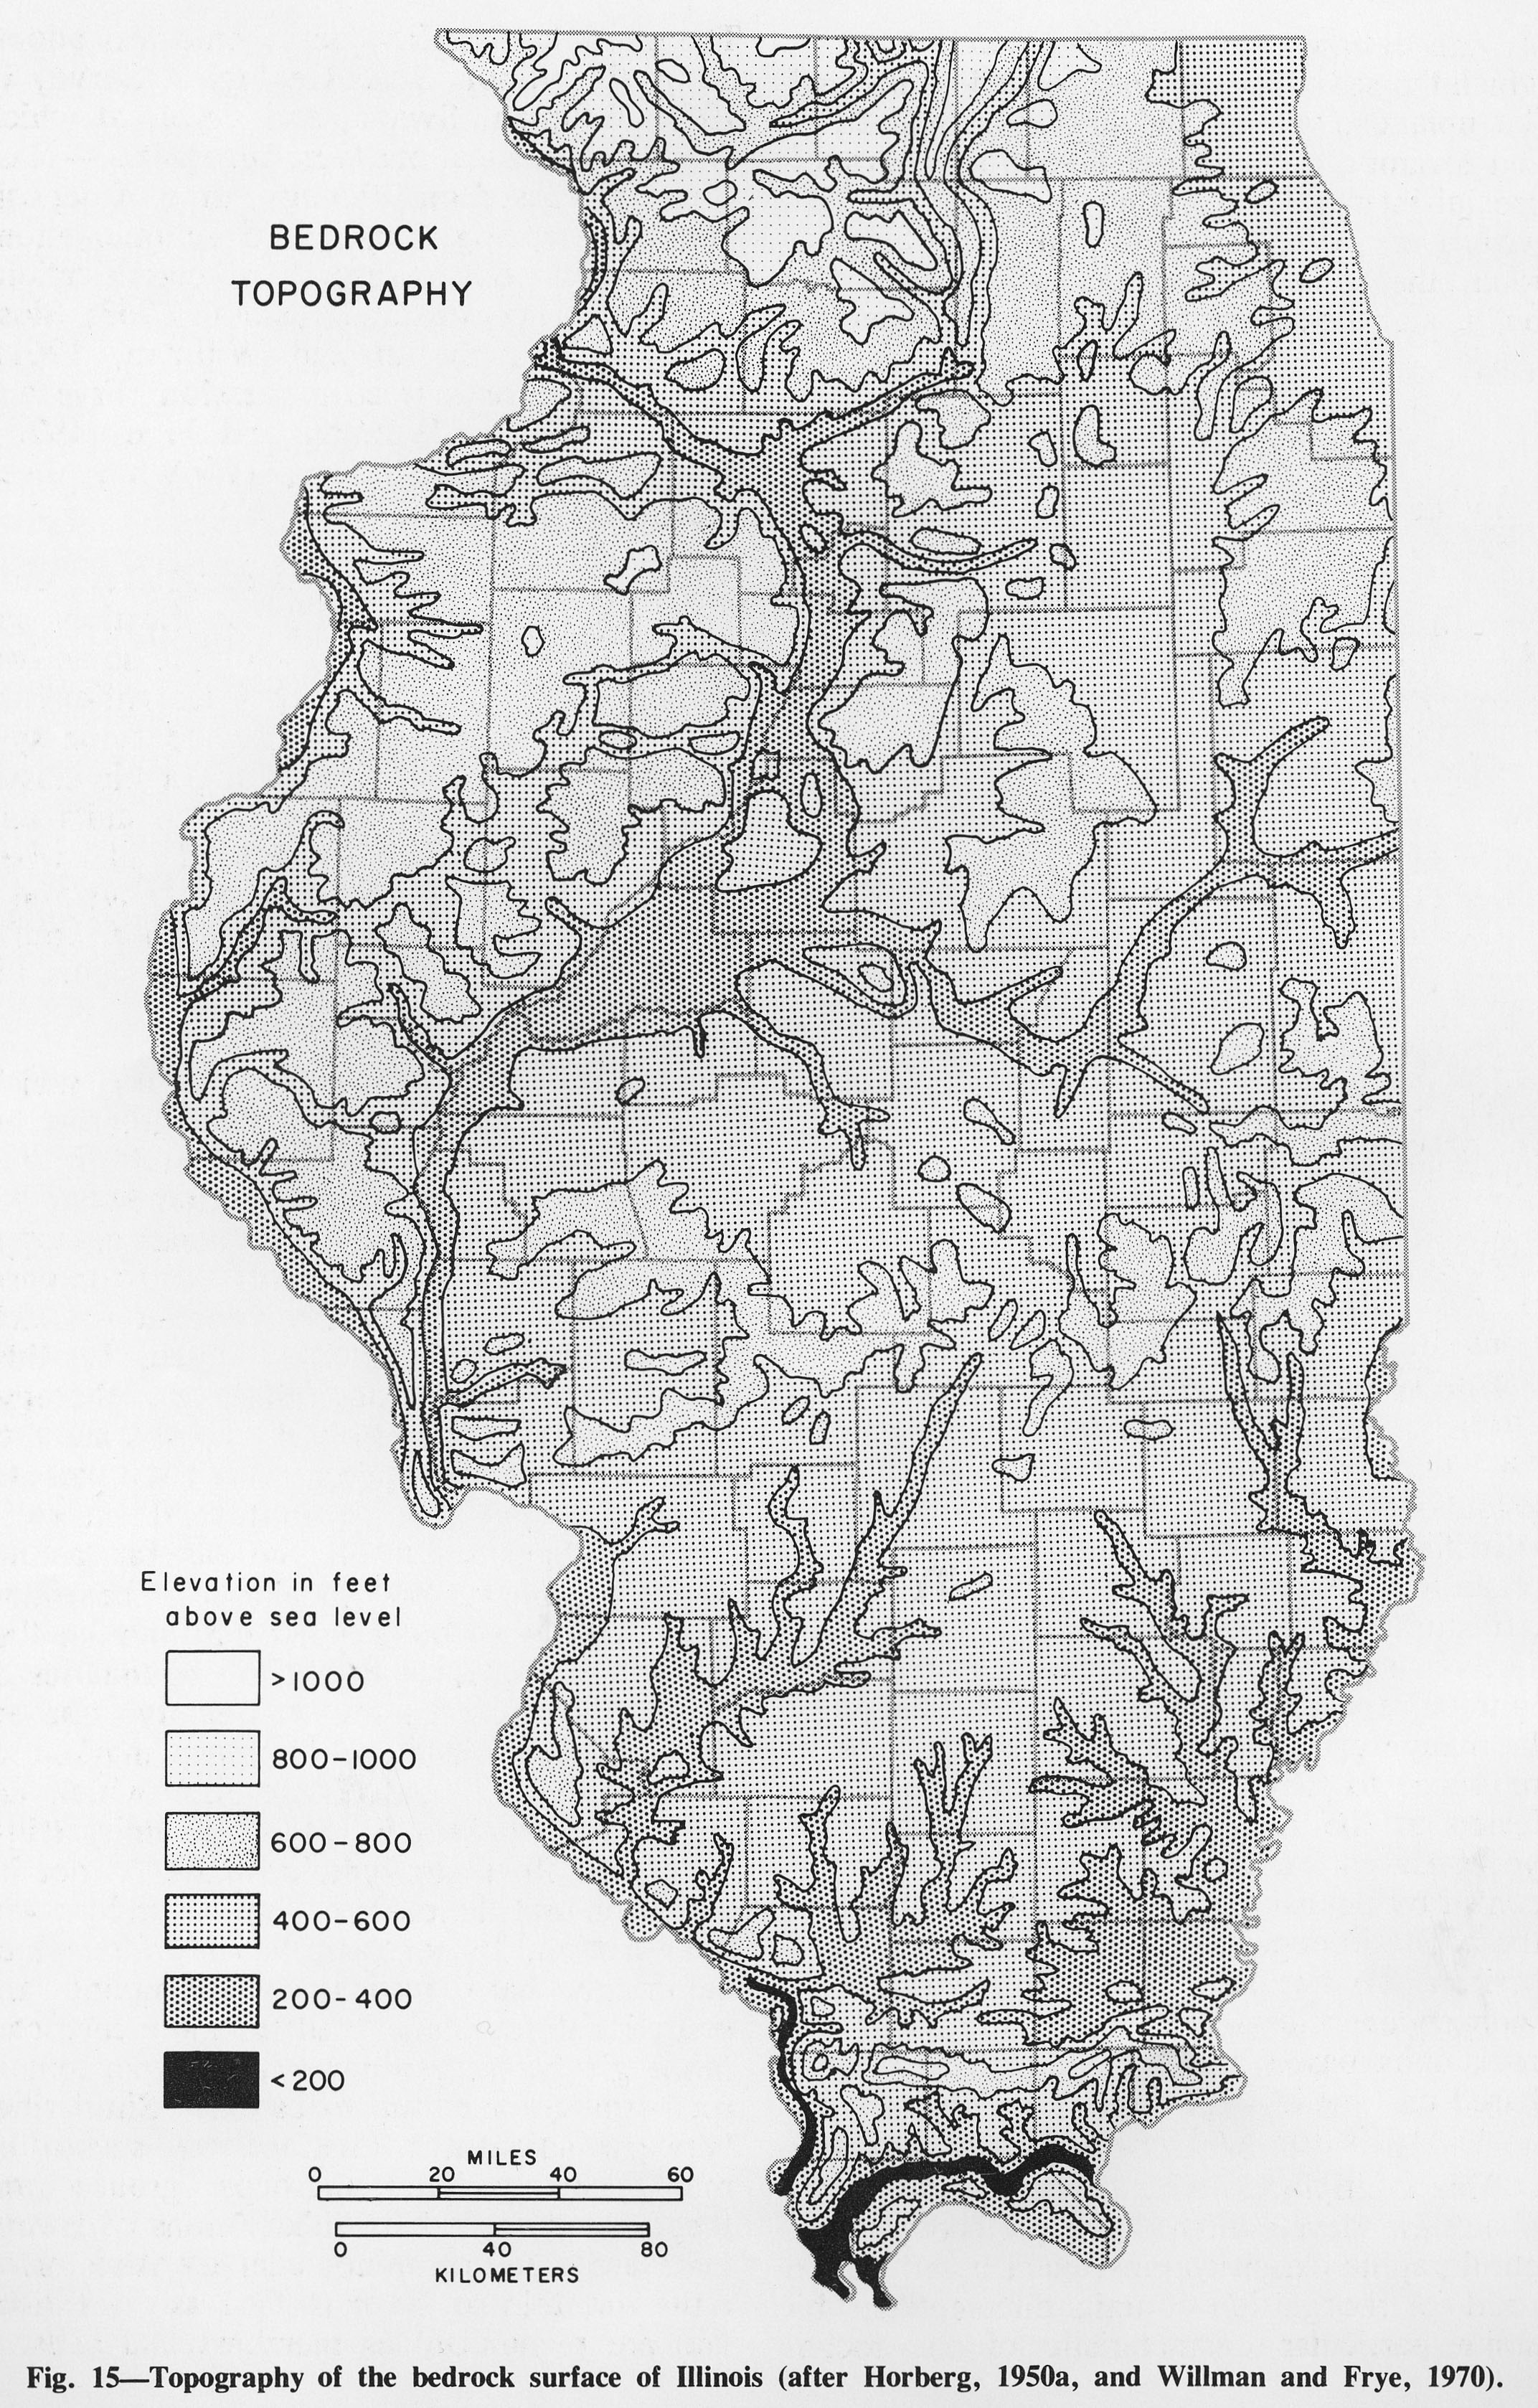
| 19:38, 1 April 2016 | Figure 15.jpg (file) |  |
1.73 MB | Alan.Myers | Fig. 15 -- Topography of the bedrock surface of Illinois (after Horberg, 1950a and Willman and Frye, 1970). | 1 |
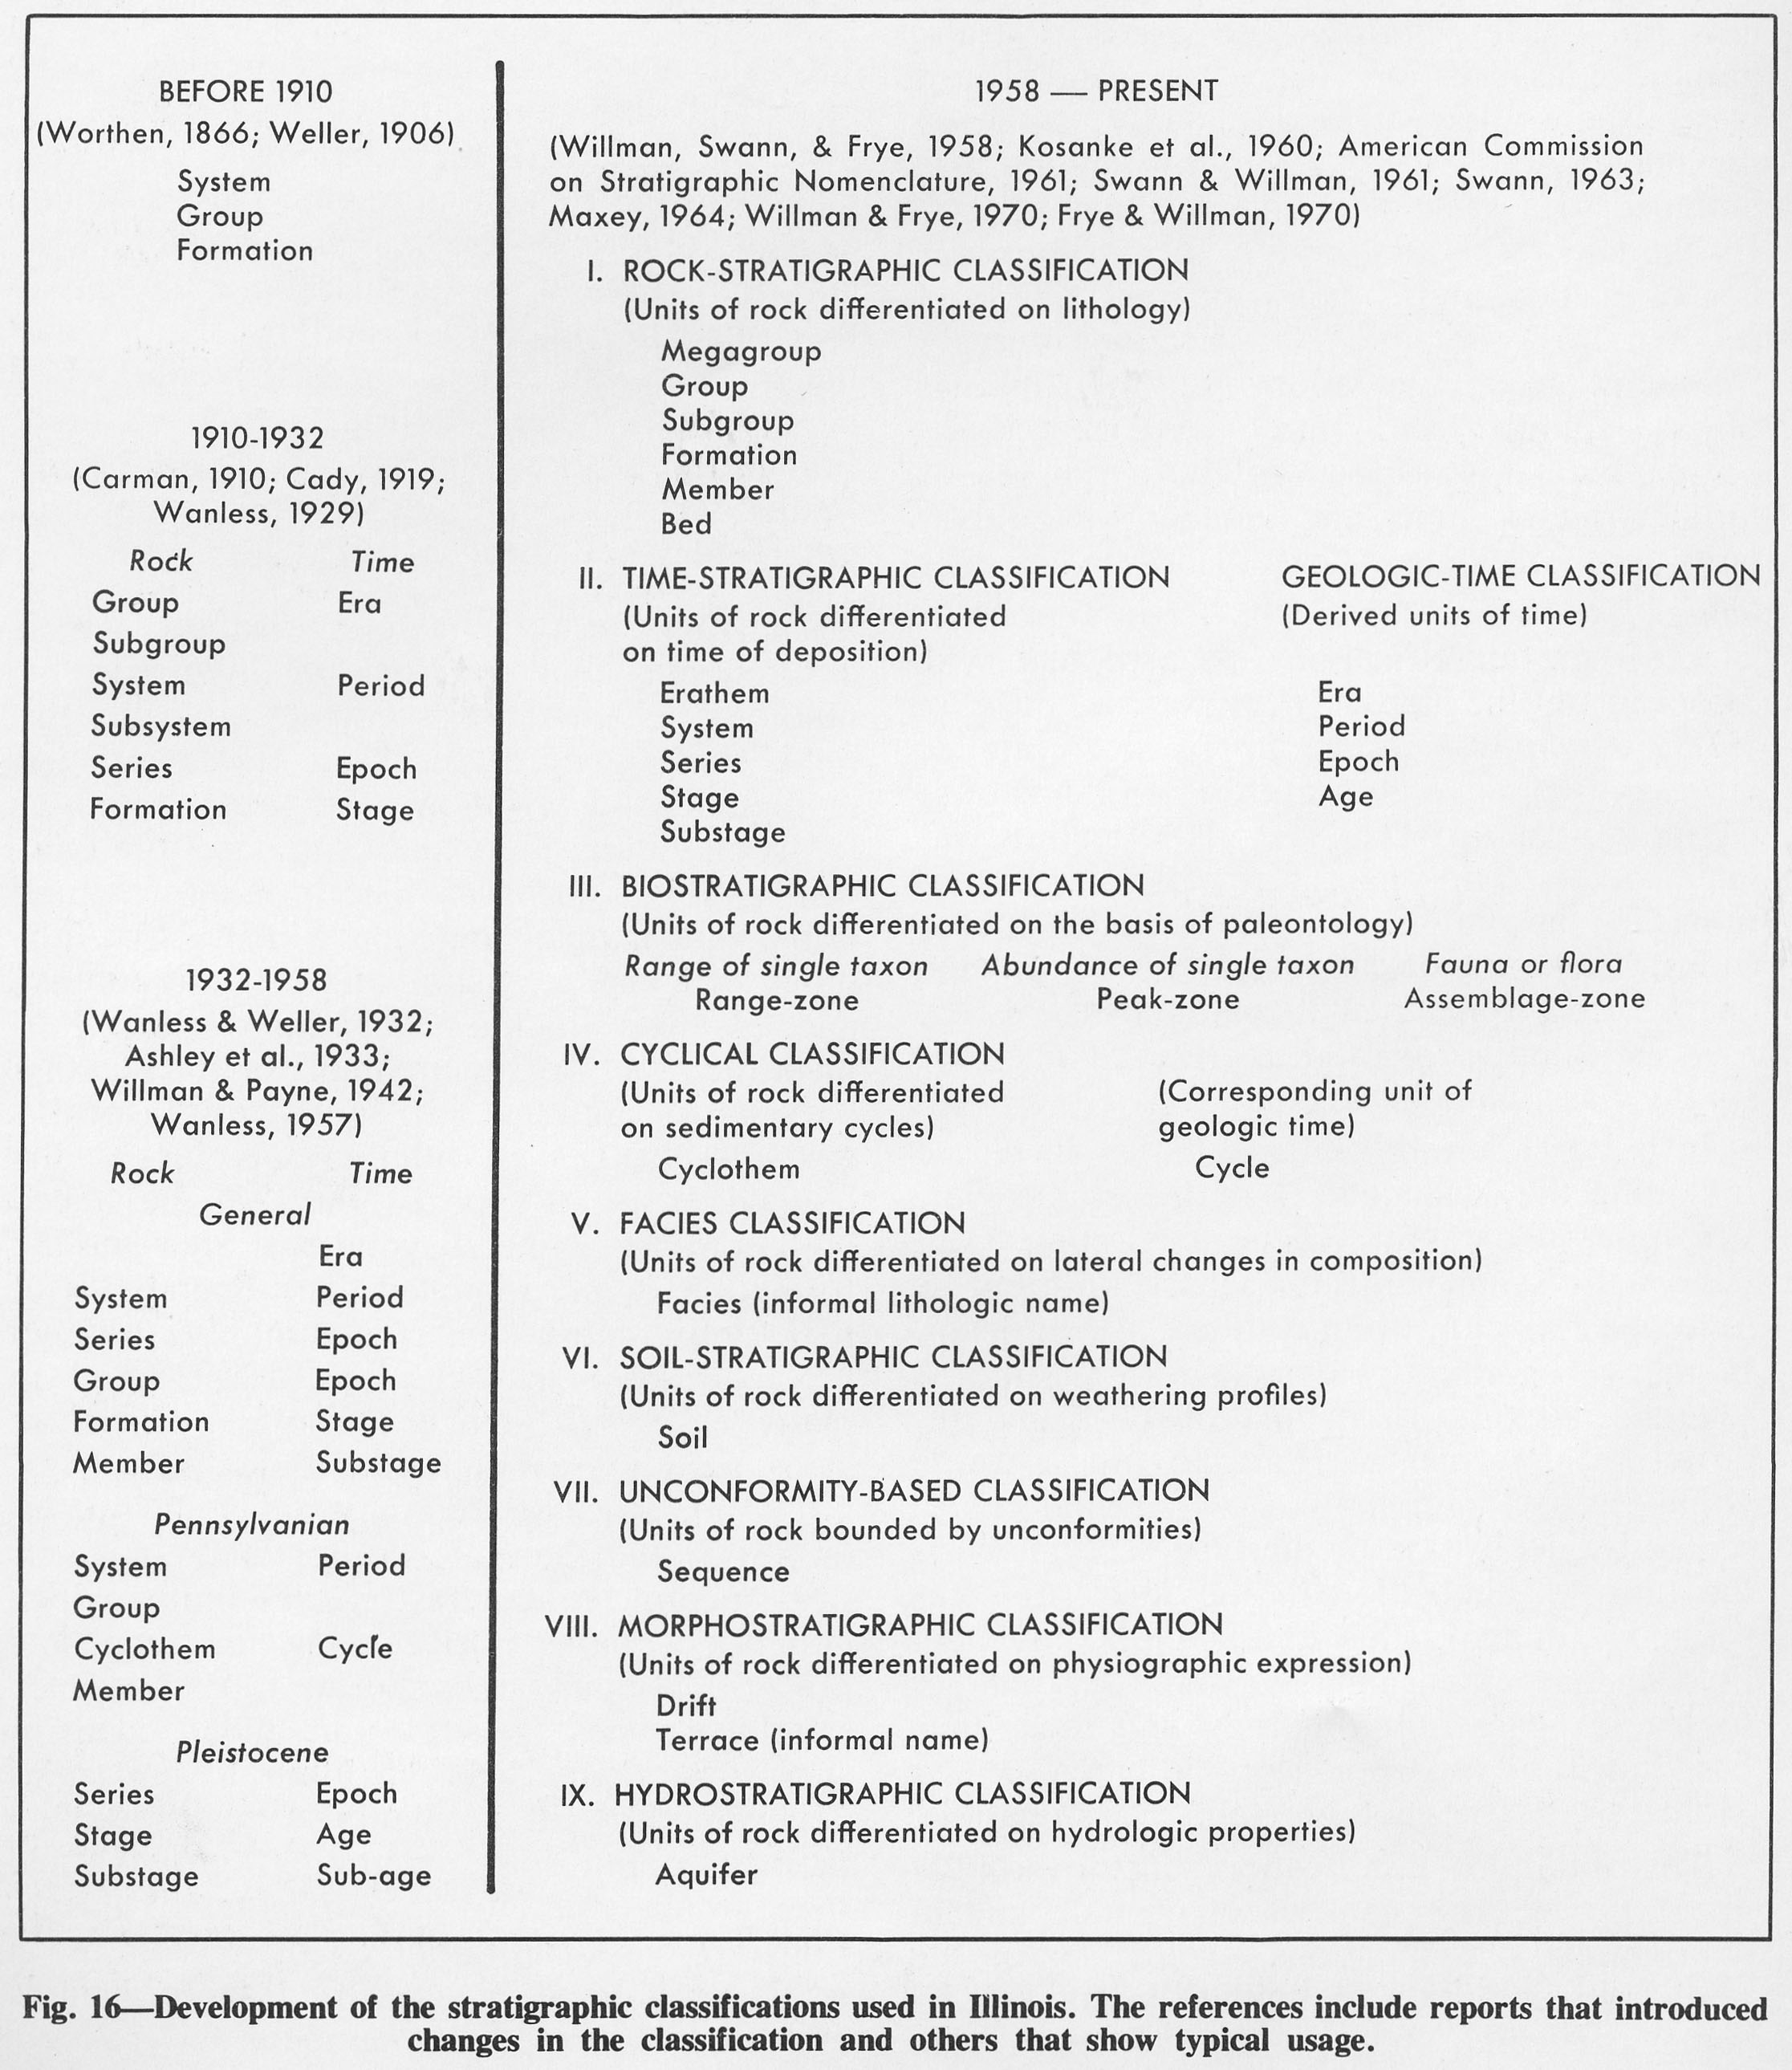
| 19:39, 1 April 2016 | Figure 16.jpg (file) |  |
610 KB | Alan.Myers | Fig. 16 -- Development of the stratigraphic classifications used in Illinois. The references include reports that introduced changes in the classification and others that show typical usage. | 1 |
| 19:40, 1 April 2016 | Figure 17.jpg (file) |  |
301 KB | Alan.Myers | Fig. 17 -- Patterns and symbols used in figures. | 1 |
| 19:41, 1 April 2016 | Figure C-2.jpg (file) |  |
321 KB | Alan.Myers | Fig. C-2 --Thickness of the Cambrian System. The dashed lines show reconstructed thickness. | 1 |
| 19:42, 1 April 2016 | Figure C-3.jpg (file) |  |
377 KB | Alan.Myers | Fig. C-3 -- columnar section of the Cambrian System. | 1 |
| 19:43, 1 April 2016 | Figure C-4.jpg (file) |  |
585 KB | Alan.Myers | Fig. C-4 -- Diagrammatic cross section of the Cambrian System from northwestern to southeastern Illinois. | 1 |
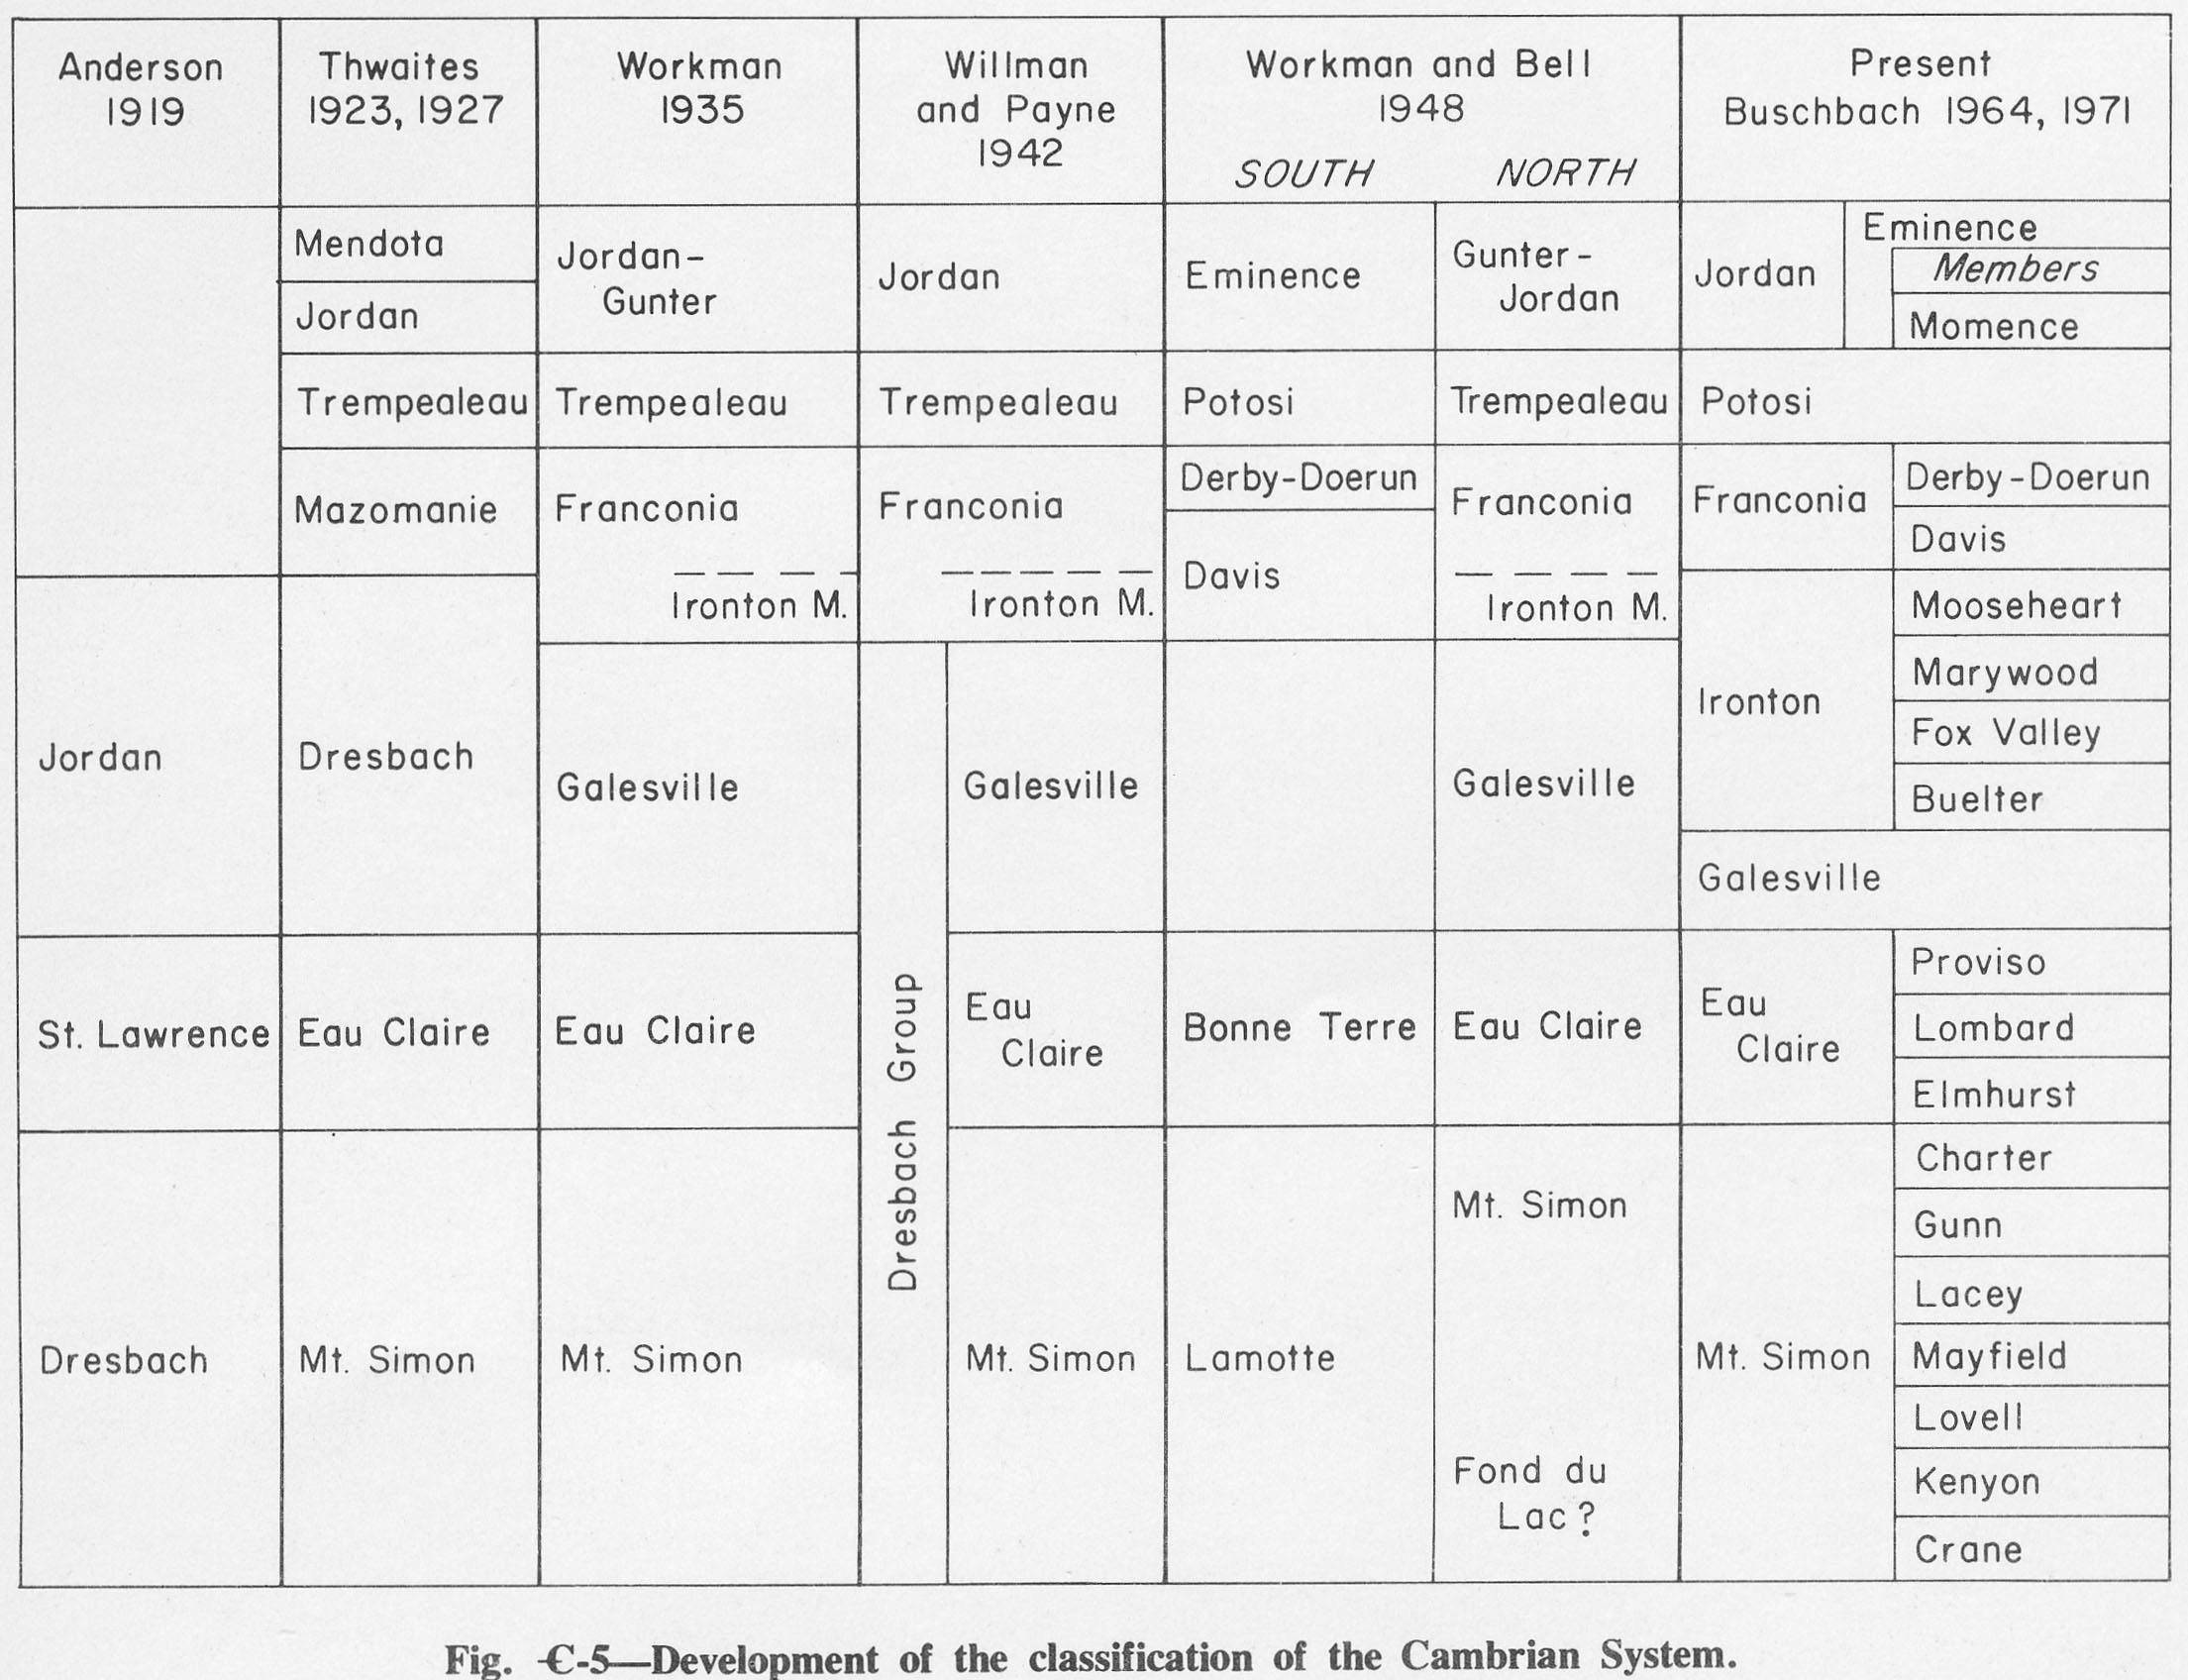
| 19:44, 1 April 2016 | Figure C-5.jpg (file) |  |
388 KB | Alan.Myers | Fig. C-5 -- Development of the classification of the Cambrian System. | 1 |
| 19:45, 1 April 2016 | Figure C-6.jpg (file) |  |
233 KB | Alan.Myers | Fig. C-6 -- Thickness of the Mt. Simon Sandstone. | 1 |
| 19:46, 1 April 2016 | Figure C-7.jpg (file) |  |
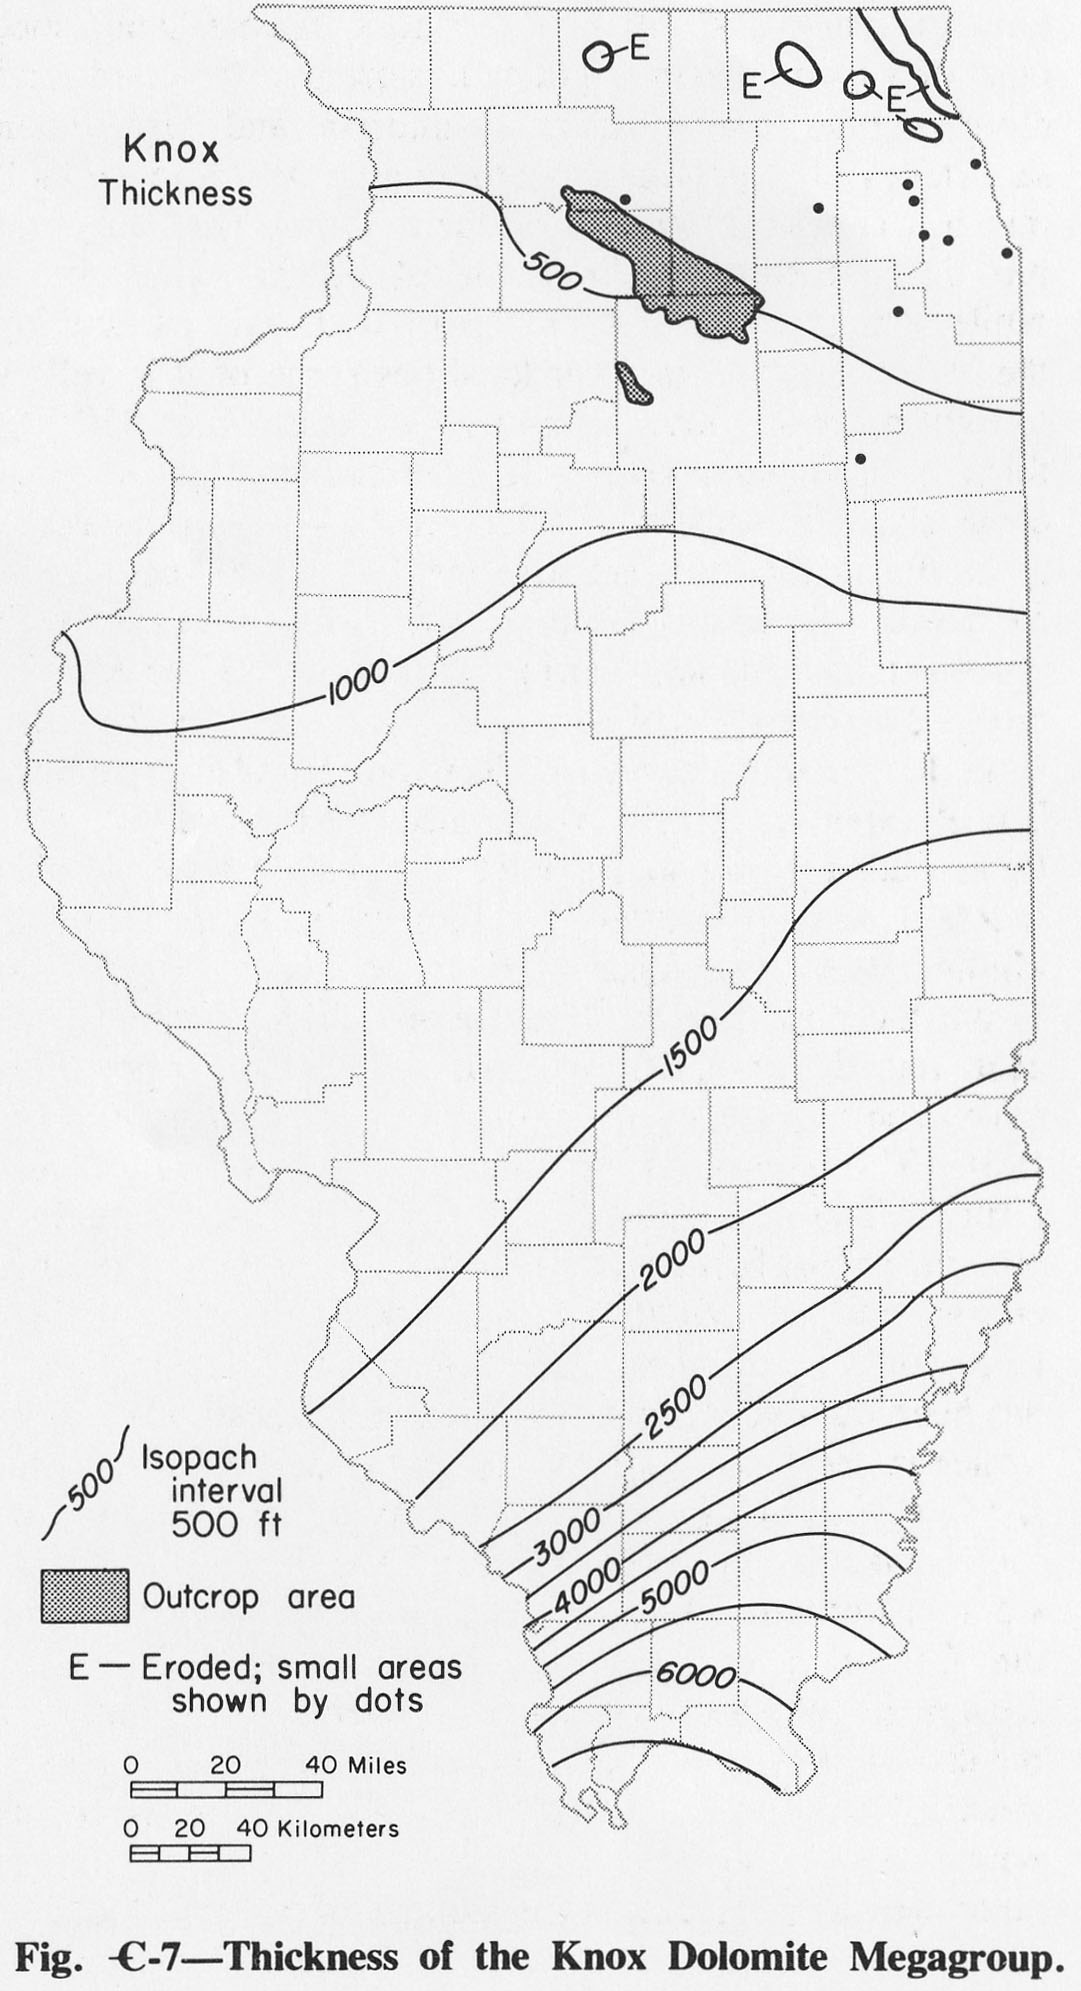
261 KB | Alan.Myers | Fig. C-7 -- Thickness of the Knox Dolomite Megagroup. | 1 |
| 19:47, 1 April 2016 | Figure C-8.jpg (file) |  |
260 KB | Alan.Myers | Fig. C-8 -- Thickness of the Eau Claire Formation. | 1 |
| 19:47, 1 April 2016 | Figure C-9.jpg (file) |  |
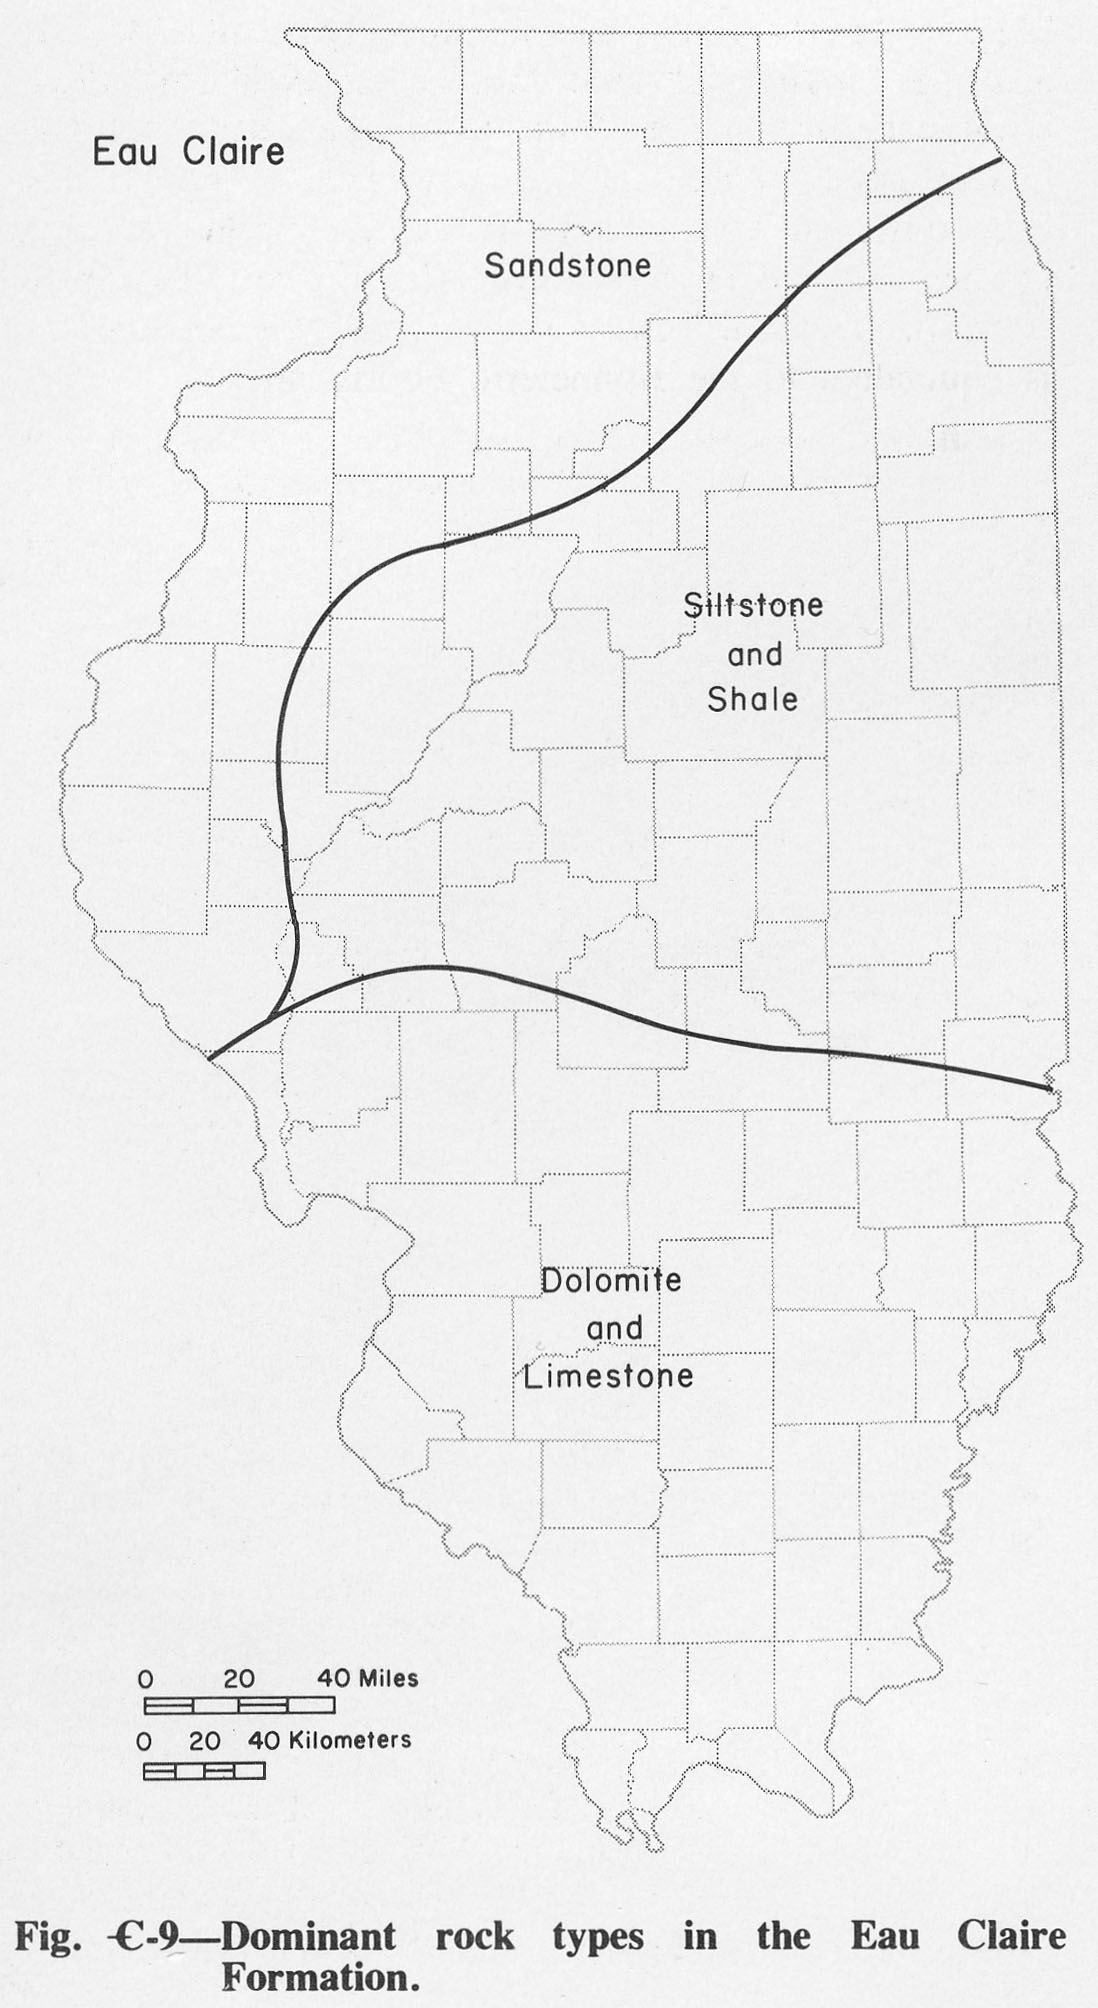
231 KB | Alan.Myers | Fig. C-9 -- Dominant rock types in the Eau Claire Formation. | 1 |
| 19:48, 1 April 2016 | Figure C-10.jpg (file) |  |
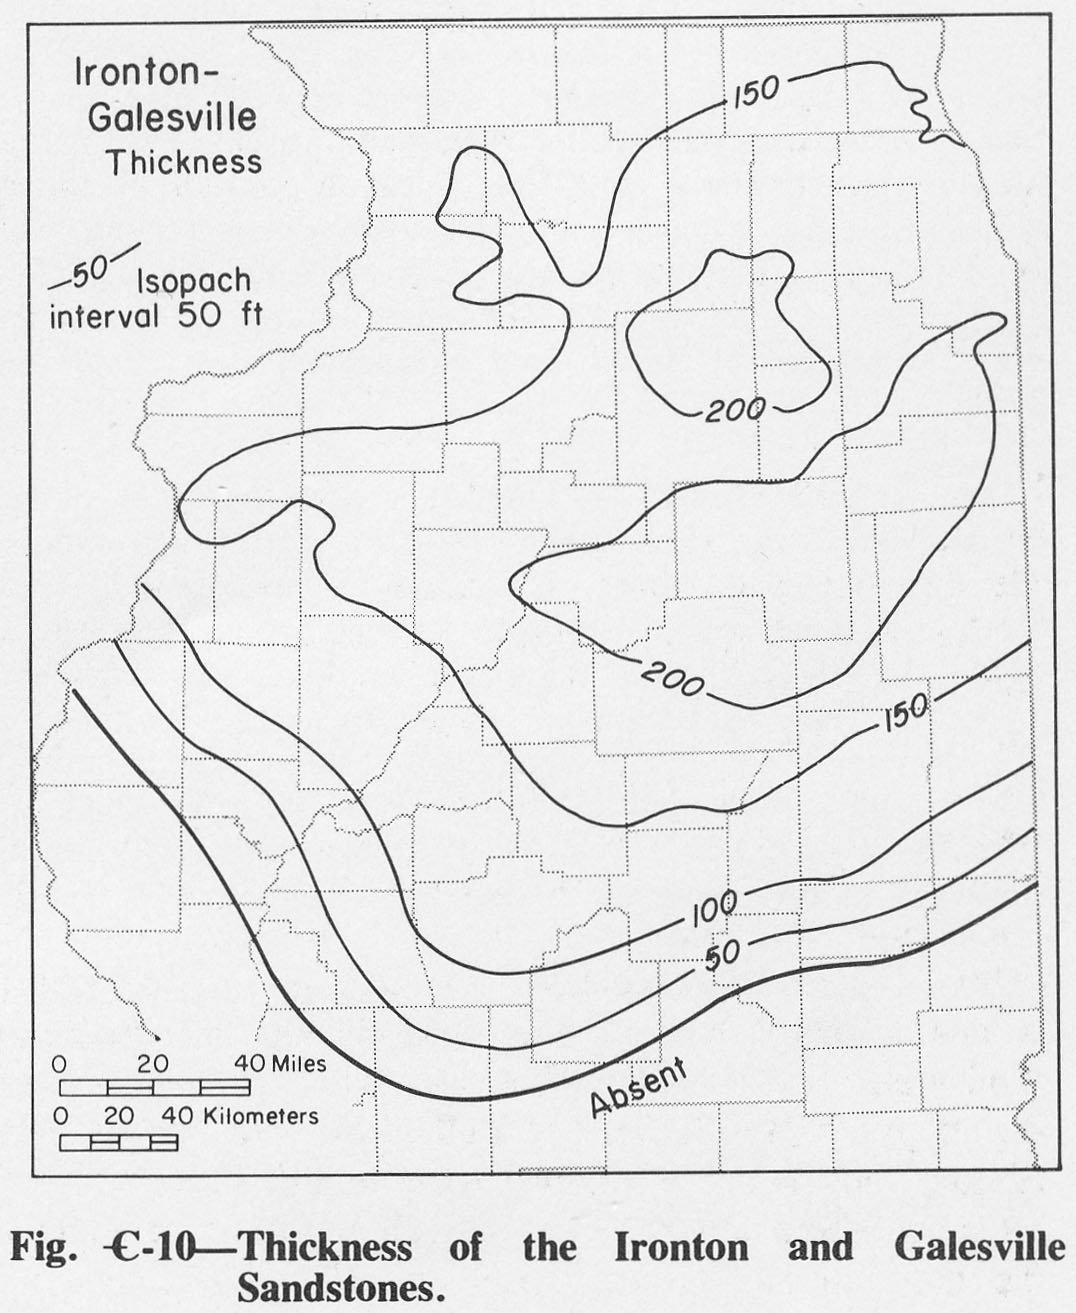
204 KB | Alan.Myers | Fig. C-10 -- Thickness of the Ironton and Galesville Sandstones. | 1 |
| 19:49, 1 April 2016 | Figure C-11.jpg (file) |  |
263 KB | Alan.Myers | Fig. C- 11 -- Thickness of the Franconia Formation | 1 |
| 19:50, 1 April 2016 | Figure C-12.jpg (file) |  |
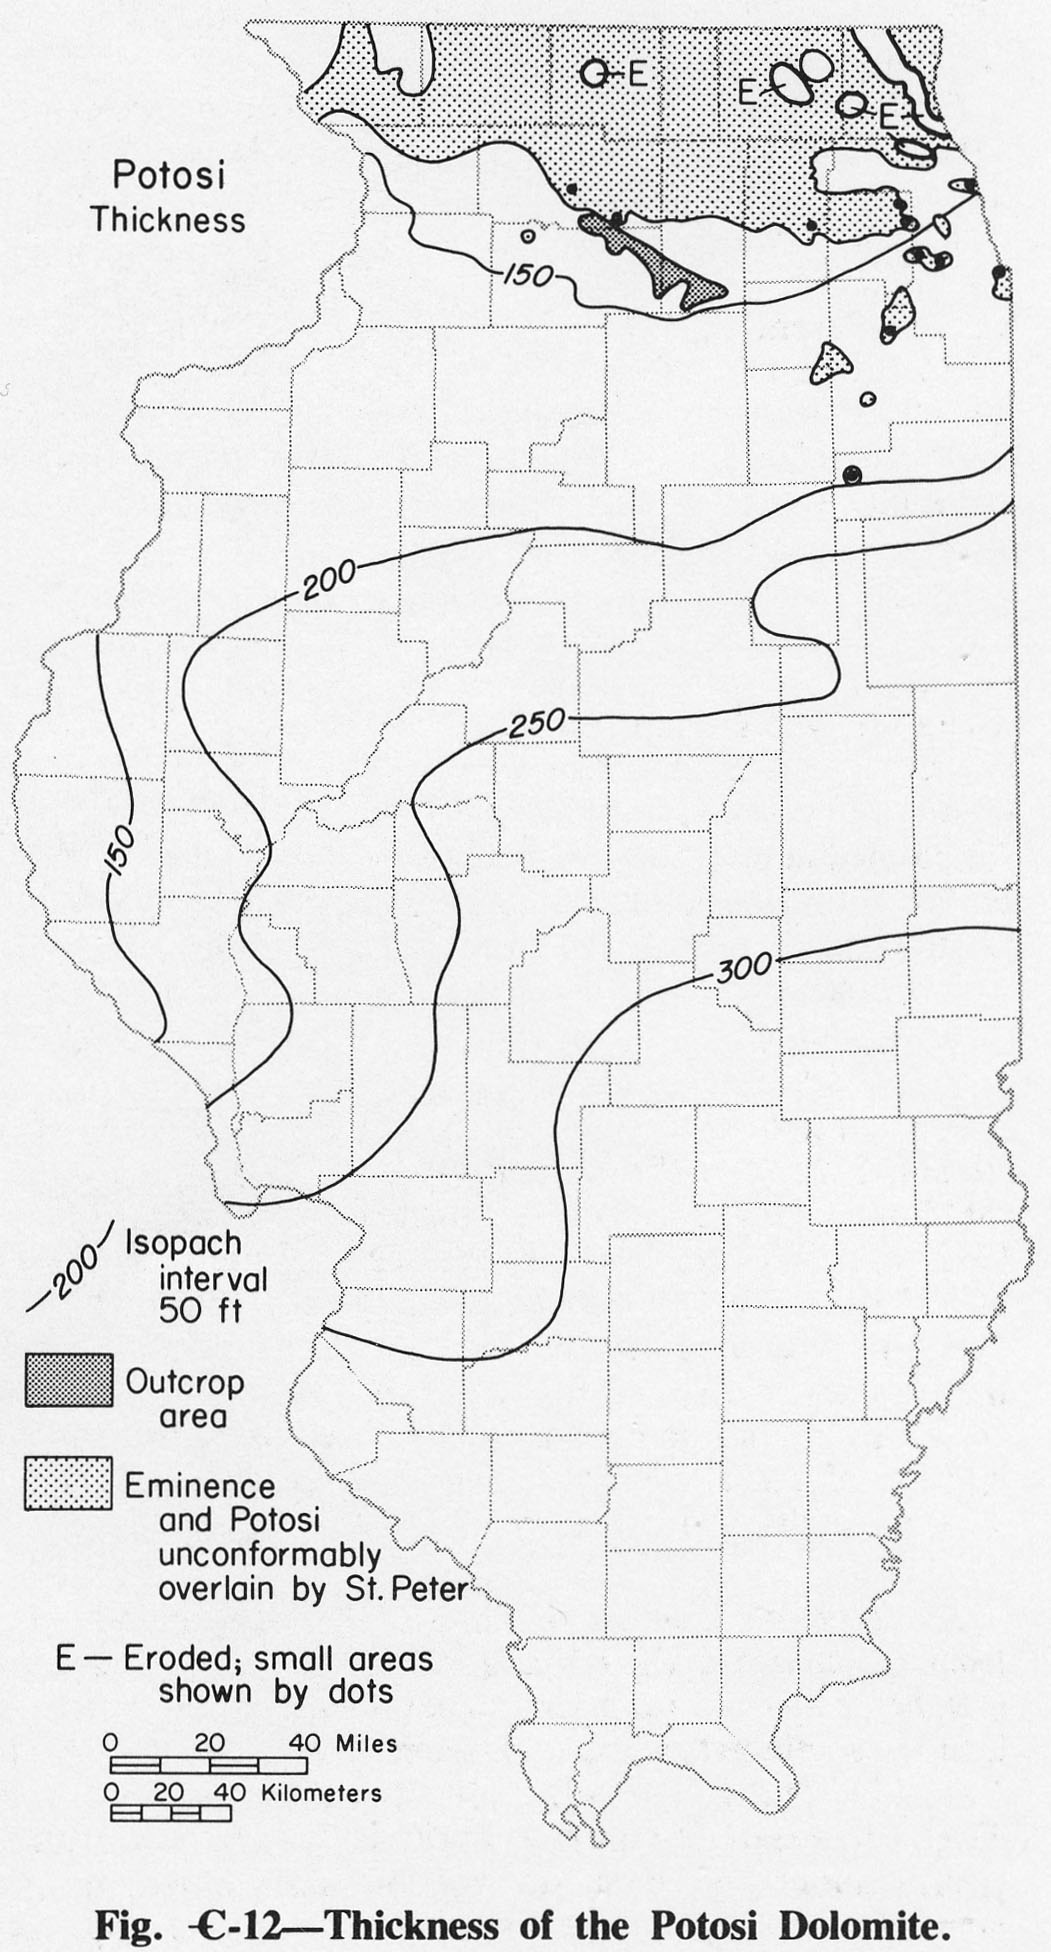
298 KB | Alan.Myers | Fig. C-12 -- Thickness of the Potosi Dolomite. | 1 |
| 19:51, 1 April 2016 | Figure C-13.jpg (file) |  |
293 KB | Alan.Myers | Fig. C-13 -- Thickness of the Eminence Formation. | 1 |
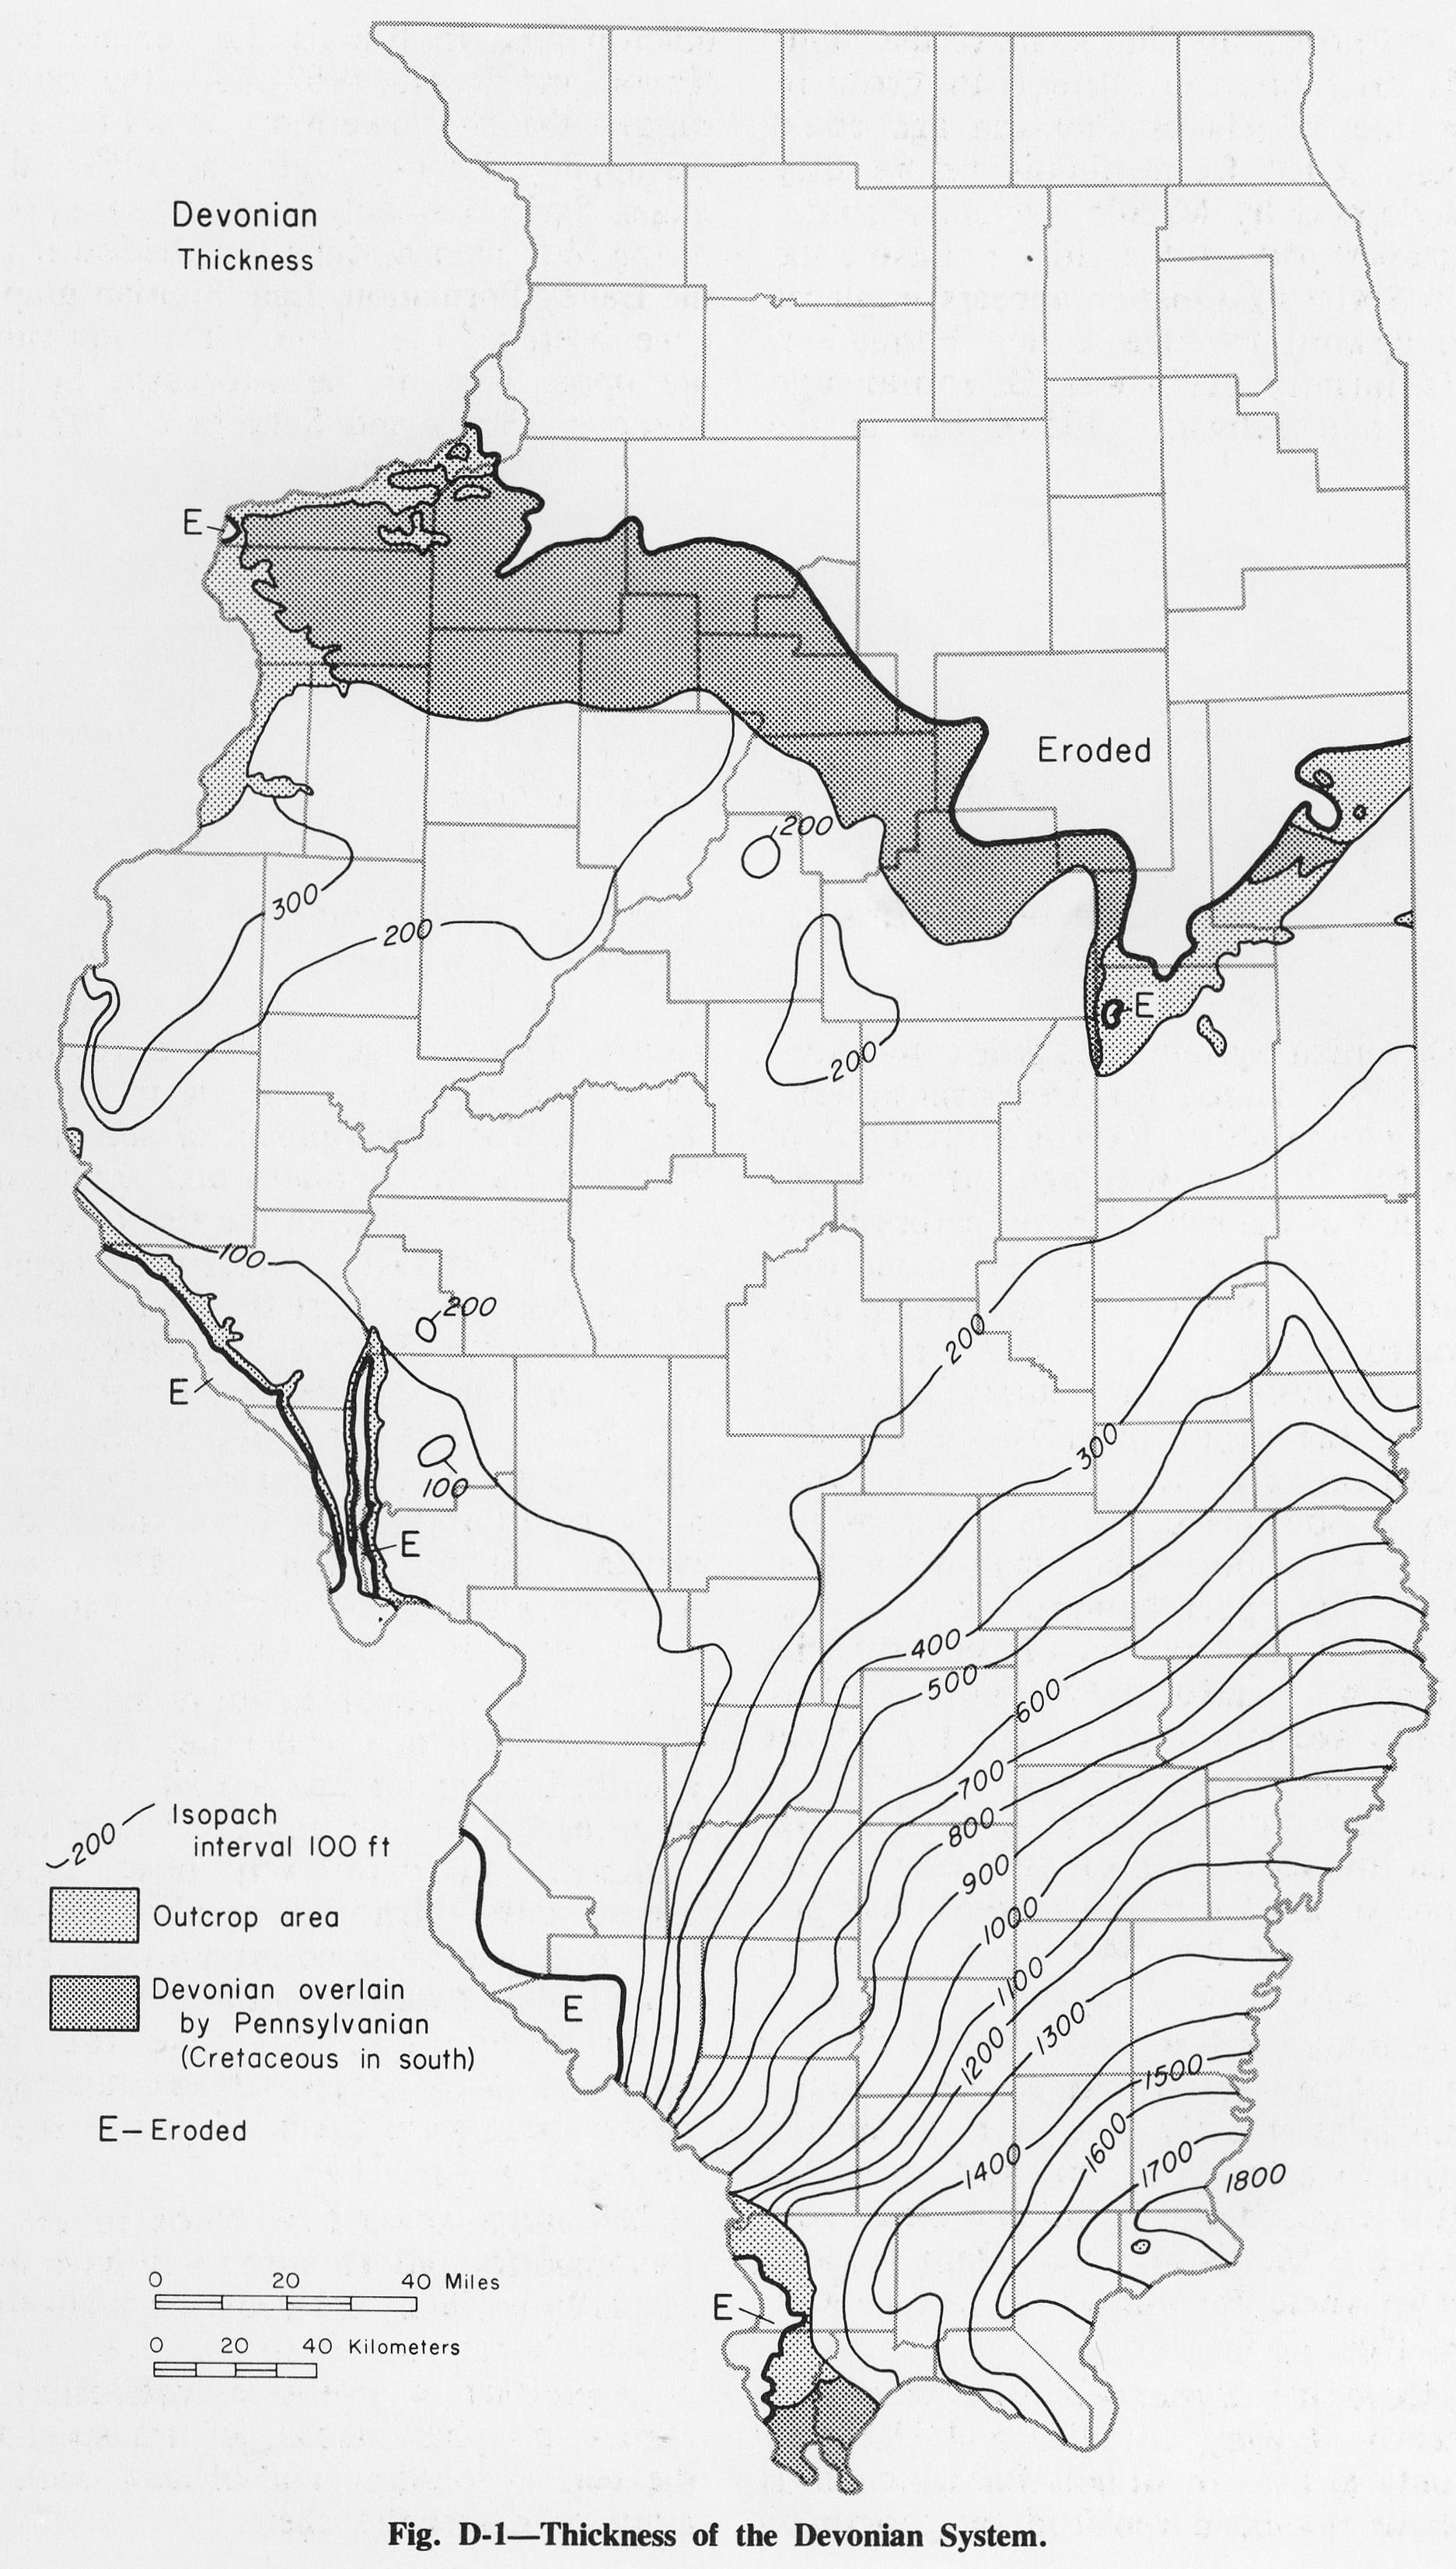
| 19:51, 1 April 2016 | Figure D-1.jpg (file) |  |
777 KB | Alan.Myers | Fig. D-1 -- Thickness of the Devonian Systems. | 1 |
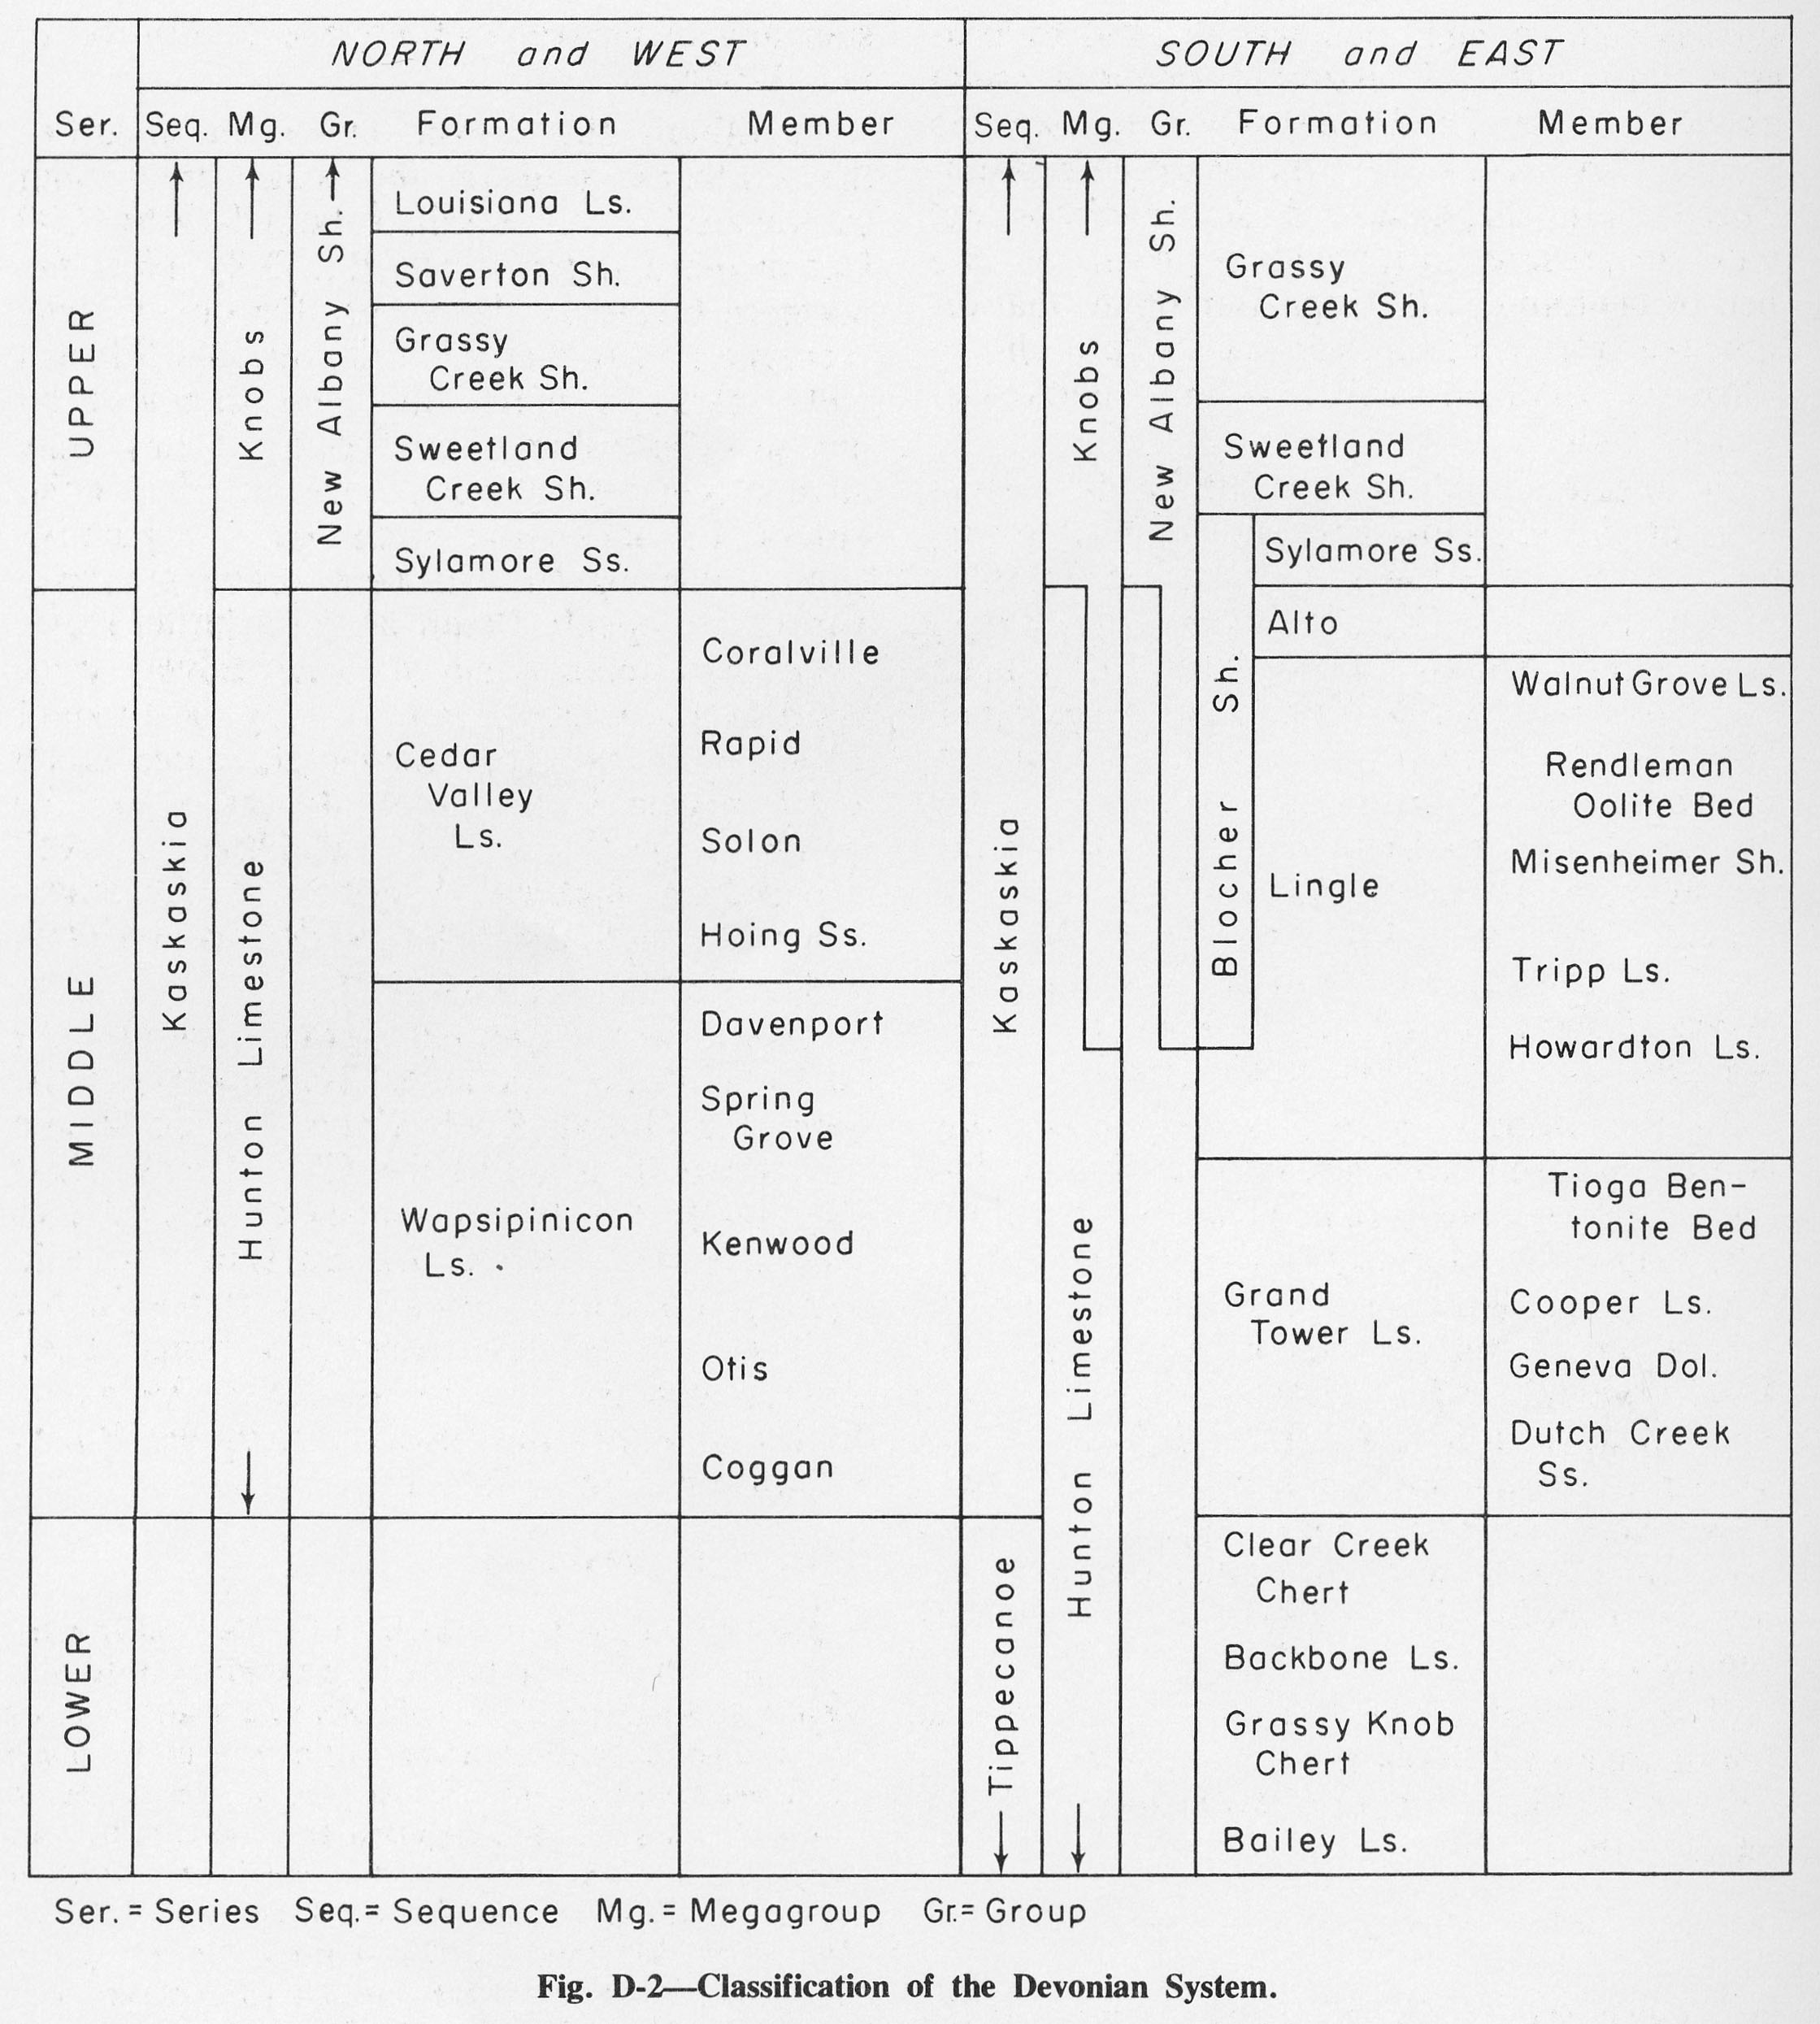
| 19:52, 1 April 2016 | Figure D-2.jpg (file) |  |
546 KB | Alan.Myers | Fig. D-2 -- Classification of the Devonian System. | 1 |
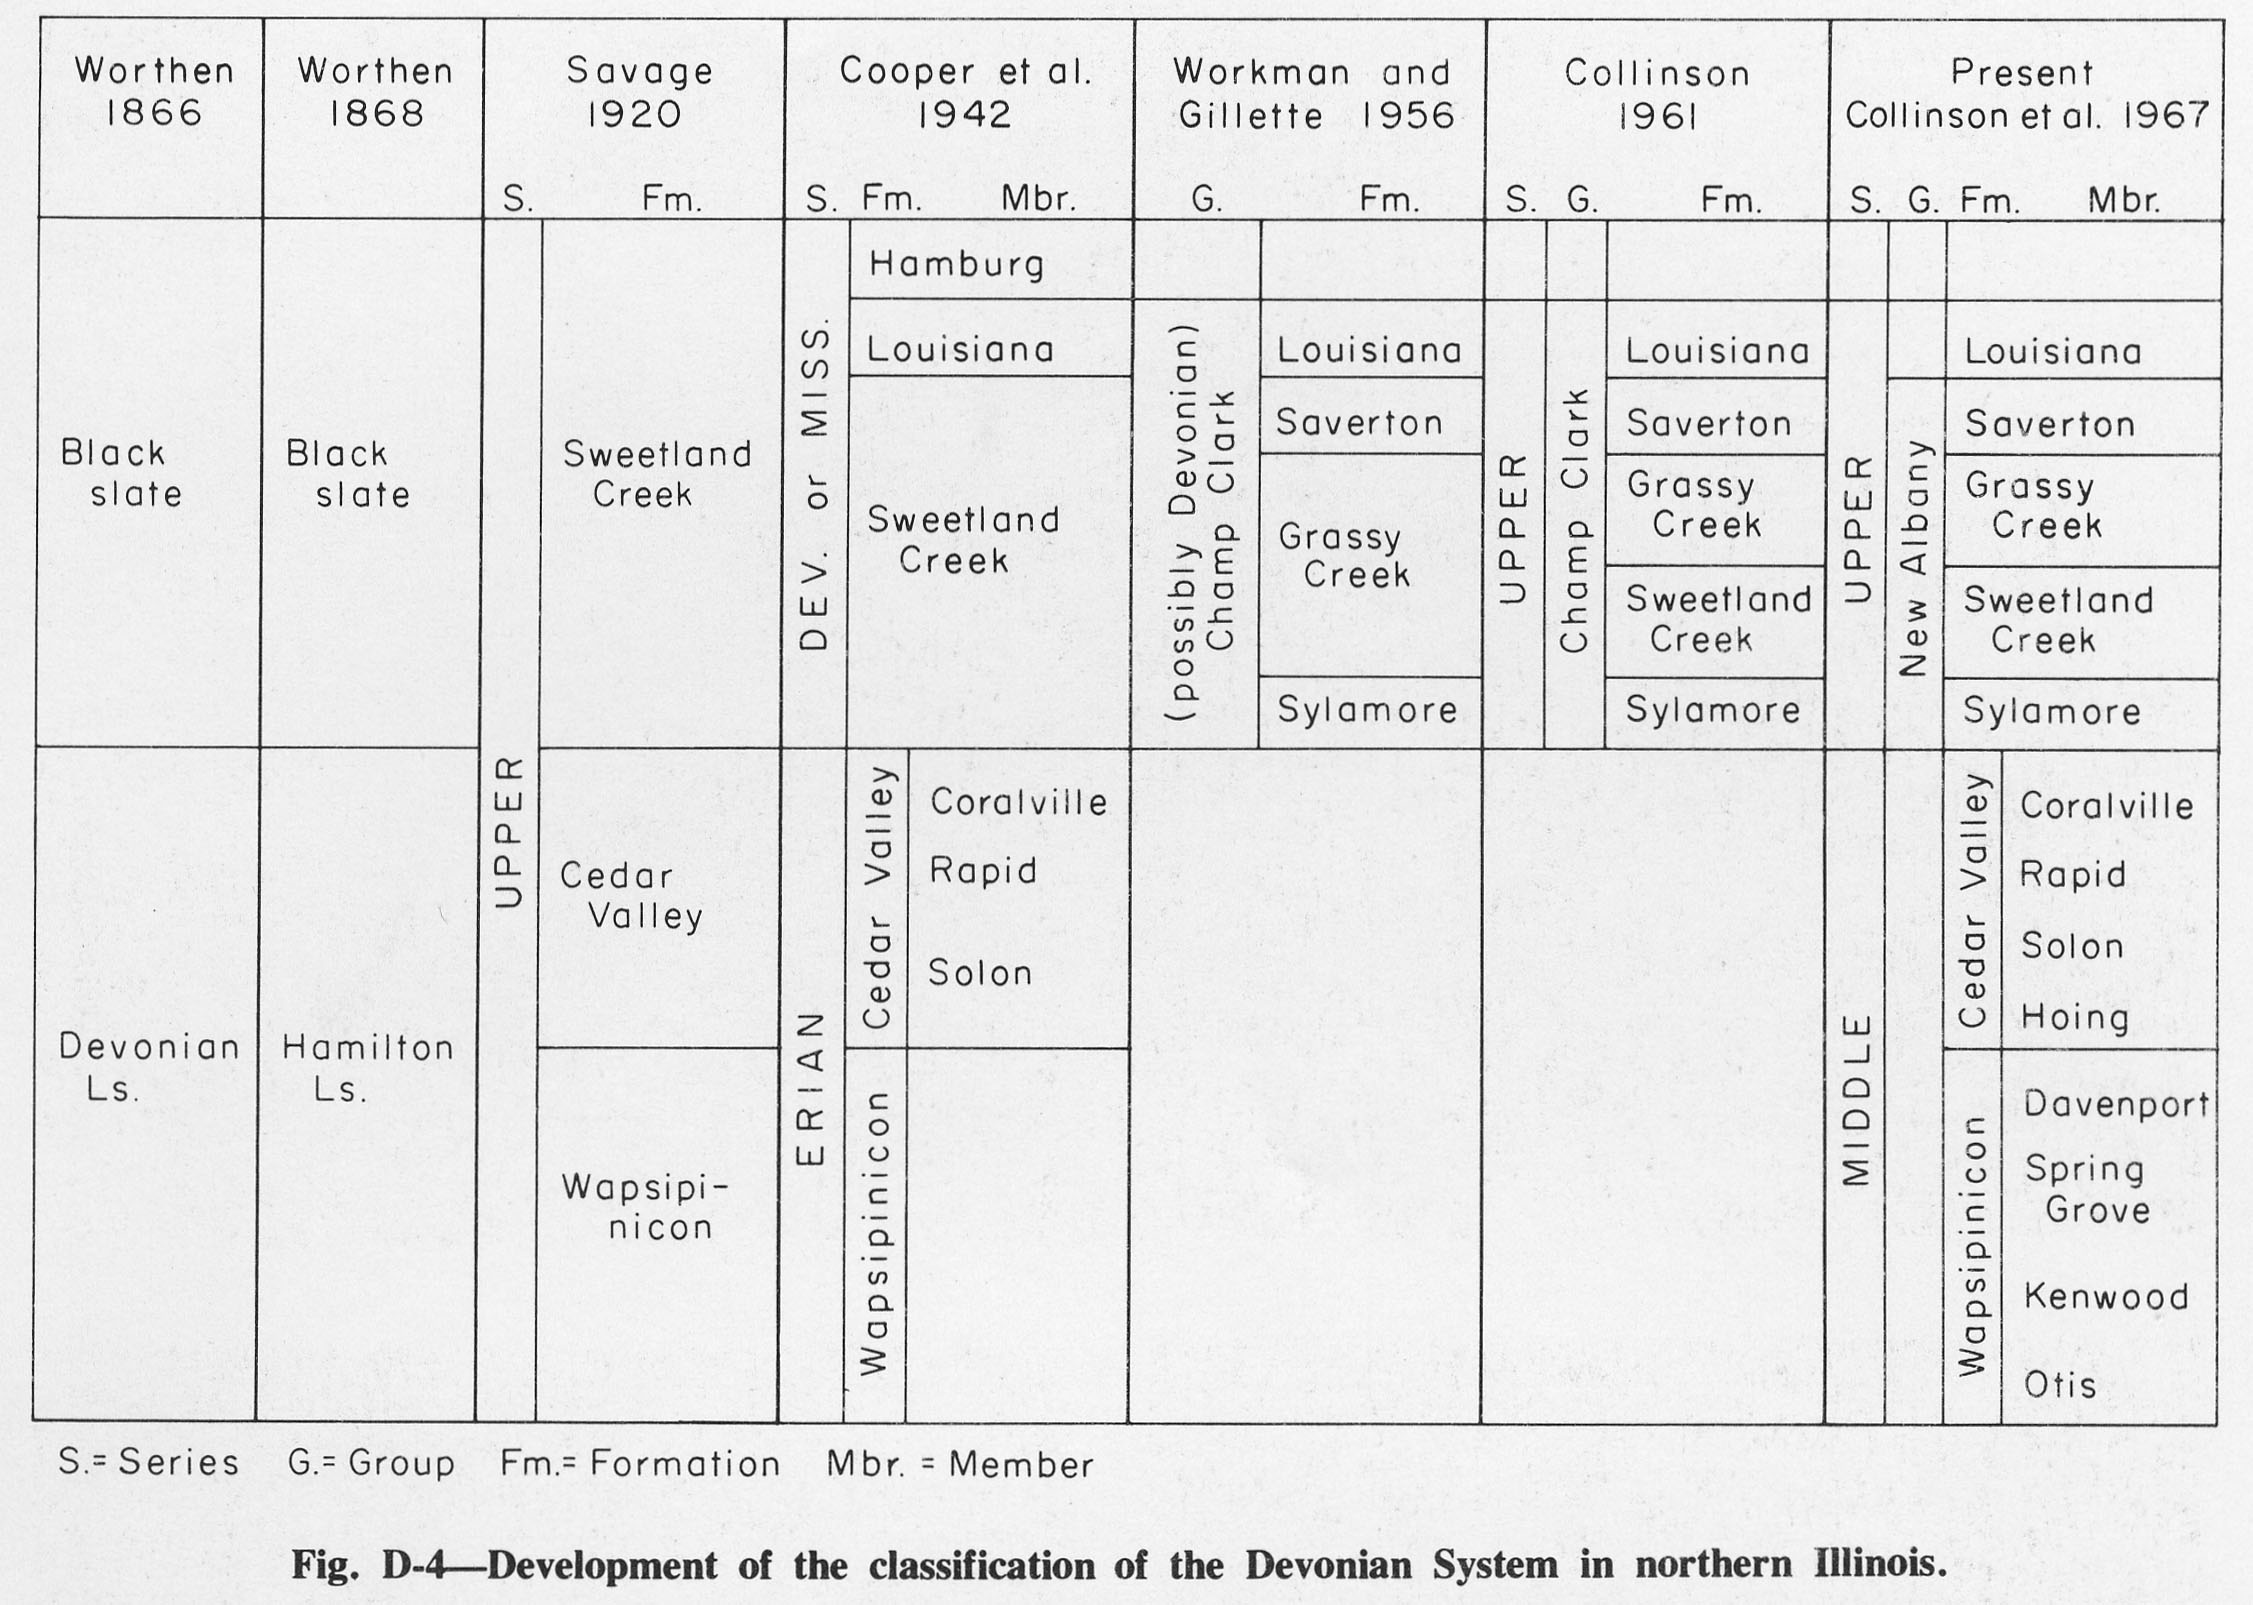
| 19:56, 1 April 2016 | Figure D-4.jpg (file) |  |
408 KB | Alan.Myers | Fig. D-4 -- Development of the classification of the Devonian System in northern Illinois. | 1 |
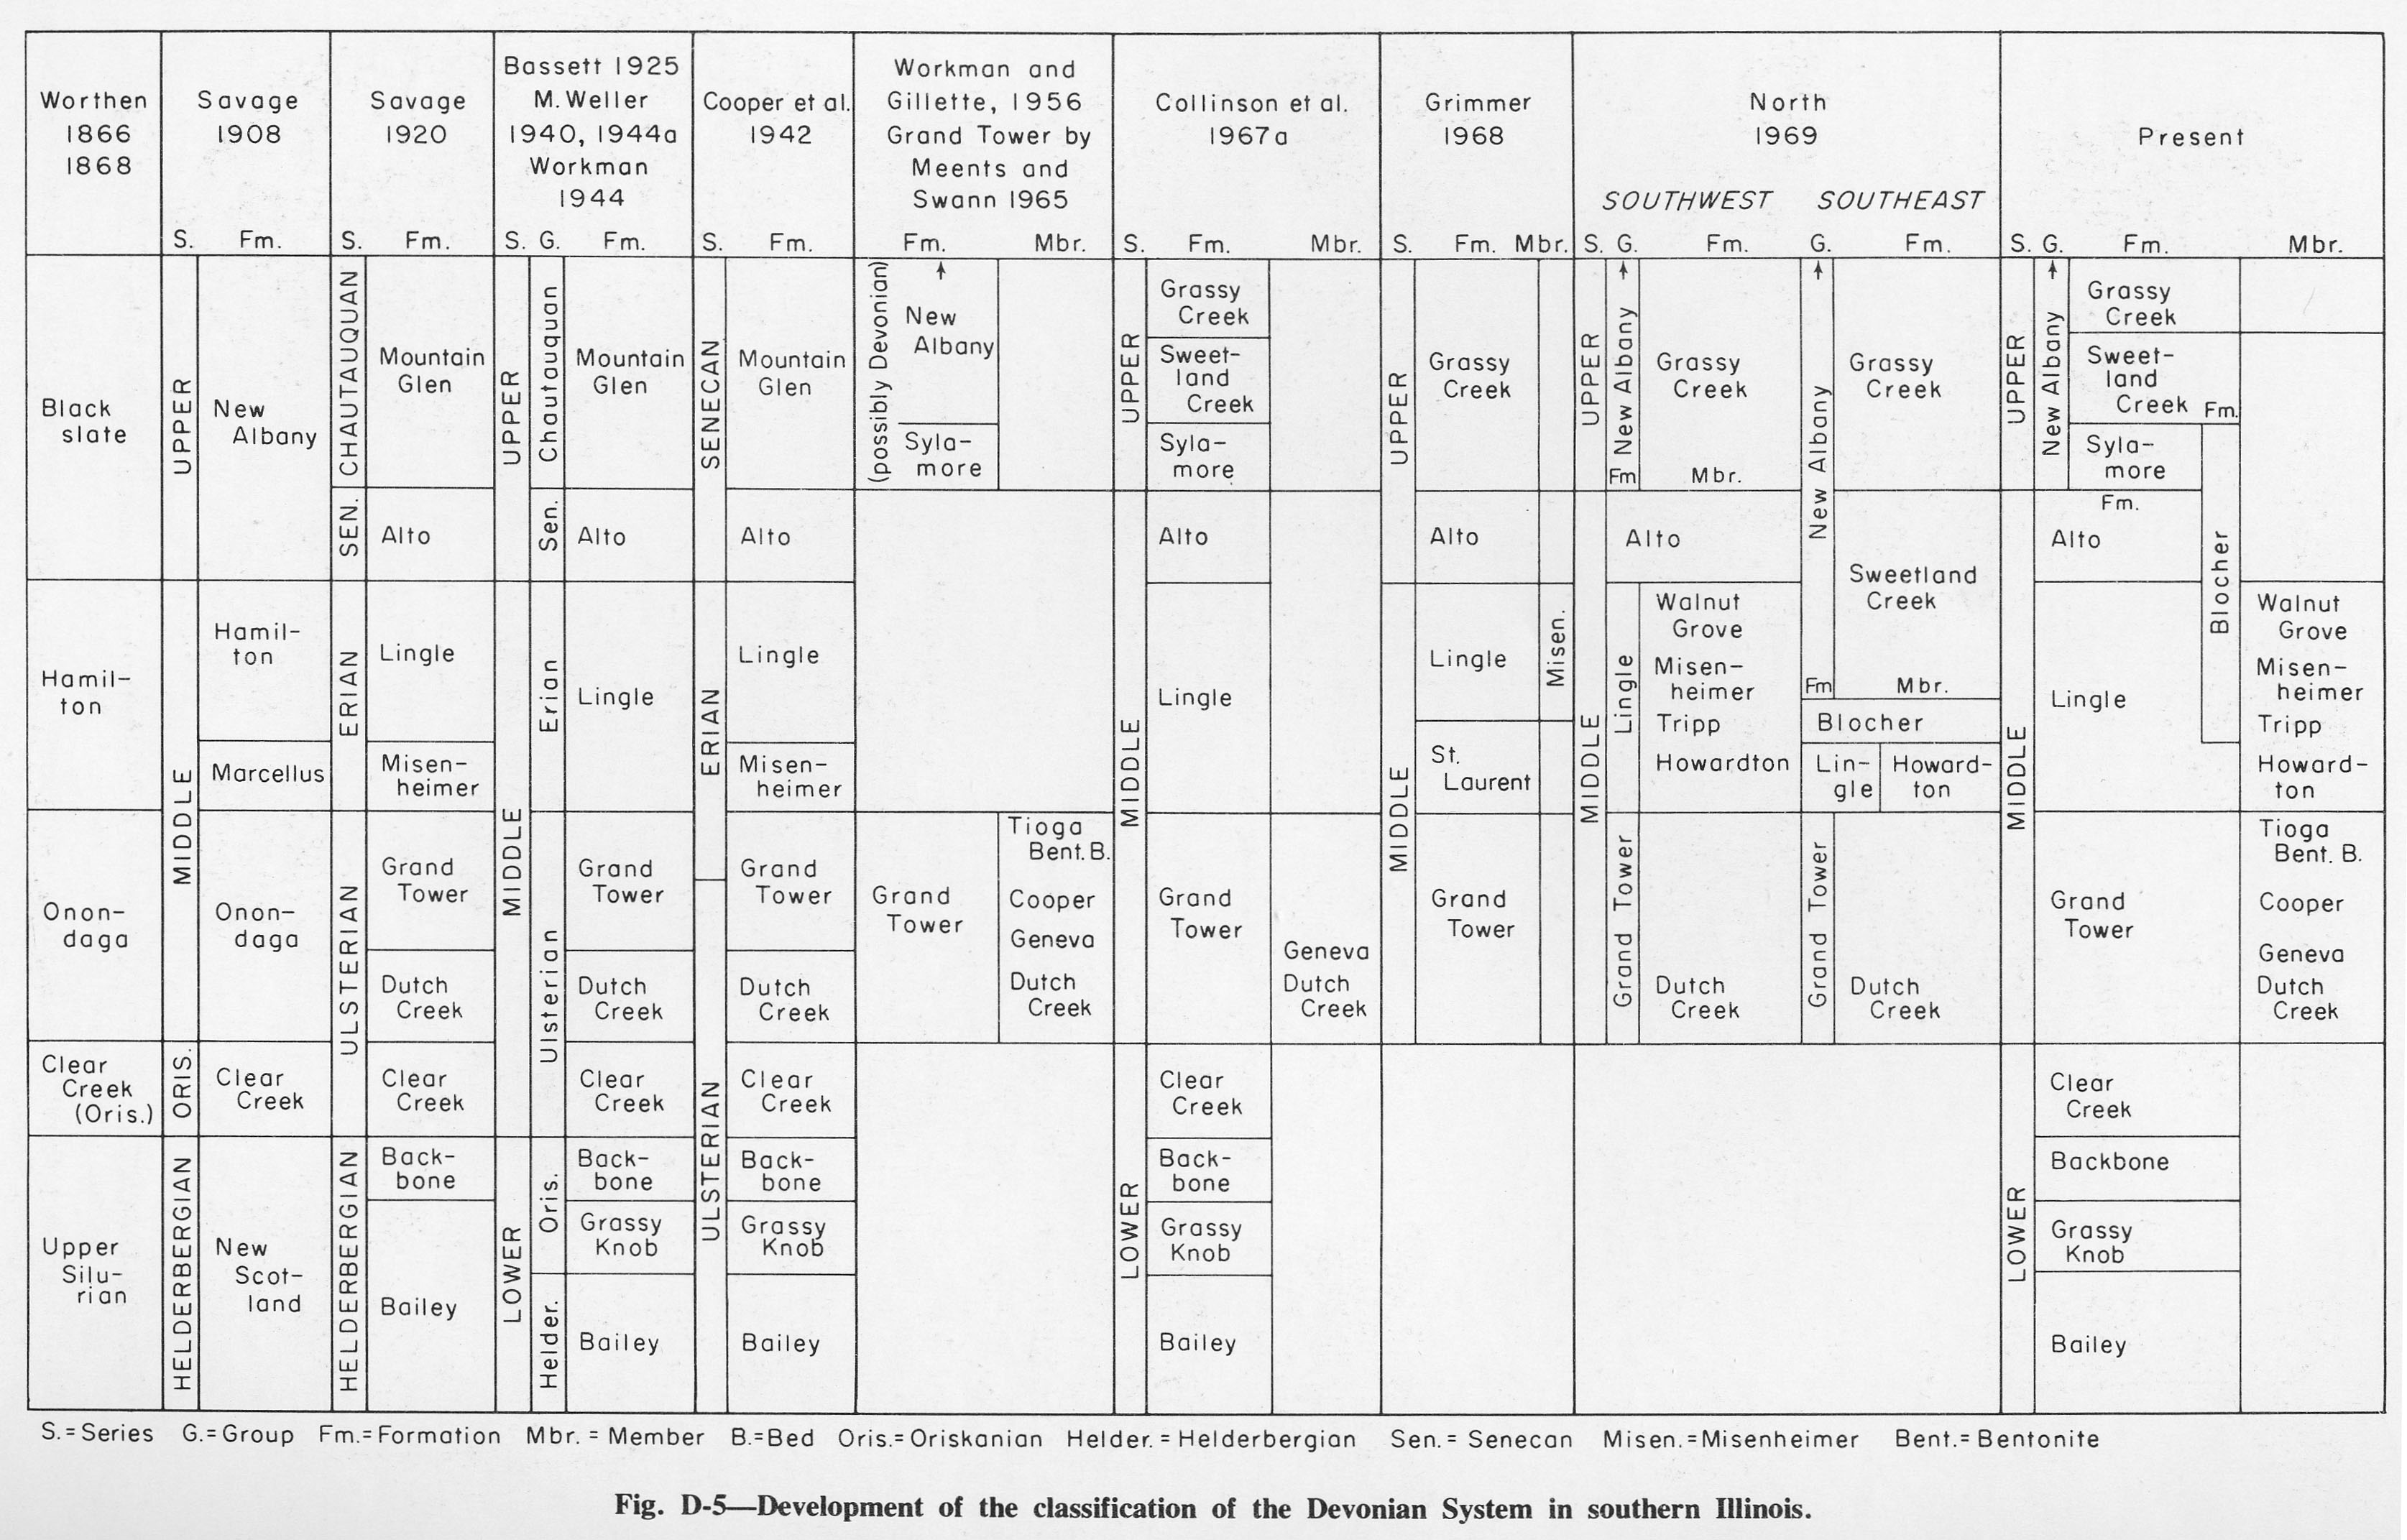
| 19:57, 1 April 2016 | Figure D-5.jpg (file) |  |
779 KB | Alan.Myers | Fig. D-5 -- Development of the classification of the Devonian System in southern Illinois. | 1 |
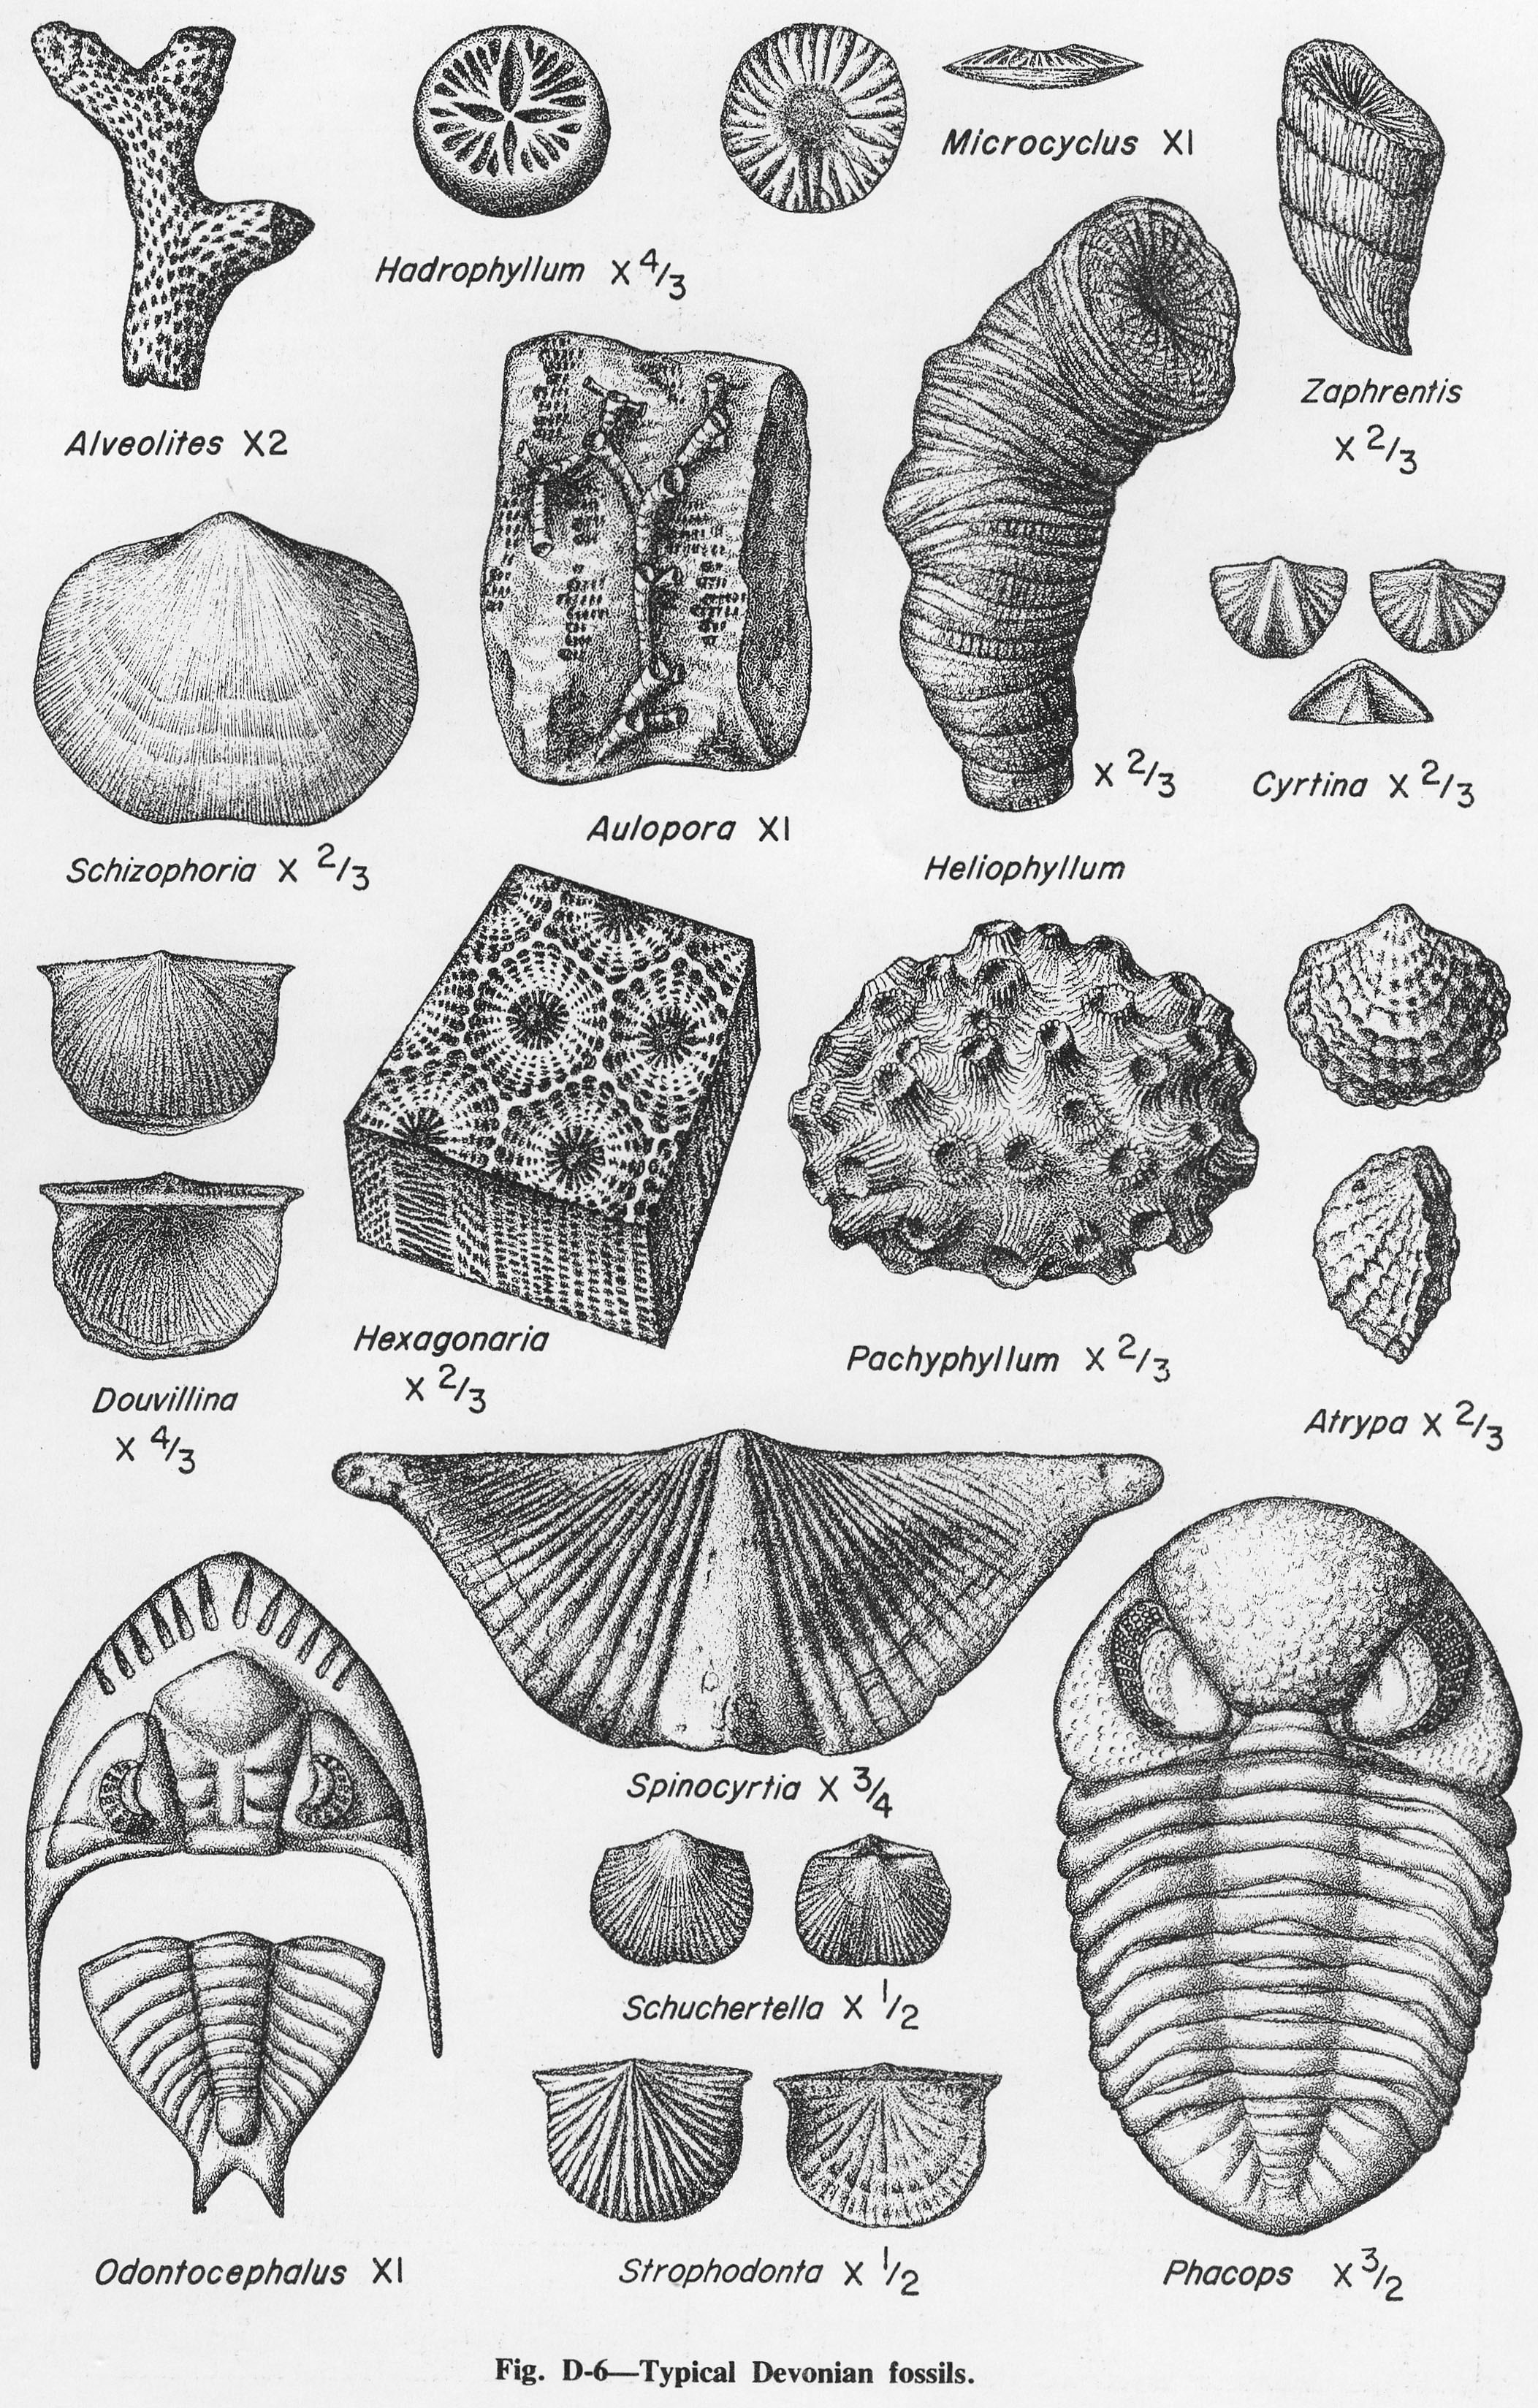
| 19:58, 1 April 2016 | Figure D-6.jpg (file) |  |
1.56 MB | Alan.Myers | Fig. D-6 -- Typical Devonian fossils. | 1 |
| 19:59, 1 April 2016 | Figure D-7.jpg (file) |  |
525 KB | Alan.Myers | Fig. D-7 -- Geologic map of the sub-Kaskaskia surface. | 1 |
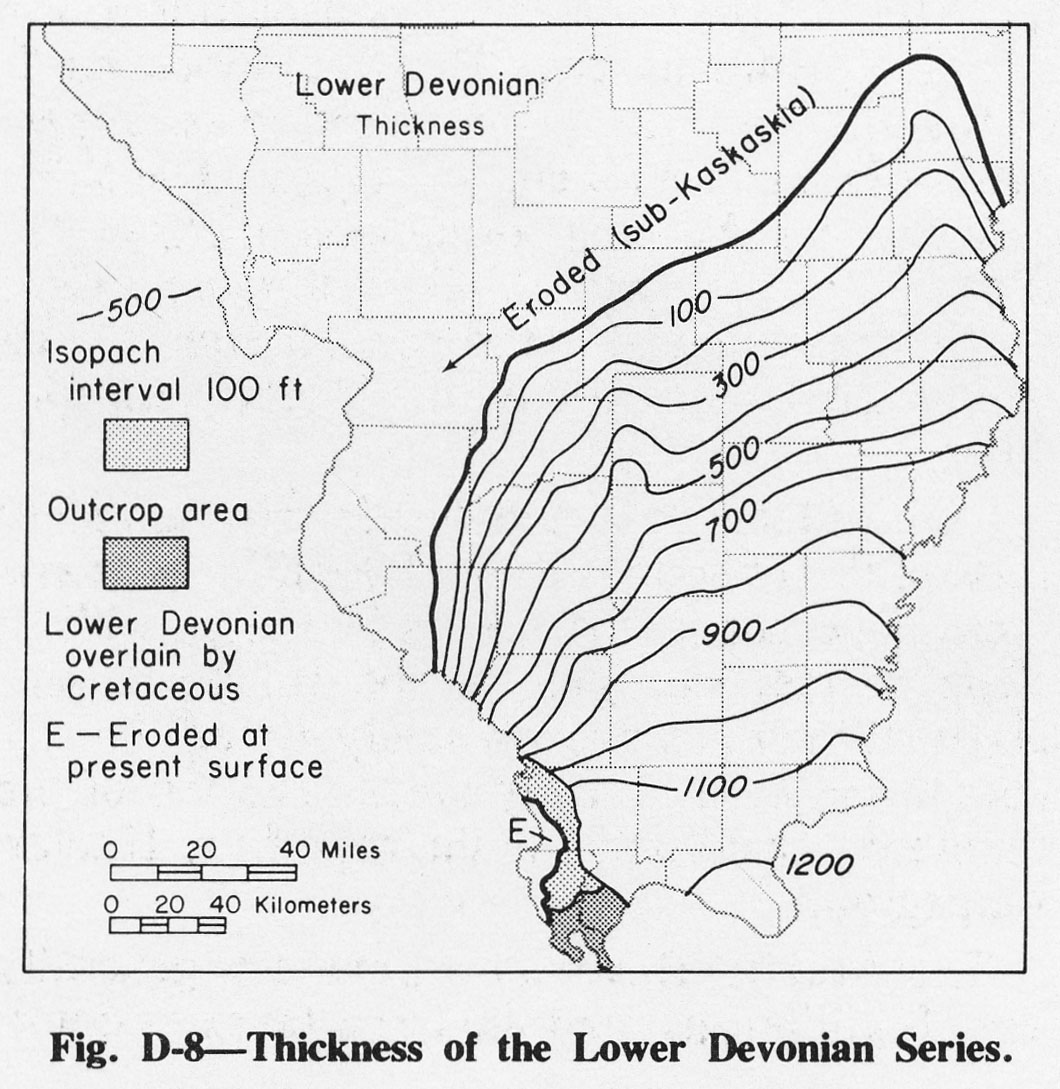
| 20:00, 1 April 2016 | Figure D-8.jpg (file) |  |
245 KB | Alan.Myers | Fig. D-8 -- Thickness of the Lower Devonian Series. | 1 |
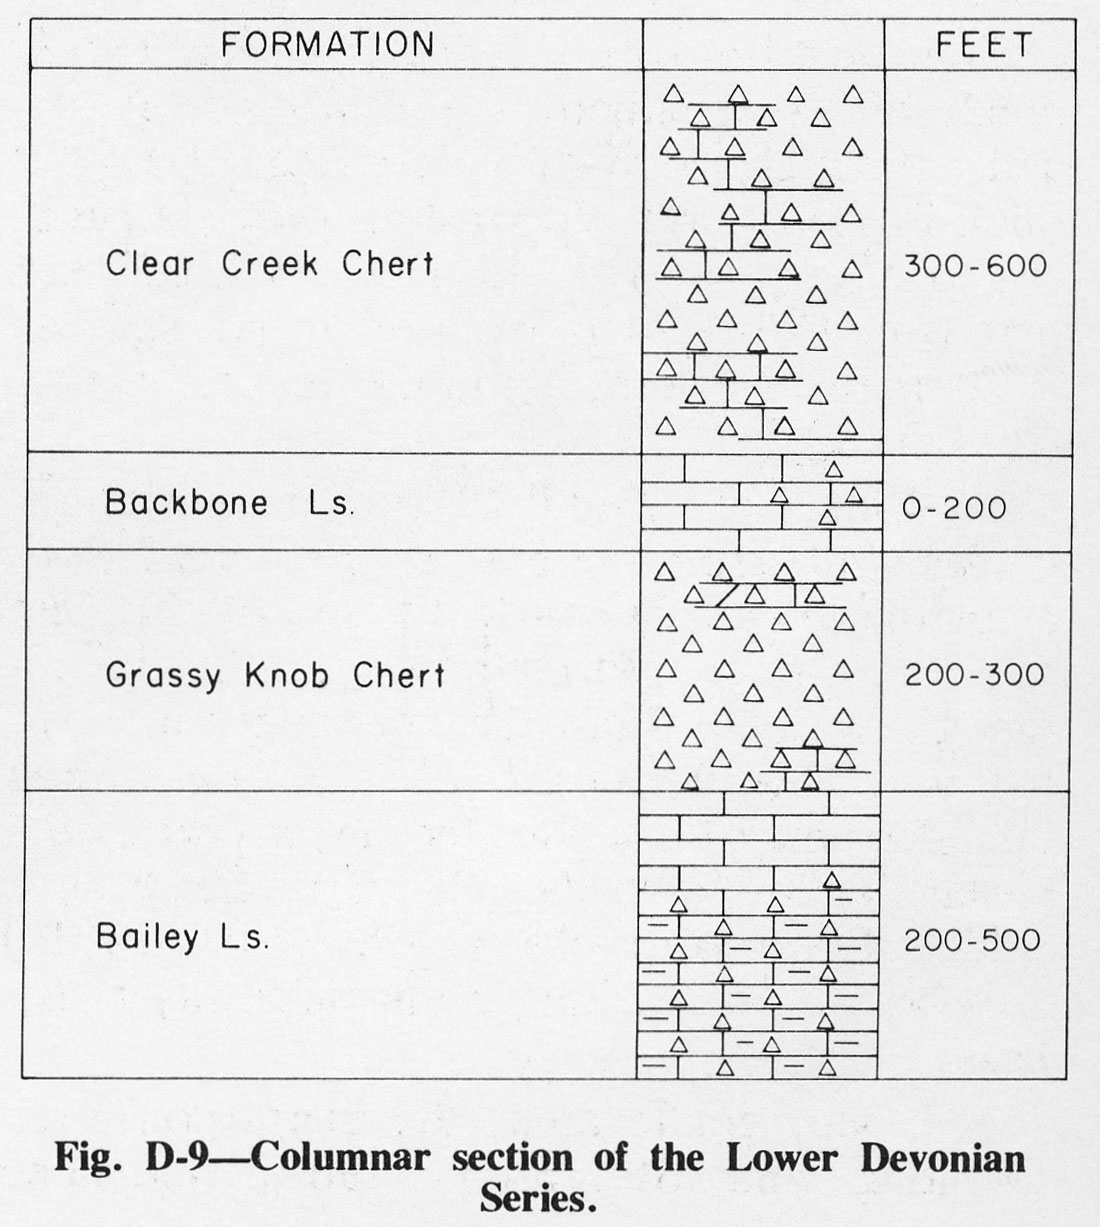
| 20:03, 1 April 2016 | Figure D-9.jpg (file) |  |
211 KB | Alan.Myers | Fig. D-9 -- Columnar section of the Lower Devonian Series. | 1 |
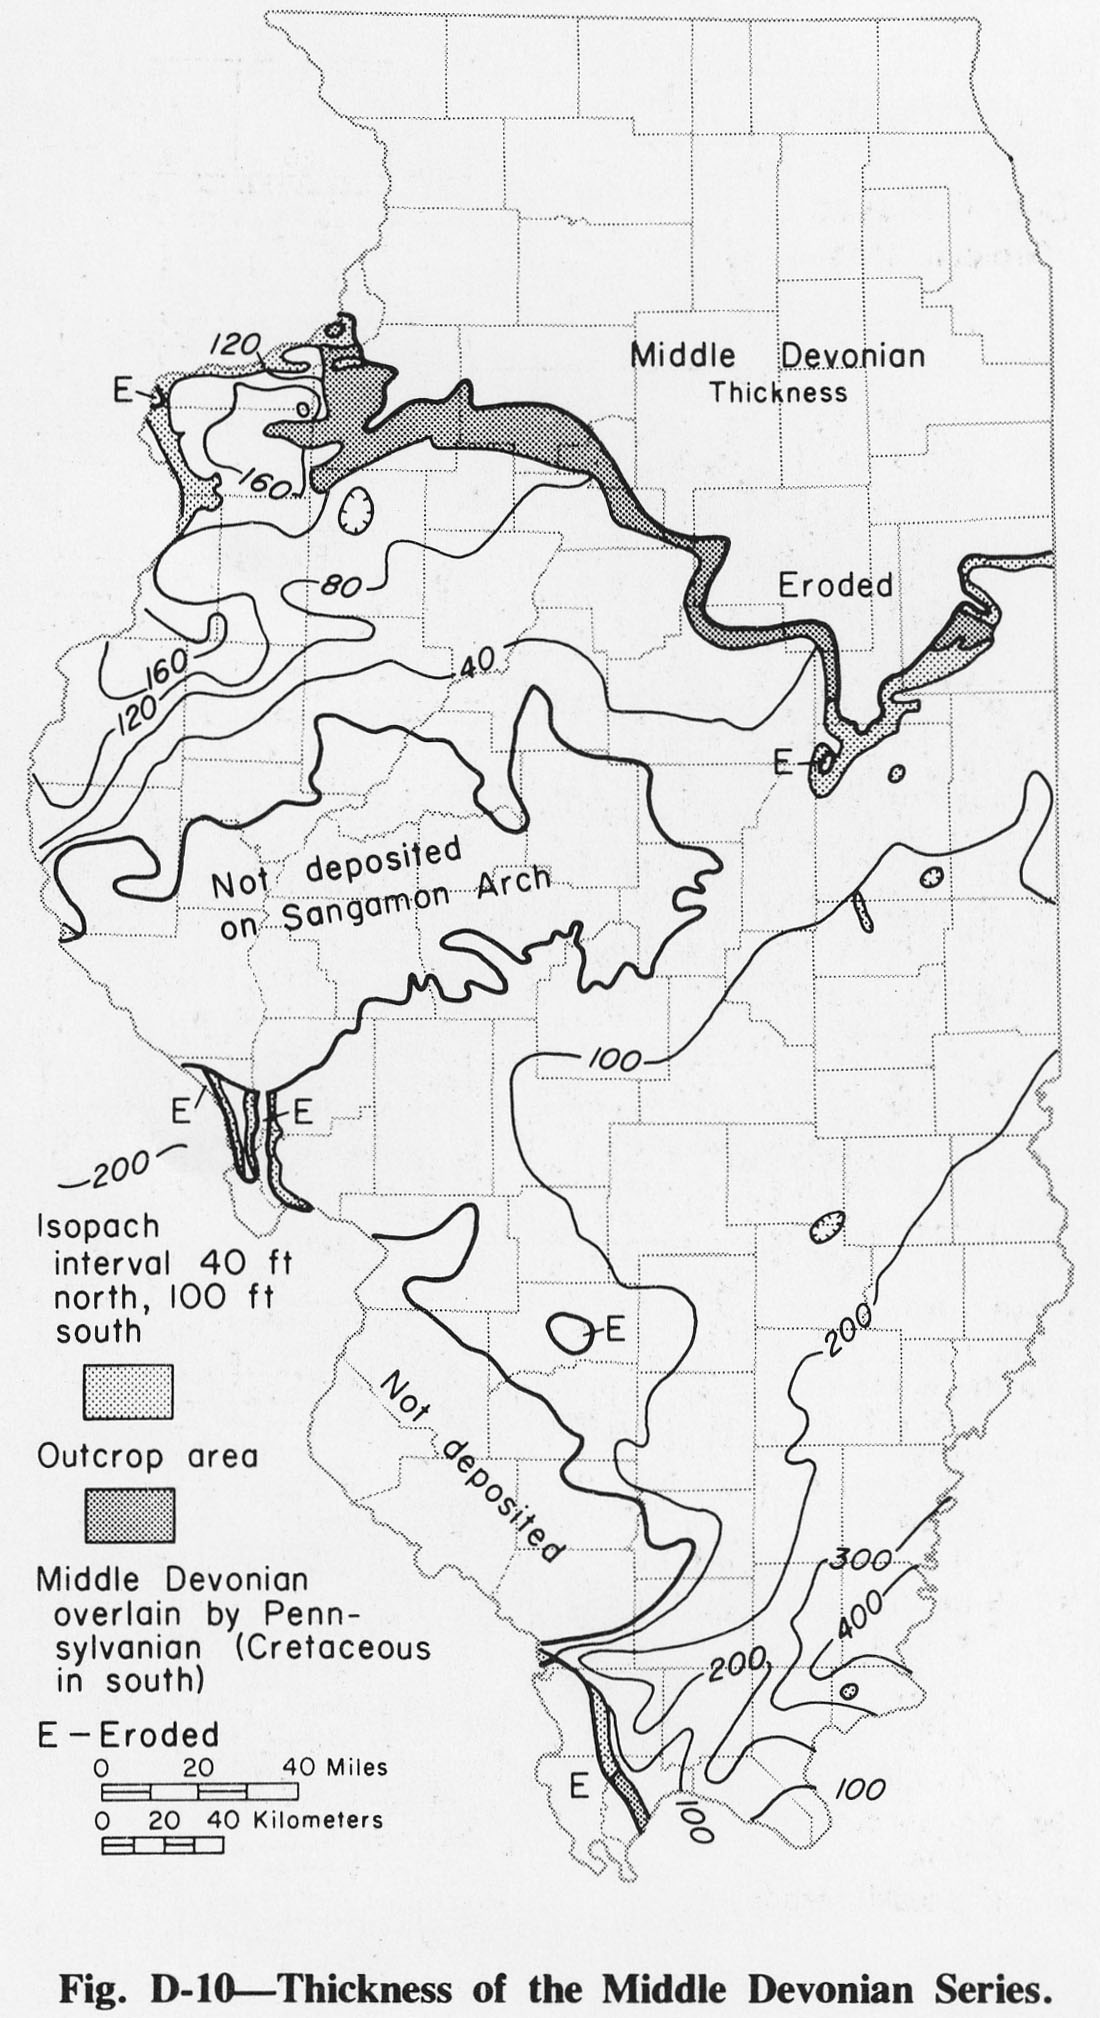
| 20:04, 1 April 2016 | Figure D-10.jpg (file) |  |
318 KB | Alan.Myers | Fig. D-10 -- Thickness of the Middle Devonian Series. | 1 |
| 20:05, 1 April 2016 | Figure D-11.jpg (file) |  |
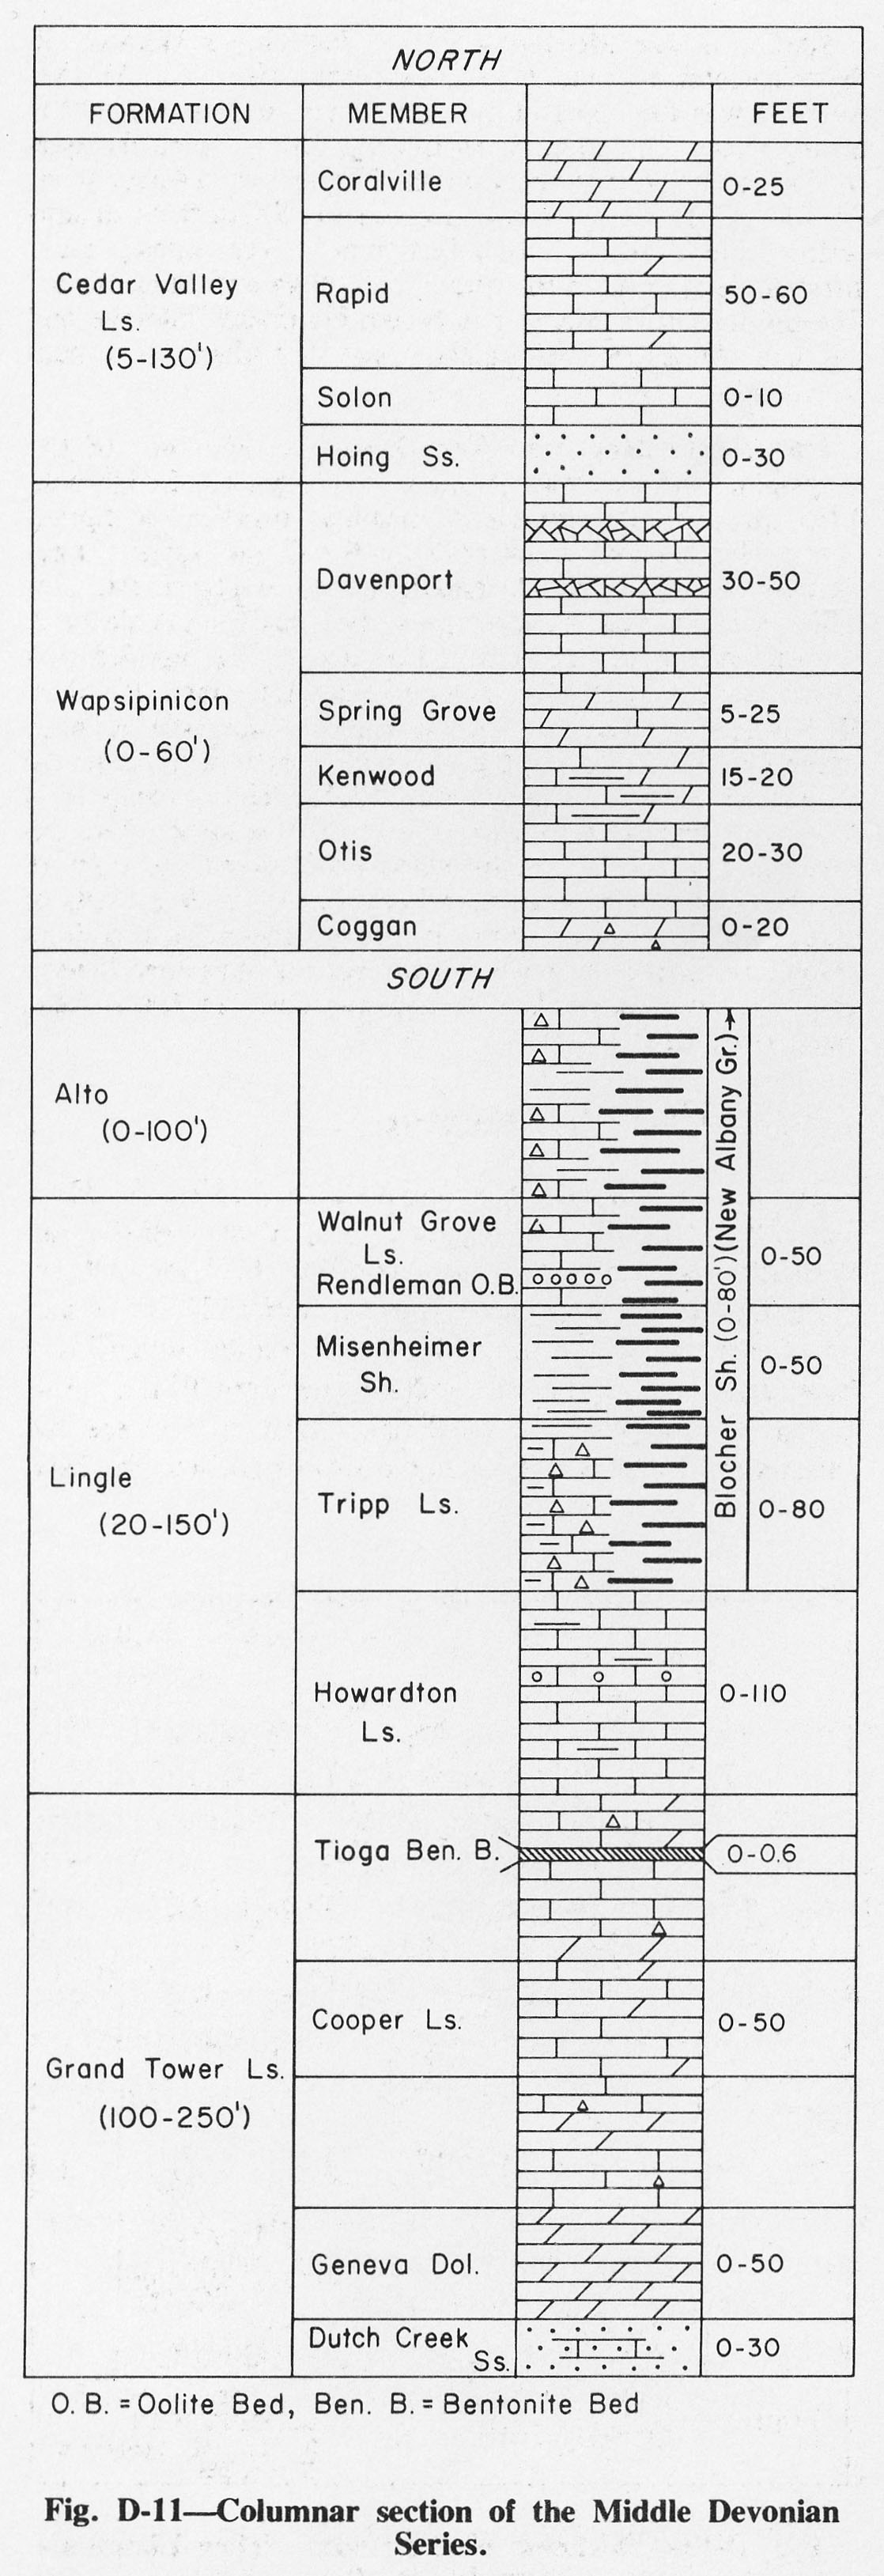
428 KB | Alan.Myers | Fig. D-11 -- Columnar section of the Middle Devonian Series. | 1 |
| 20:07, 1 April 2016 | Figure D-12.jpg (file) |  |
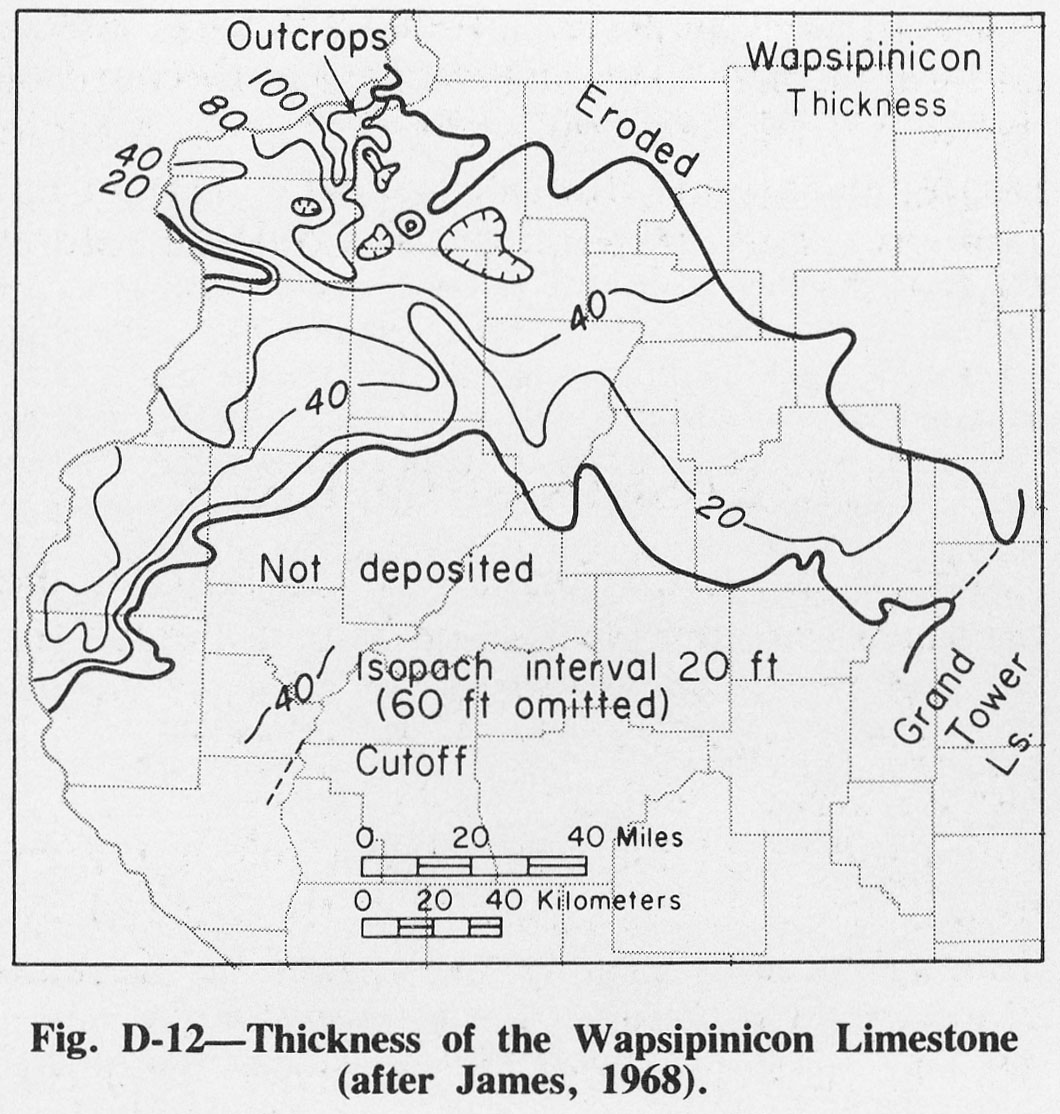
249 KB | Alan.Myers | Fig. D-12 -- Thickness of the Wapsipinicon Limestone (after James, 1968). | 1 |
| 20:08, 1 April 2016 | Figure D-13.jpg (file) |  |
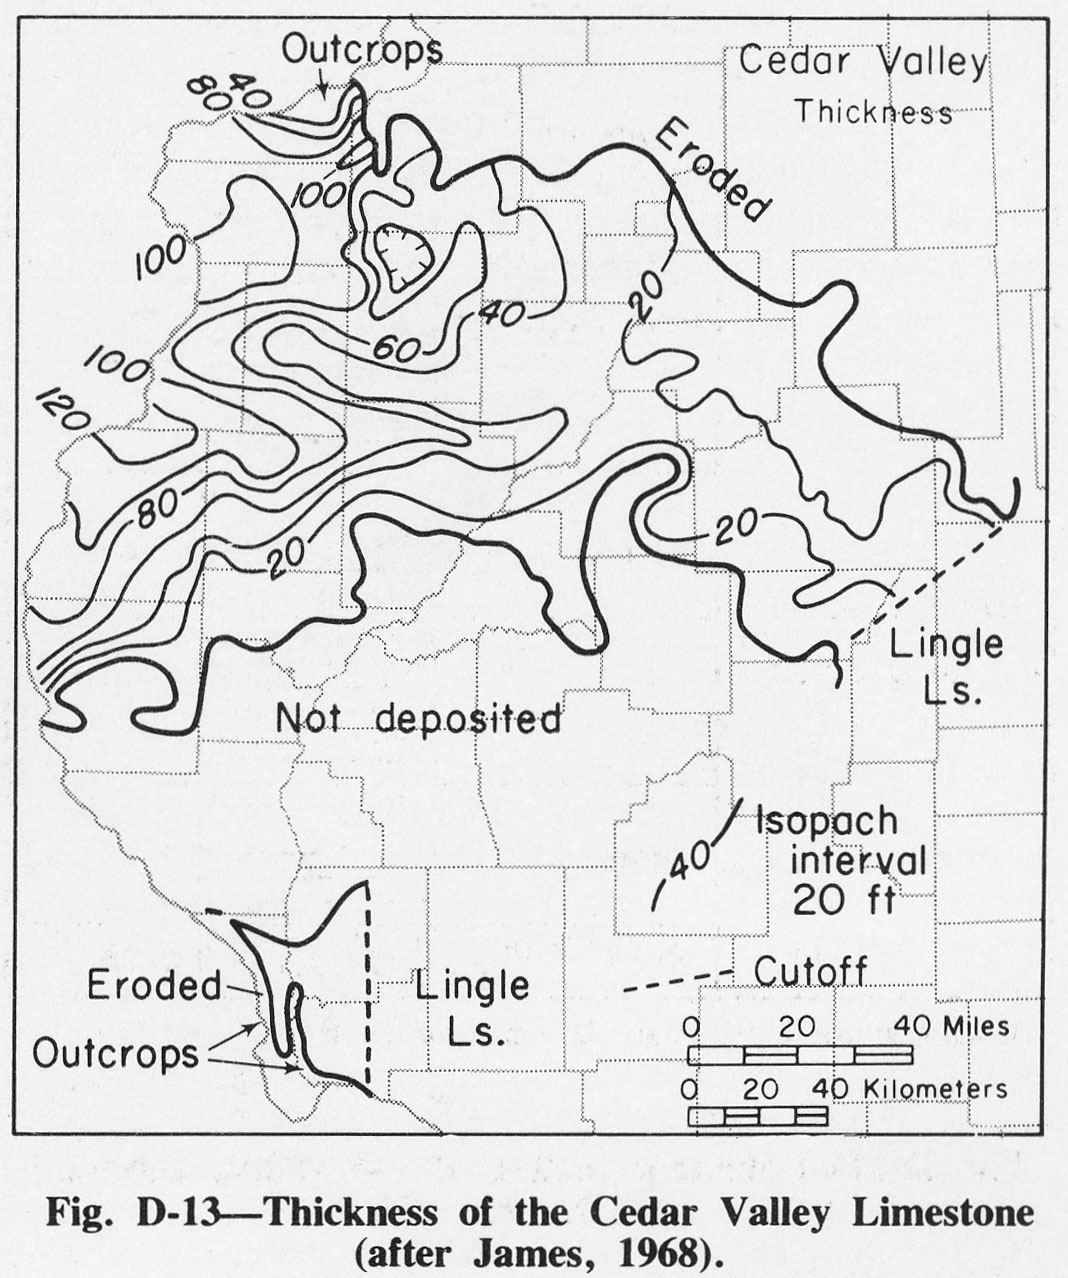
291 KB | Alan.Myers | Fig. D-13 -- Thickness of the Cedar Valley Limestone (after James, 1968). | 1 |
| 20:09, 1 April 2016 | Figure D-14.jpg (file) |  |
232 KB | Alan.Myers | Fig. D-14 -- Thickness of the Grand Tower Limestone (after North, 1969). | 1 |
| 20:10, 1 April 2016 | Figure D-15.jpg (file) |  |
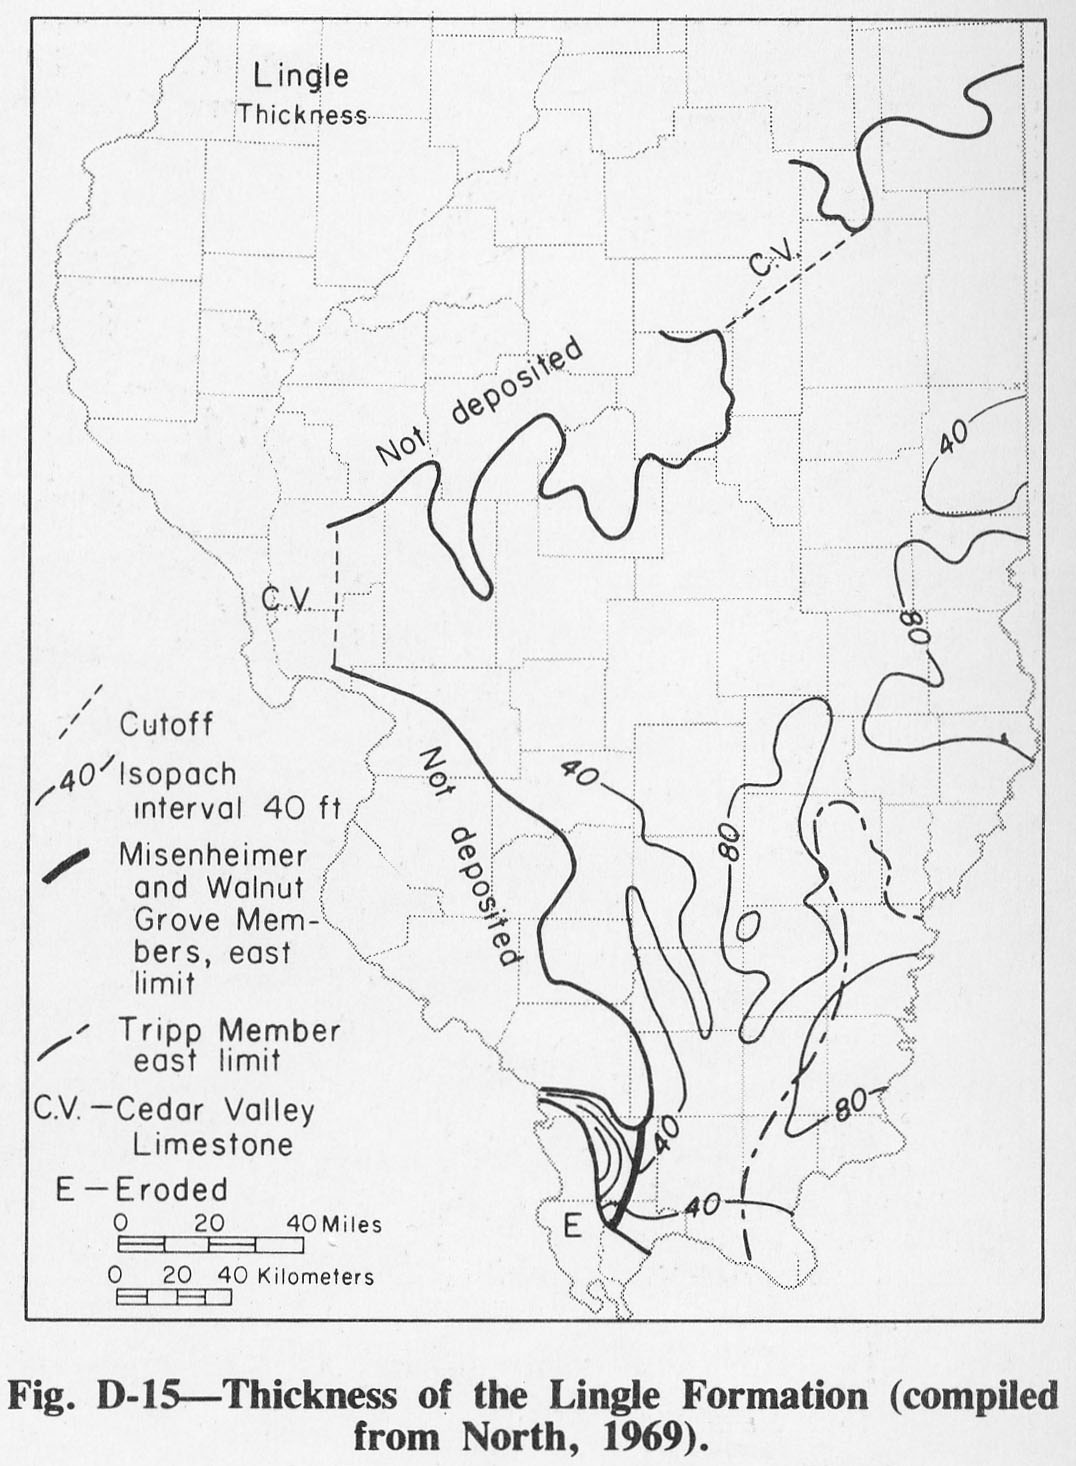
211 KB | Alan.Myers | Fig. D-15 -- Thickness of the Lingle Formation (compliled from North, 1969). | 1 |
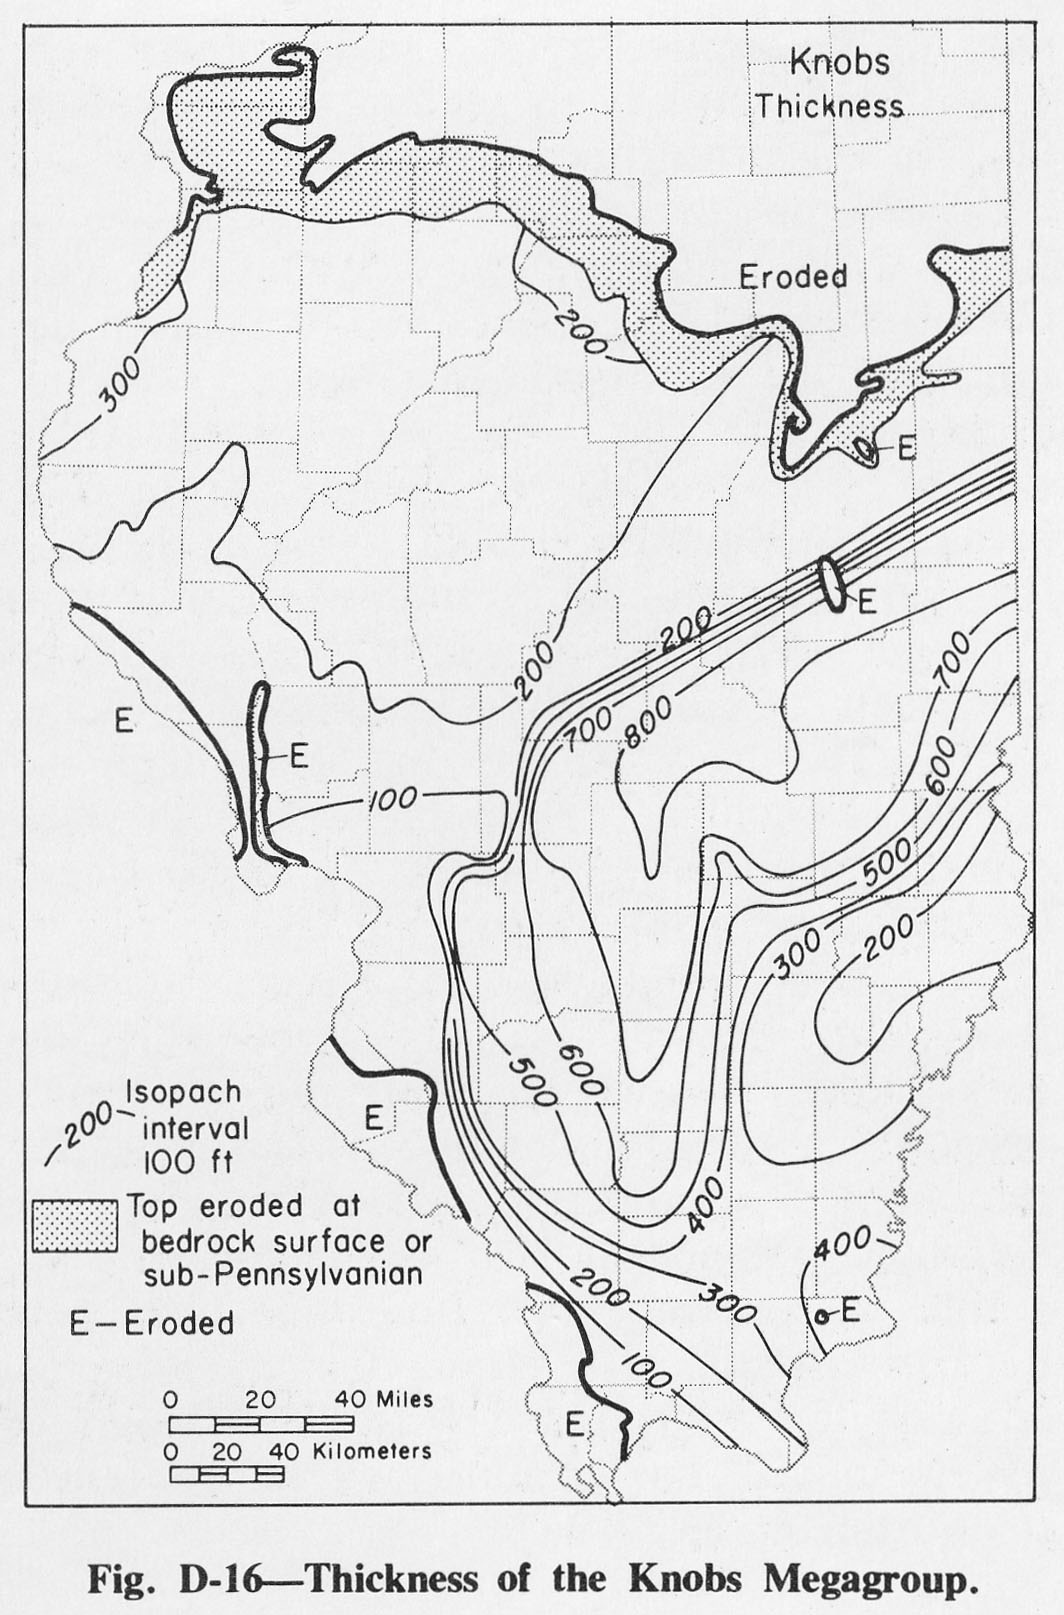
| 20:12, 1 April 2016 | Figure D-16.jpg (file) |  |
273 KB | Alan.Myers | Fig. D-16 -- Thickness of the Knobs Megagroup. | 1 |
| 20:13, 1 April 2016 | Figure D-17.jpg (file) |  |
252 KB | Alan.Myers | Fig. D-17 -- Thickness of the Blocher Shale (after North, 1969). | 1 |
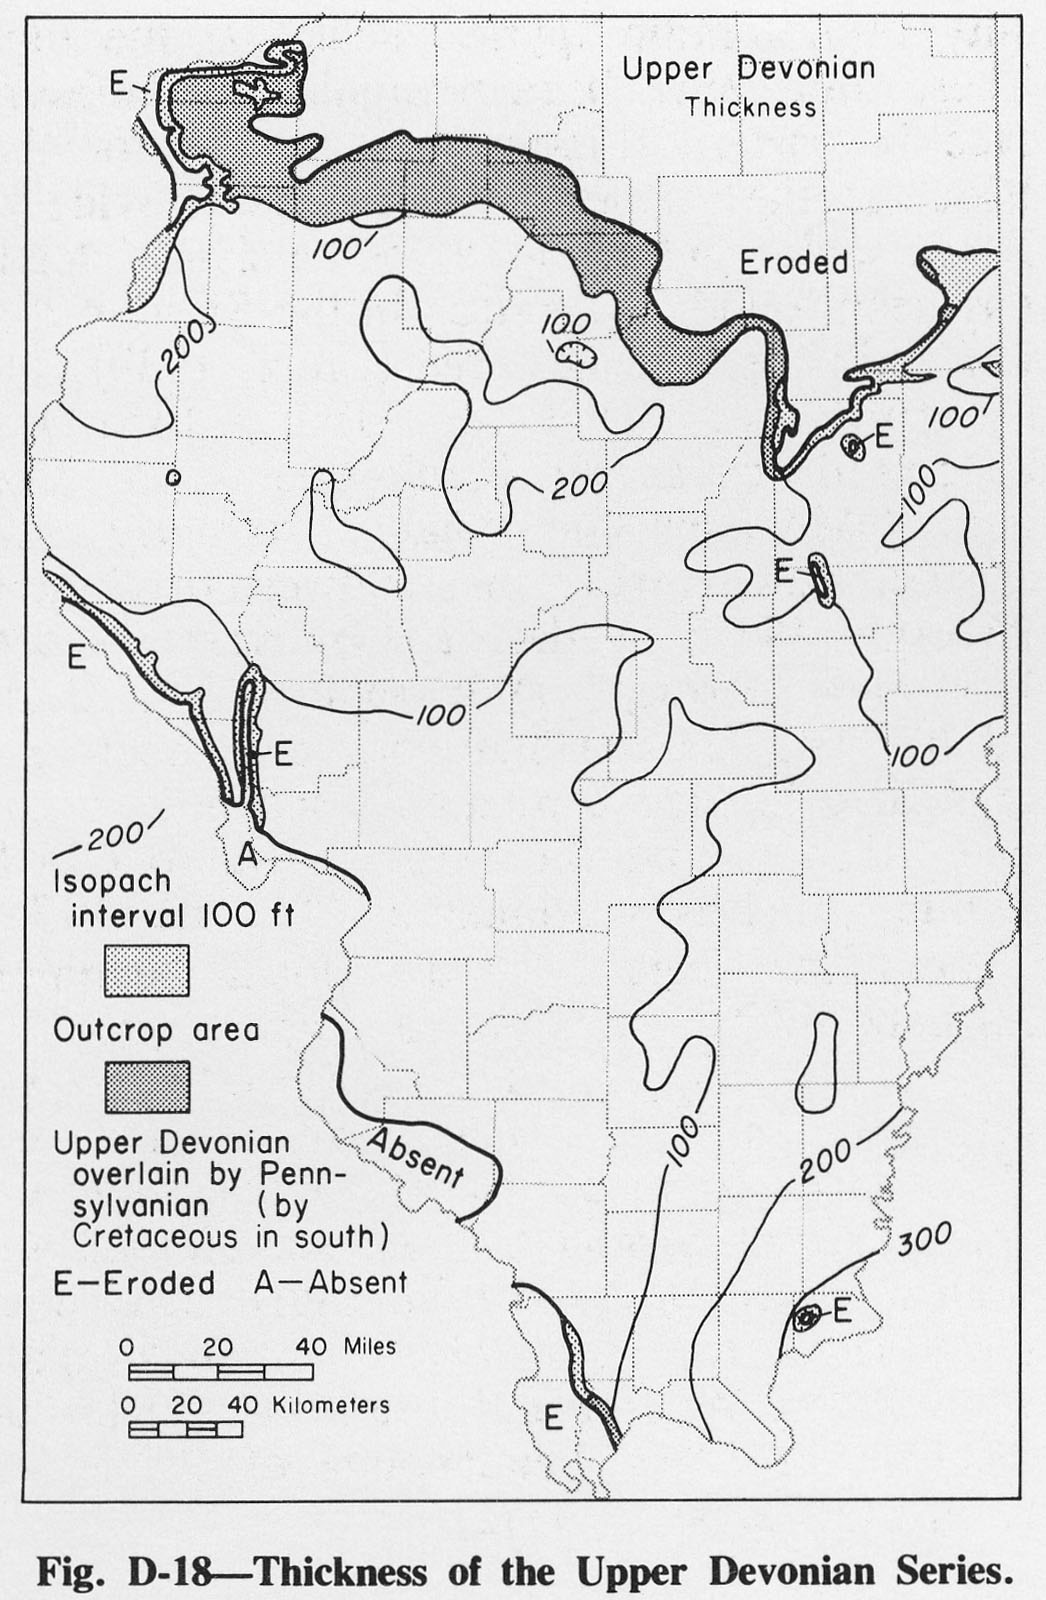
| 20:15, 1 April 2016 | Figure D-18.jpg (file) |  |
283 KB | Alan.Myers | 1 | |
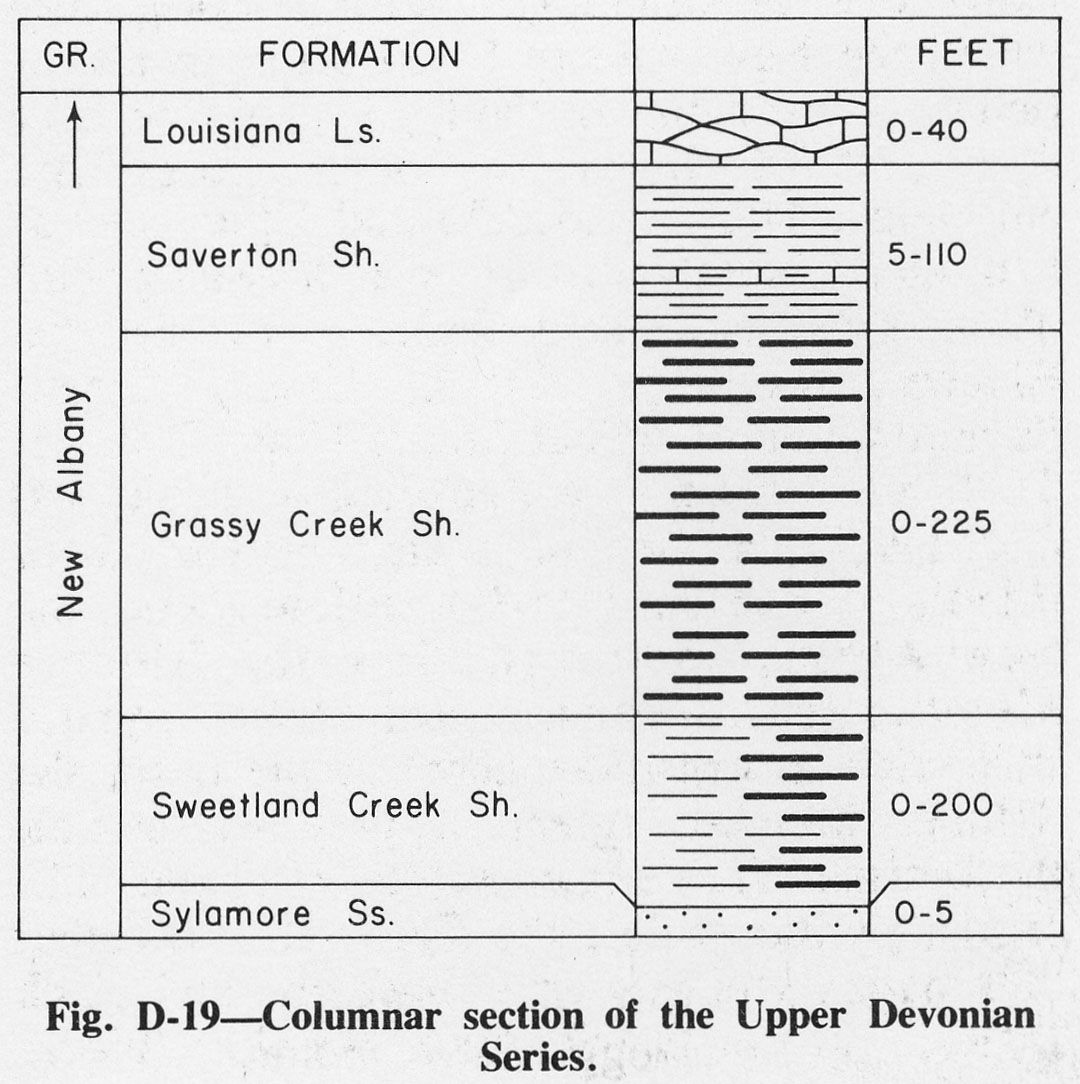
| 20:17, 1 April 2016 | Figure D-19.jpg (file) |  |
194 KB | Alan.Myers | Fig. D-19 -- Columnar section of the Upper Devonian Series. | 1 |
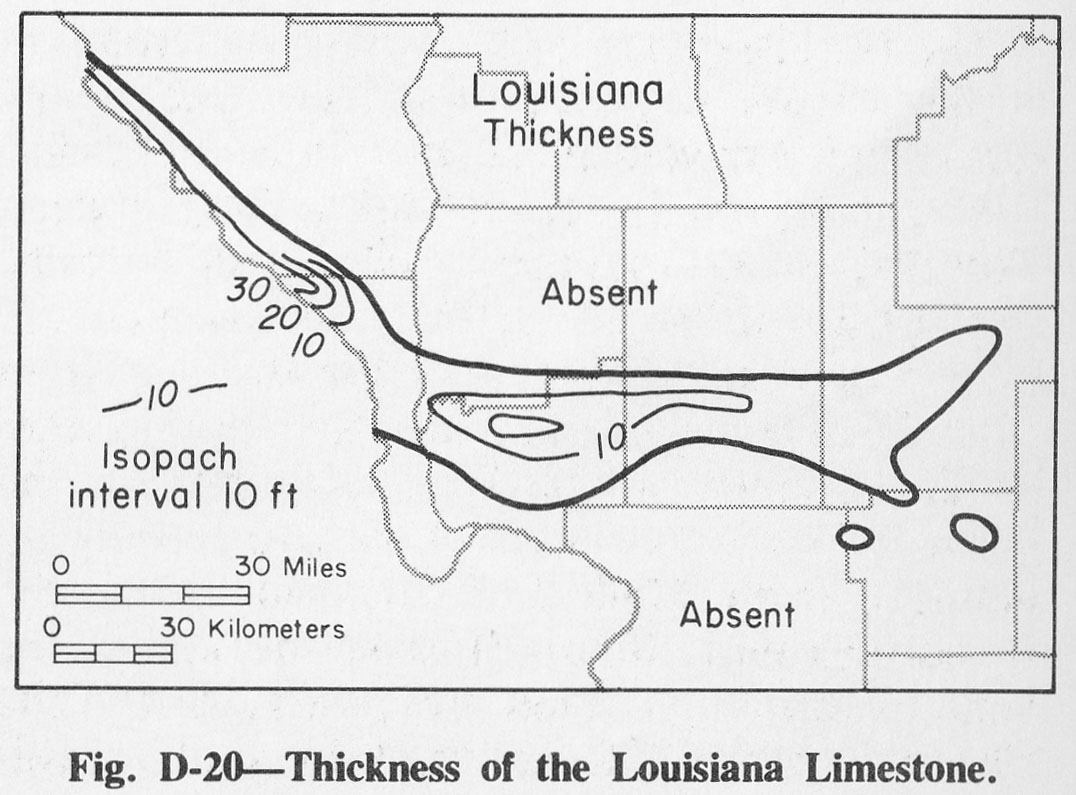
| 20:17, 1 April 2016 | Figure D-20.jpg (file) |  |
152 KB | Alan.Myers | Fig. D-20 -- Thickness of the Louisiana Limestone. | 1 |
| 20:19, 1 April 2016 | Figure K-3.jpg (file) |  |
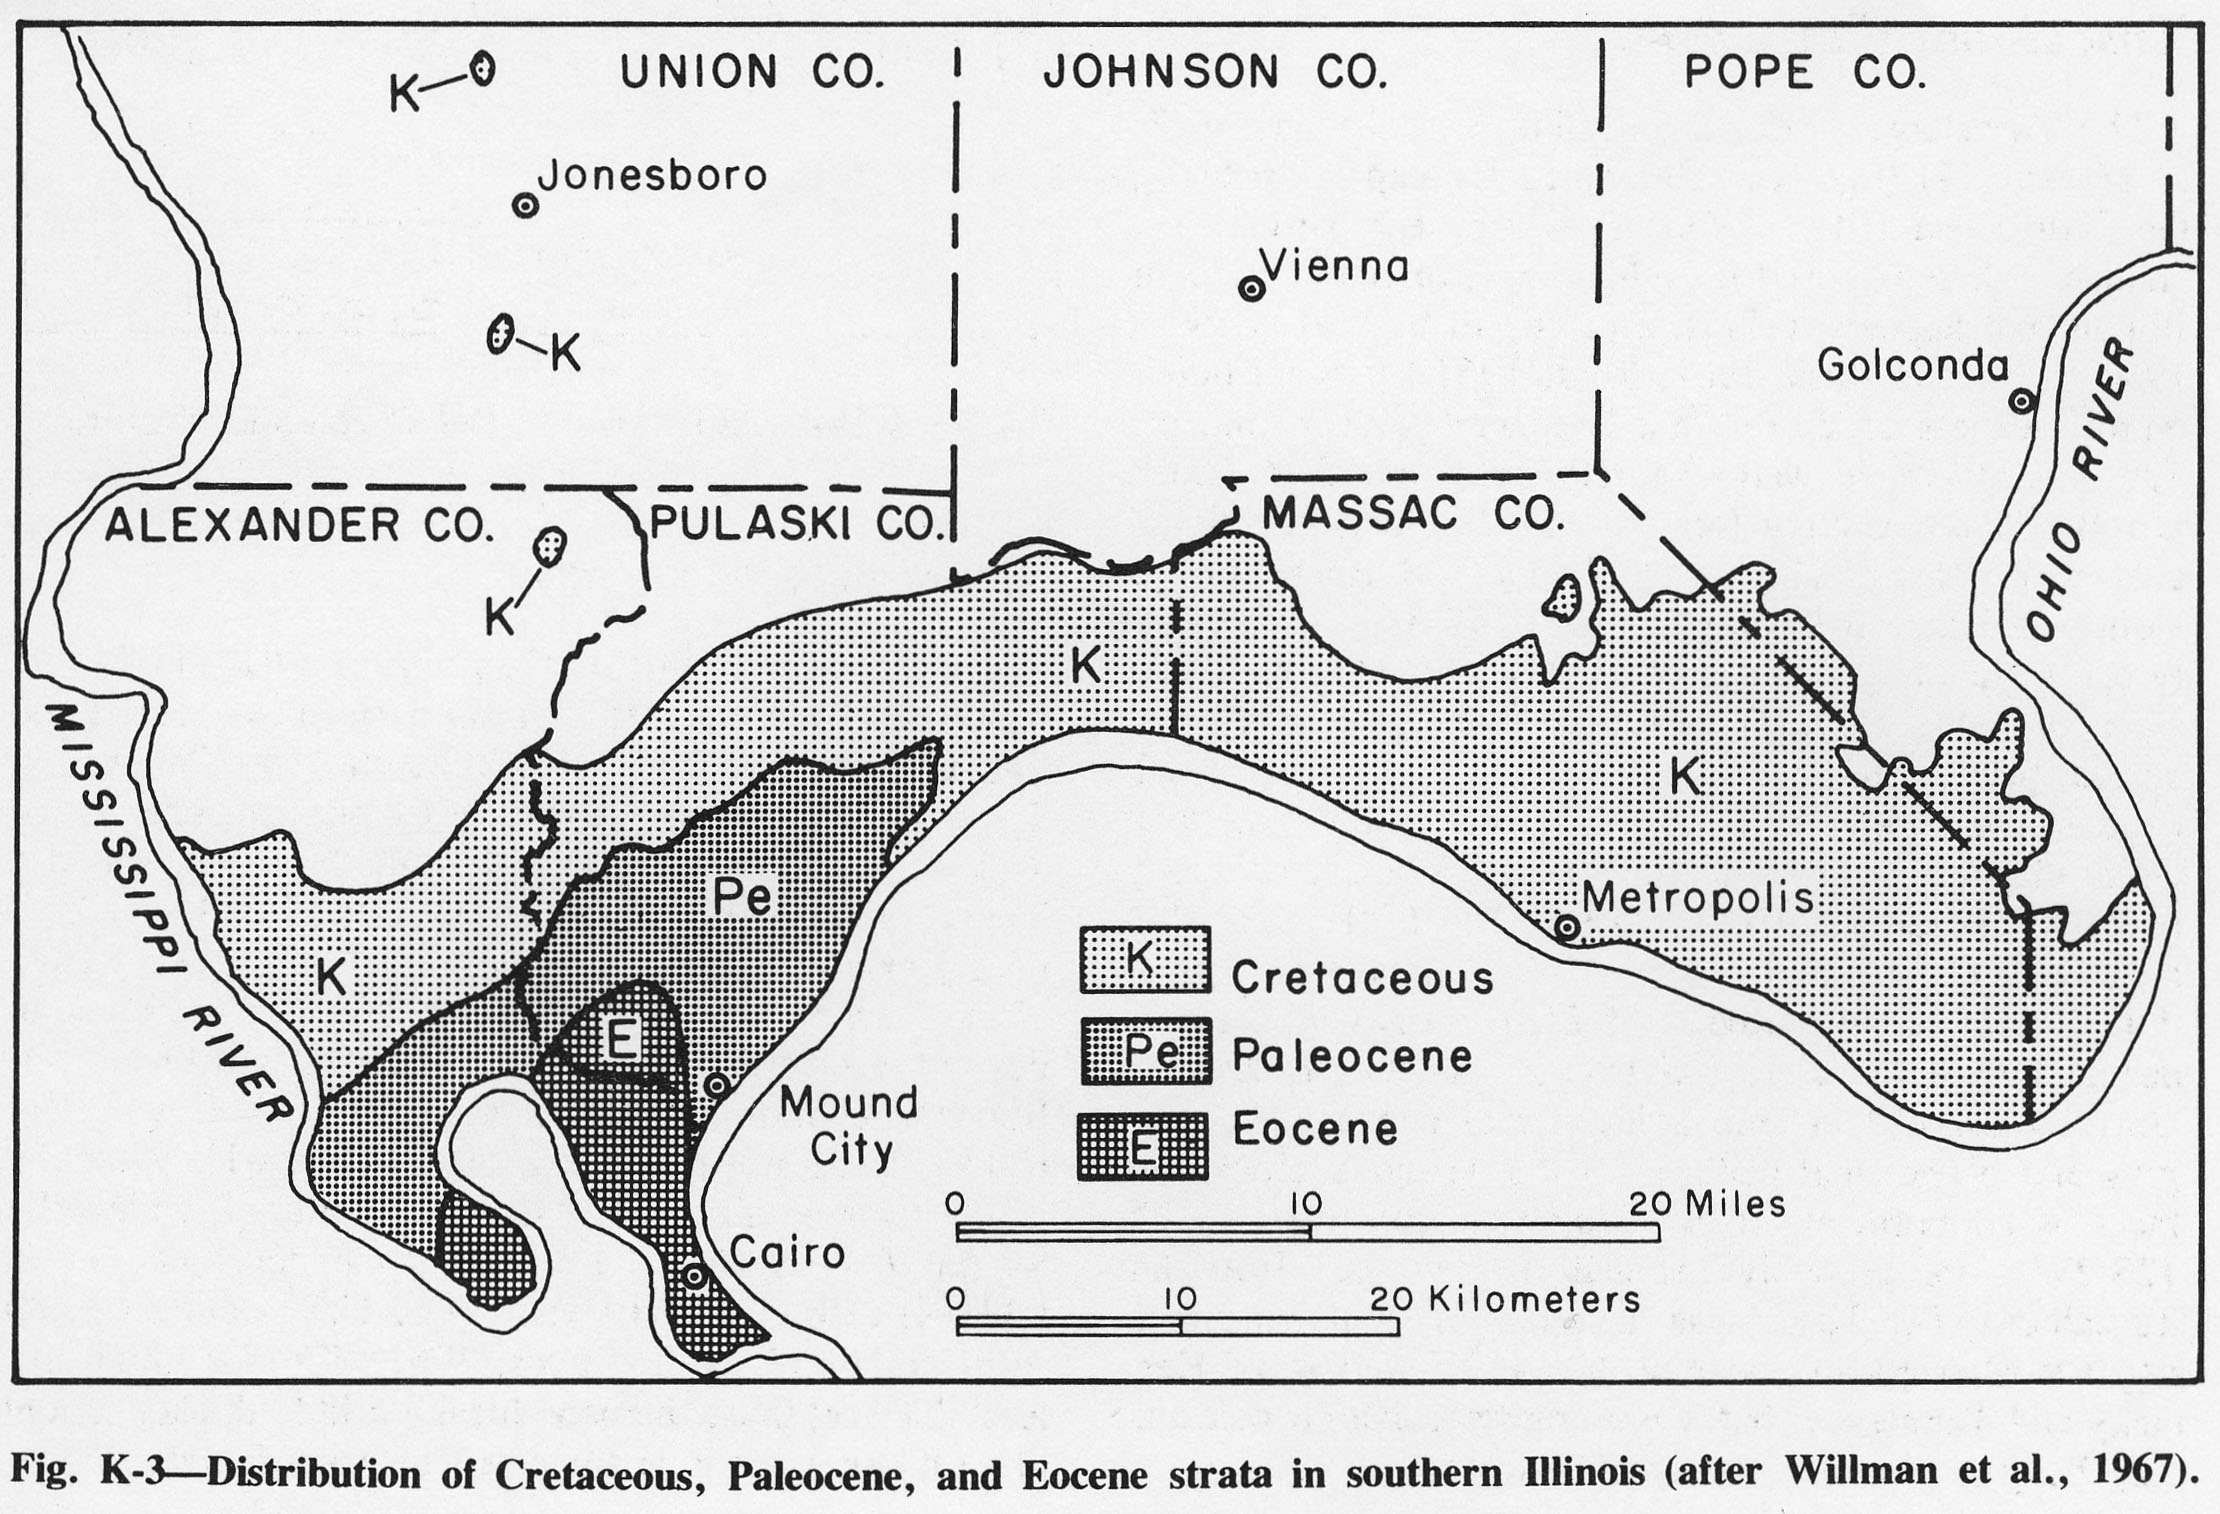
557 KB | Alan.Myers | Fig. K-3 -- Distribution of Cretaceous, Paleocene, and Eocene strata in southern Illinois (after Willman et al., 1967). | 1 |
| 20:20, 1 April 2016 | Figure K-4.jpg (file) |  |
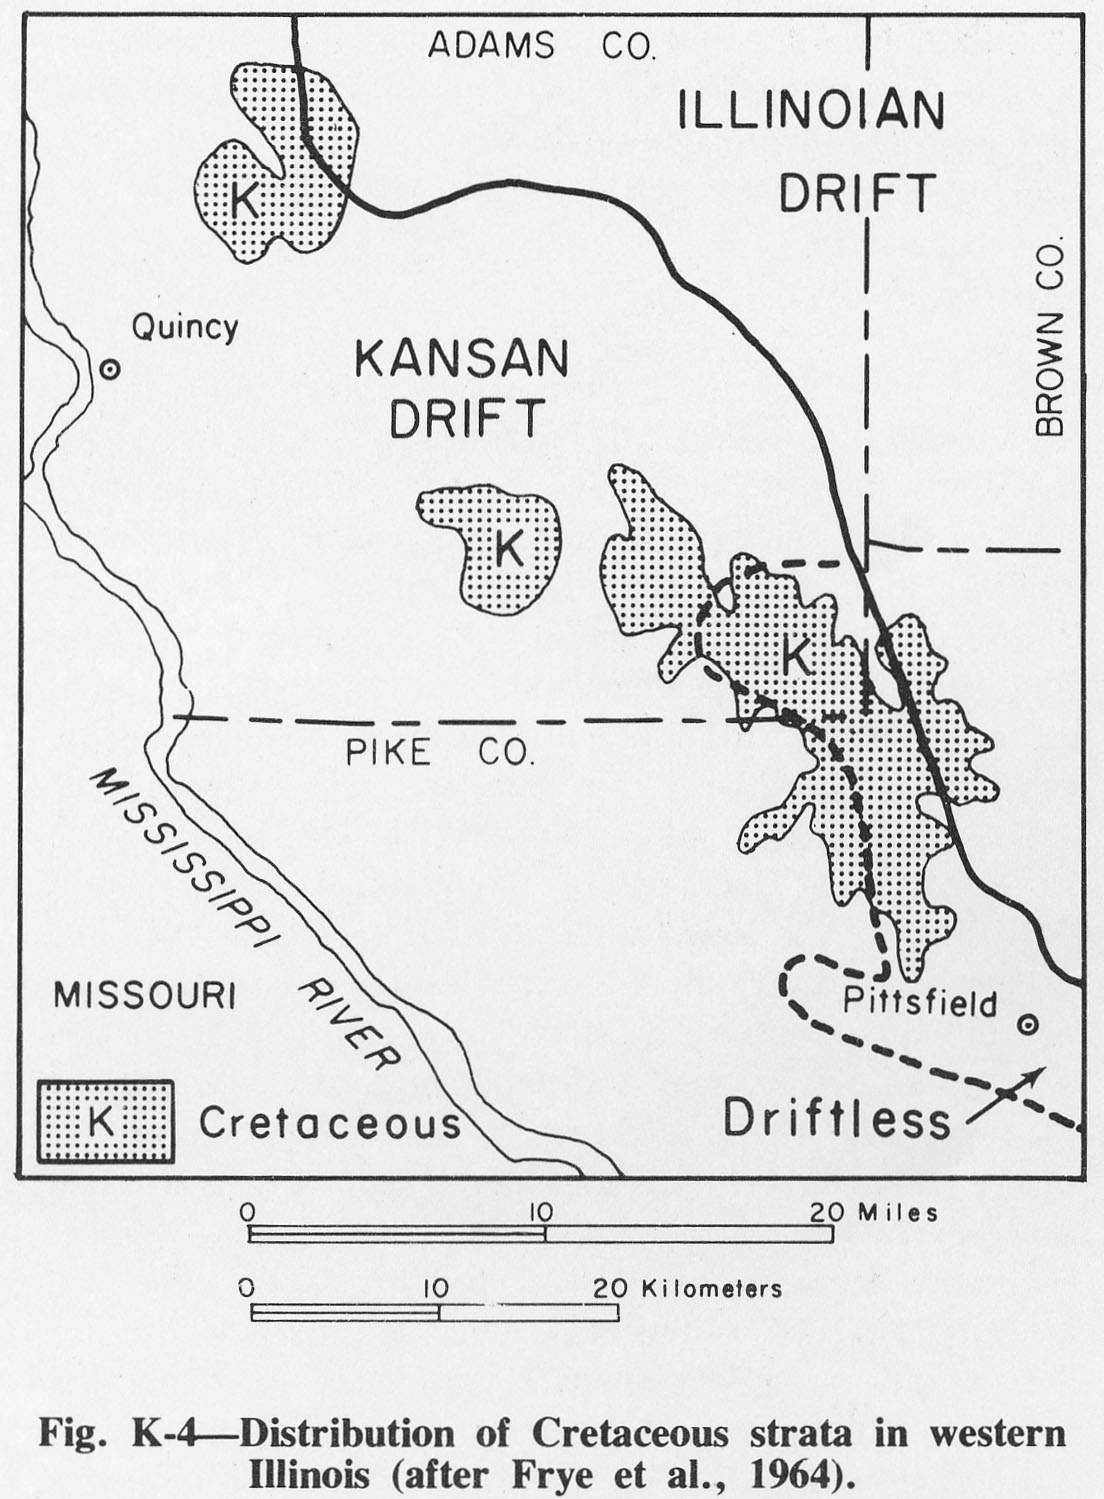
216 KB | Alan.Myers | Fig. K-4 -- Distribution of Cretaceous strata in western Illinois (after Frye et al., 1964). | 1 |
| 13:04, 4 April 2016 | Figure M-2.jpg (file) |  |
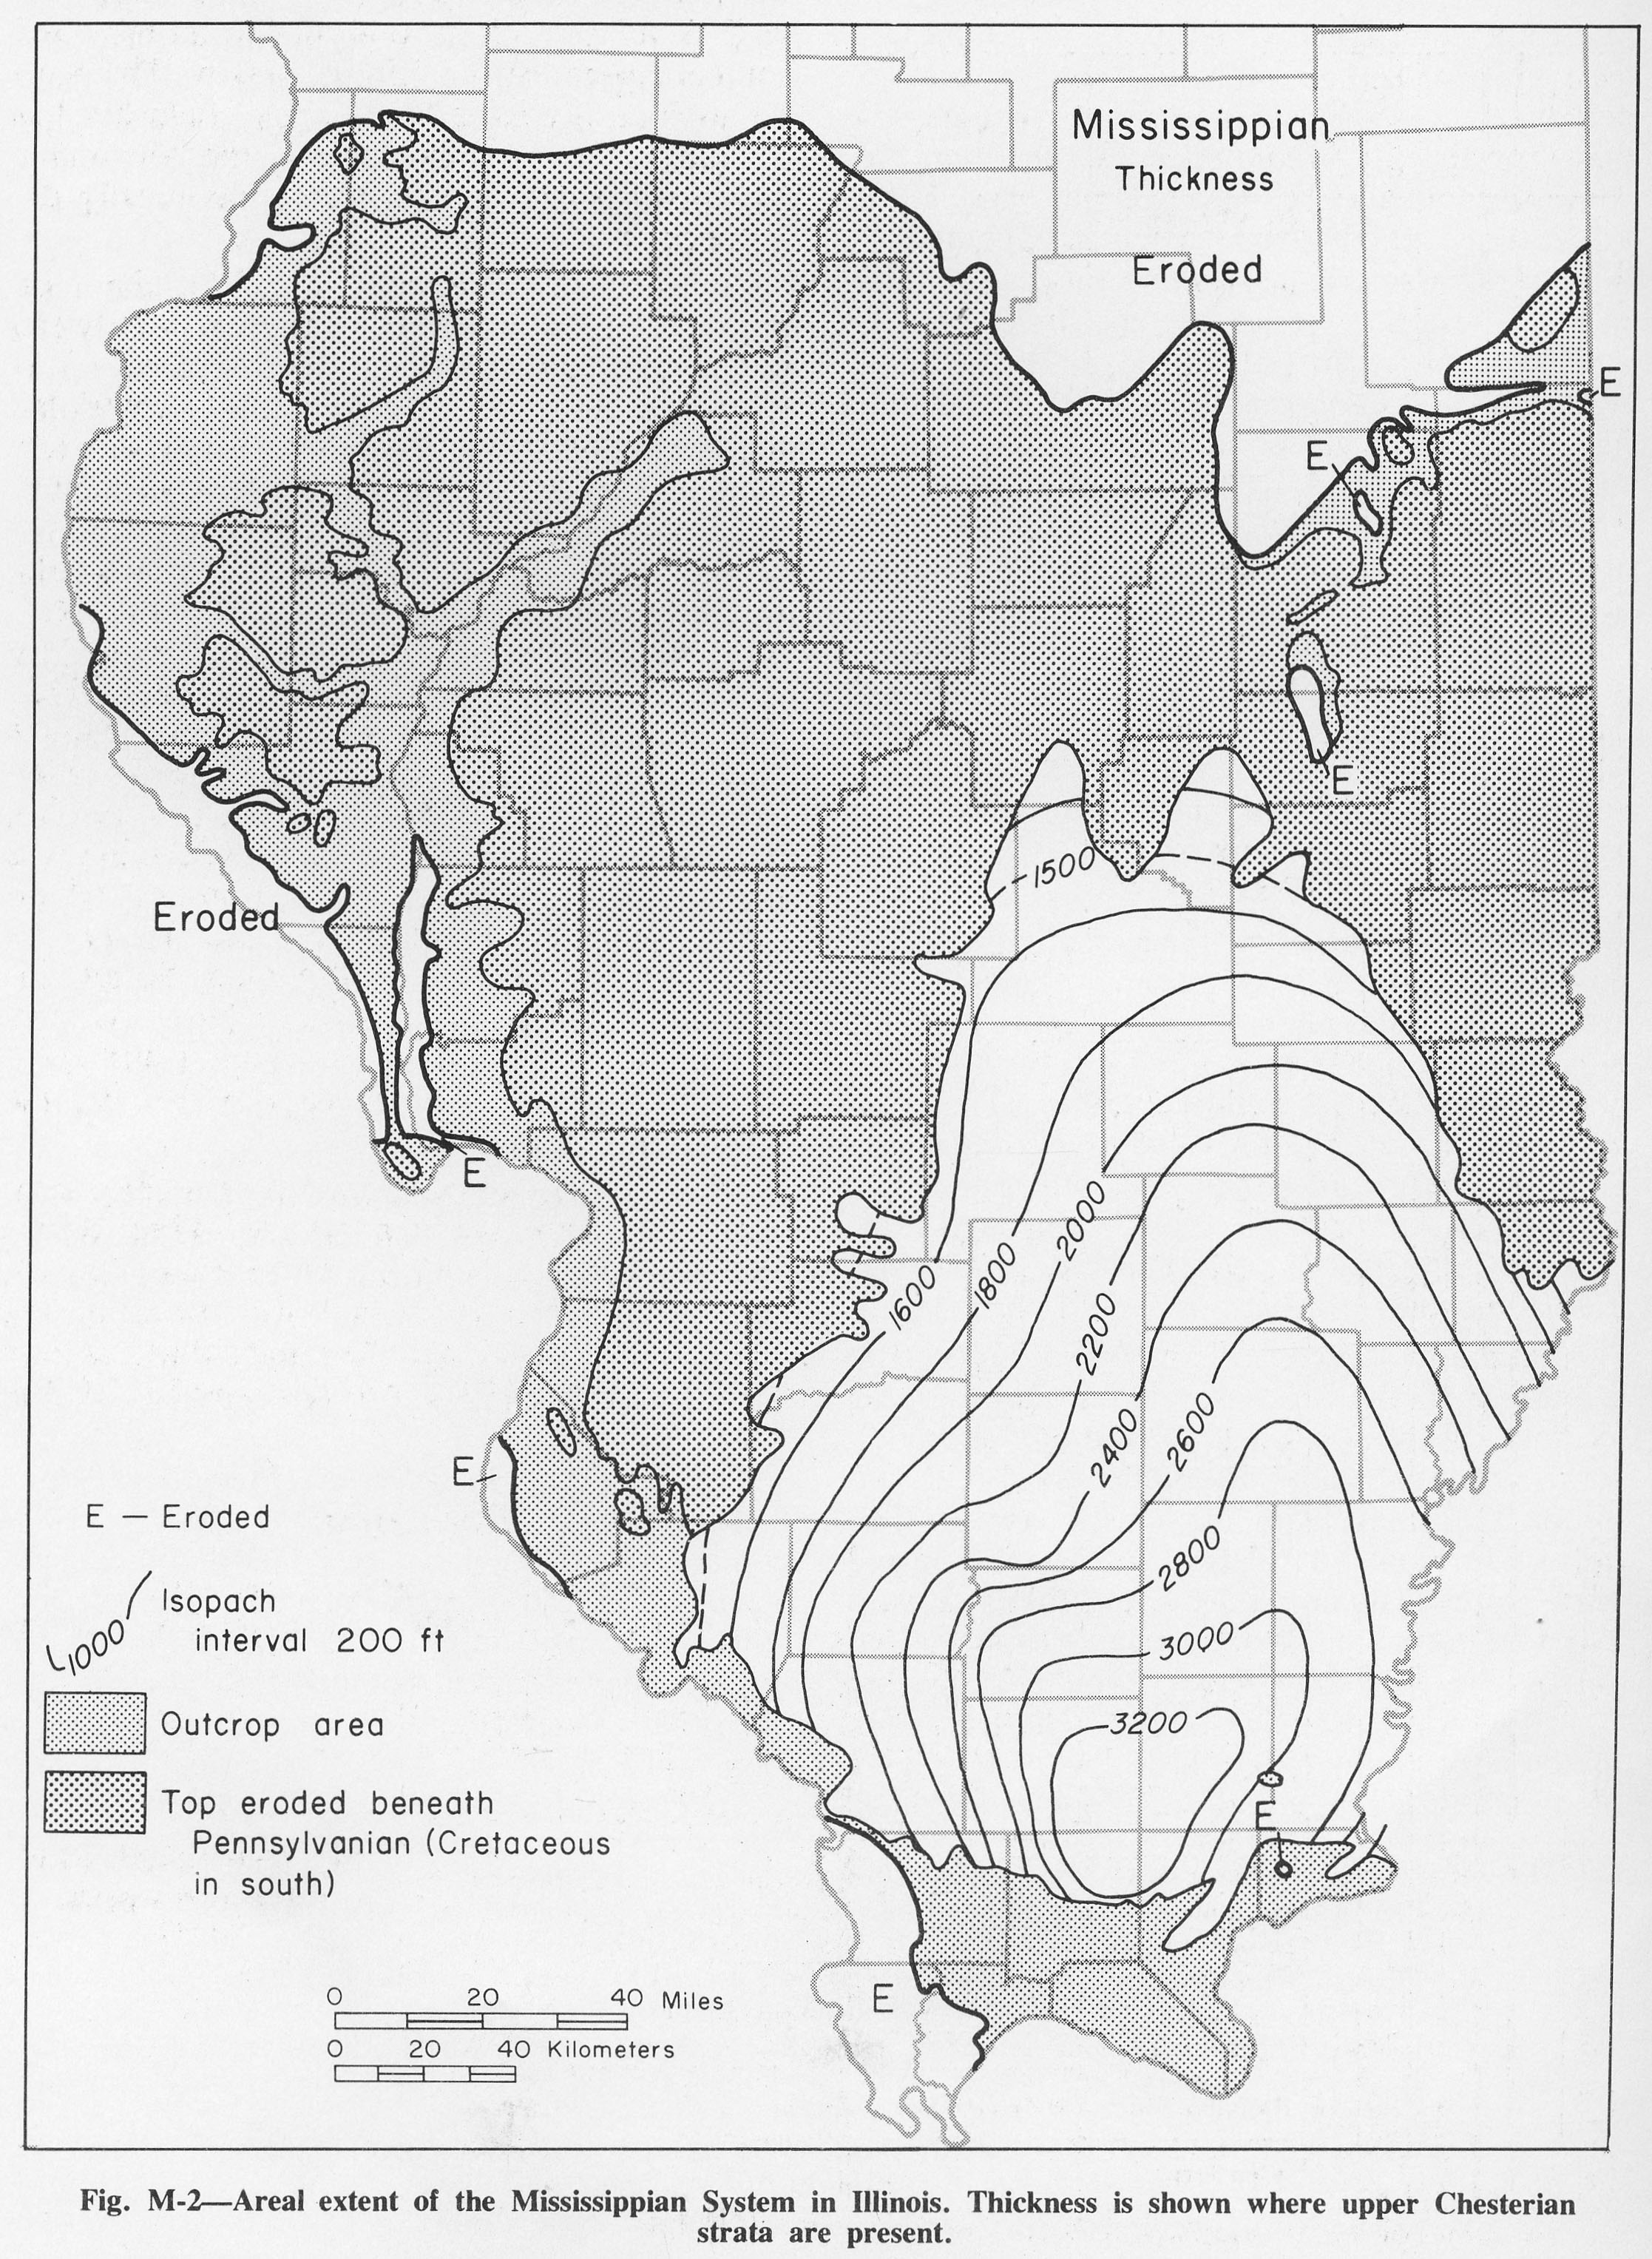
1.38 MB | Alan.Myers | Fig. M-2 -- Areal extent of the Mississippian System in Illinois. Thickness is shown where upper Chesterian strata are present. | 1 |
| 13:22, 4 April 2016 | Figure M-3.jpg (file) |  |
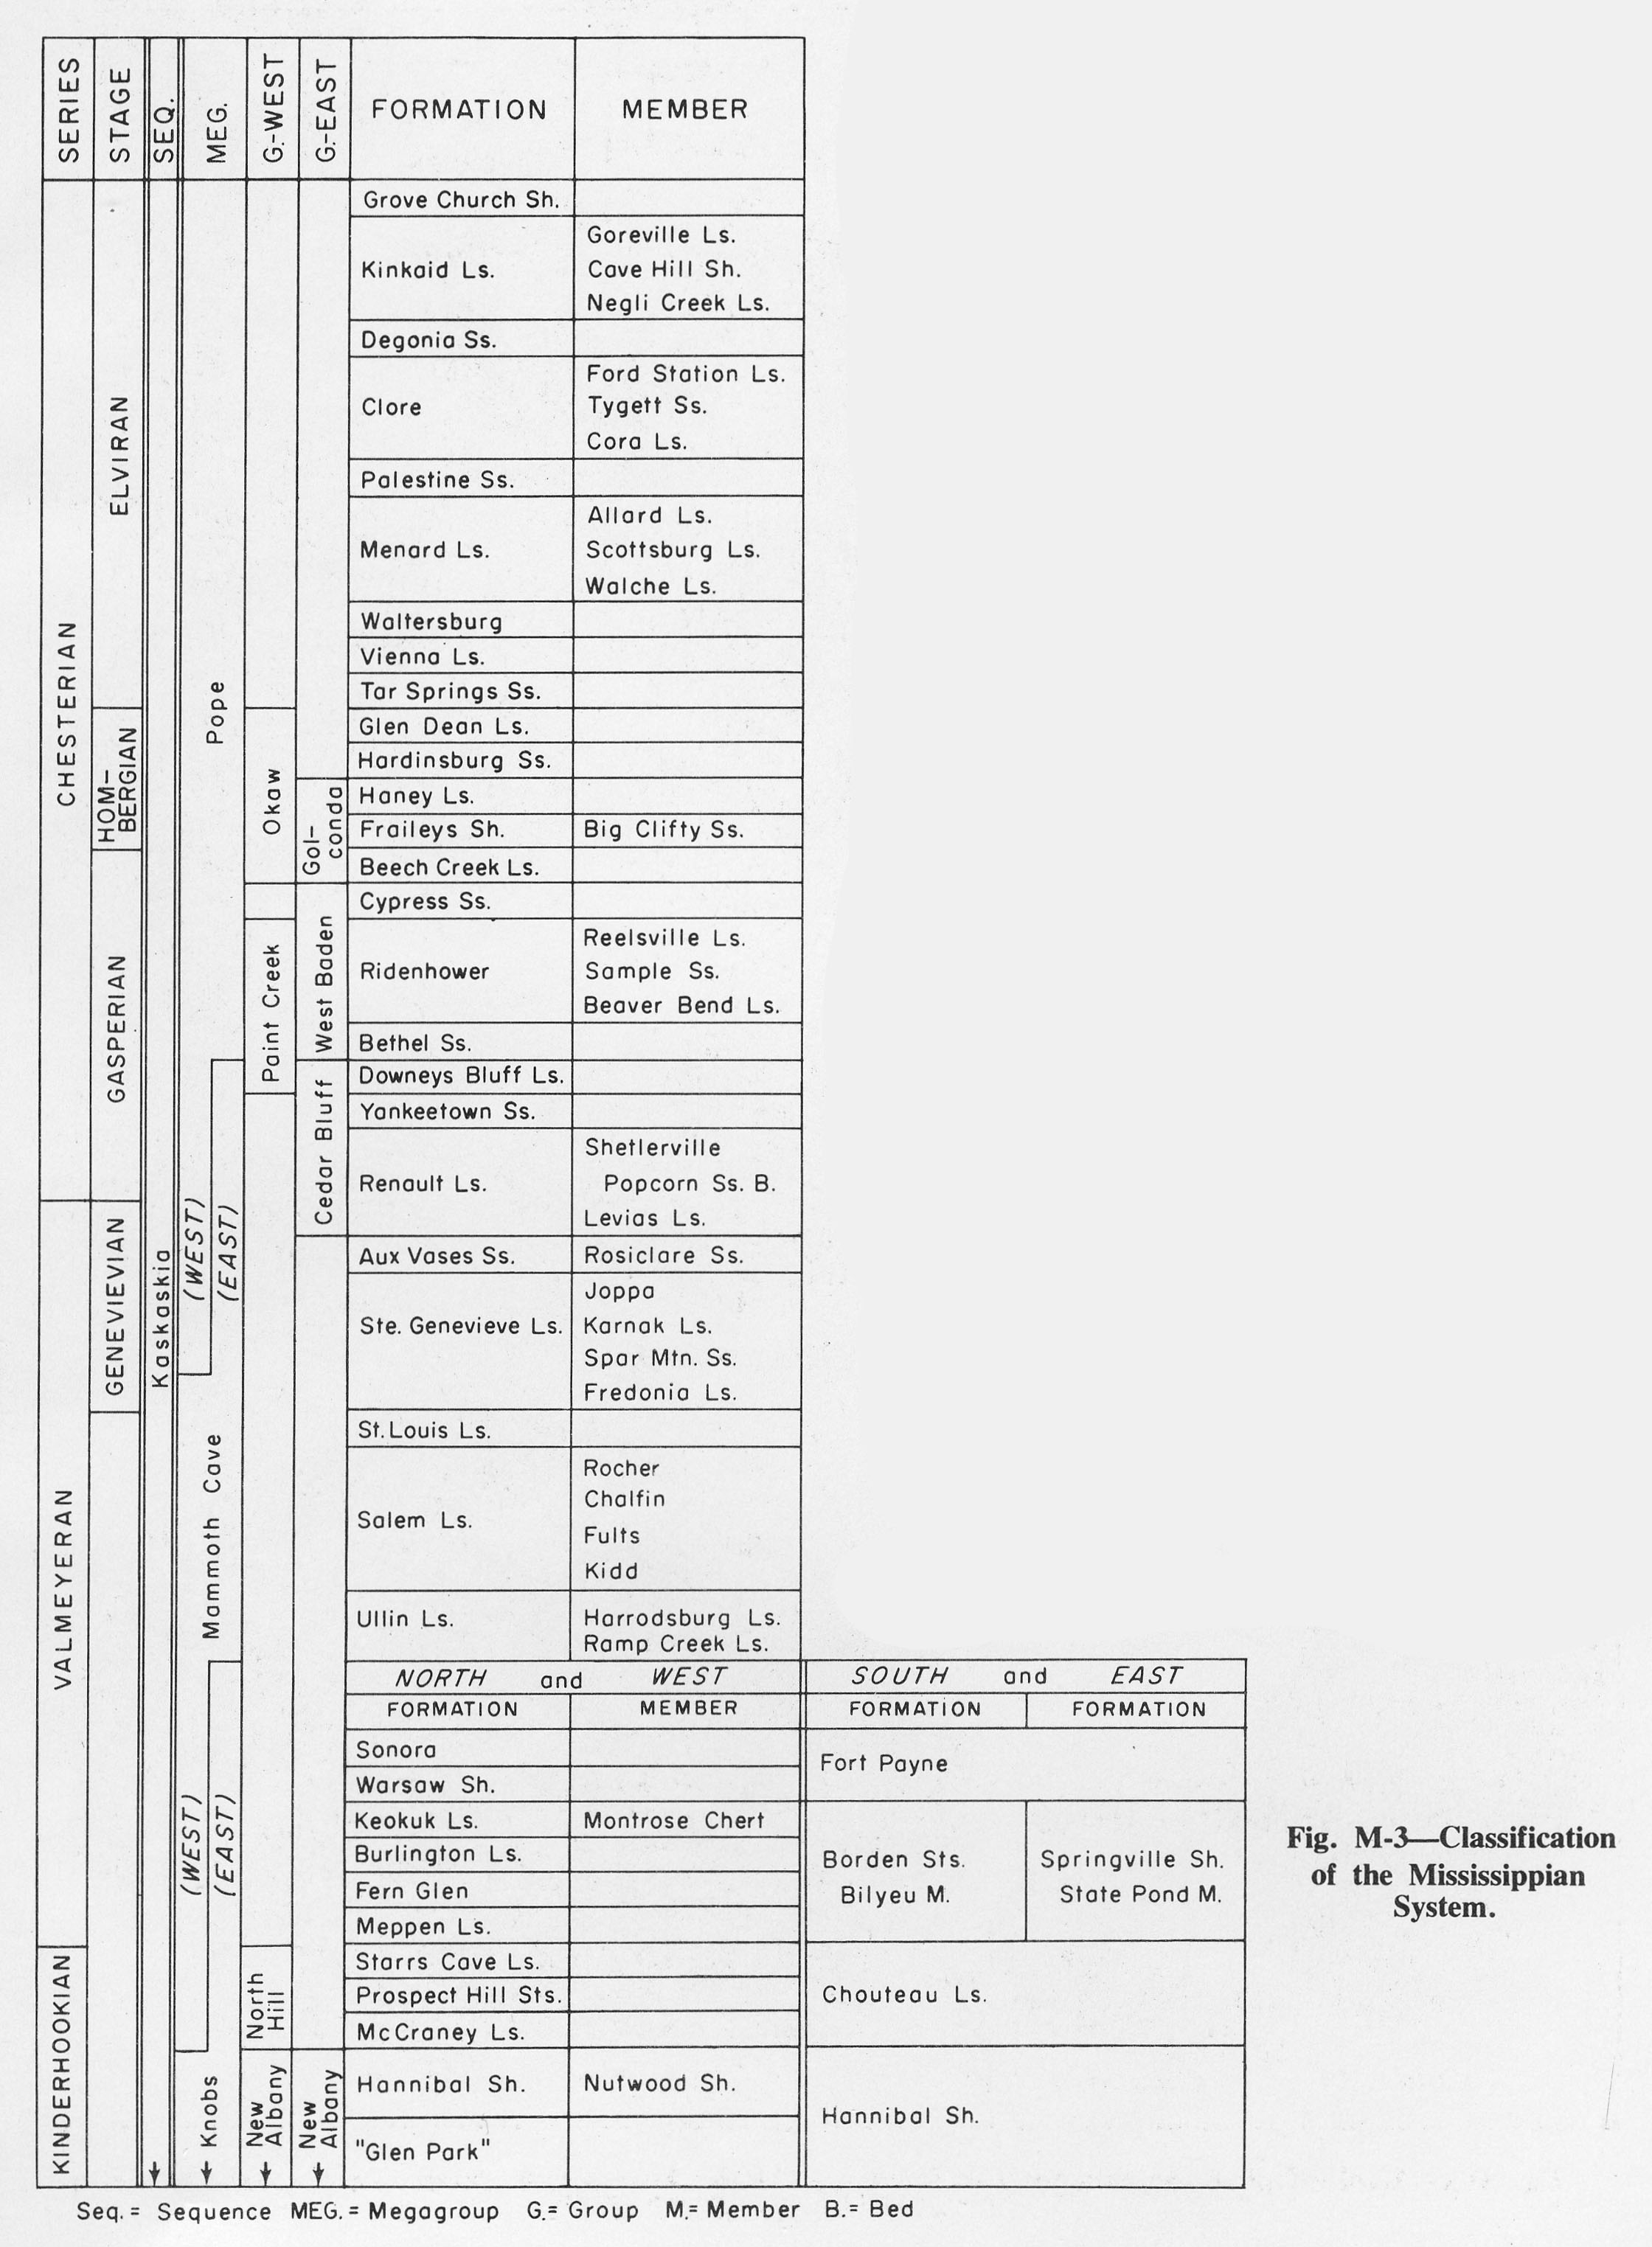
586 KB | Alan.Myers | Fig. M-3 -- Classification of the Mississippian System. | 1 |
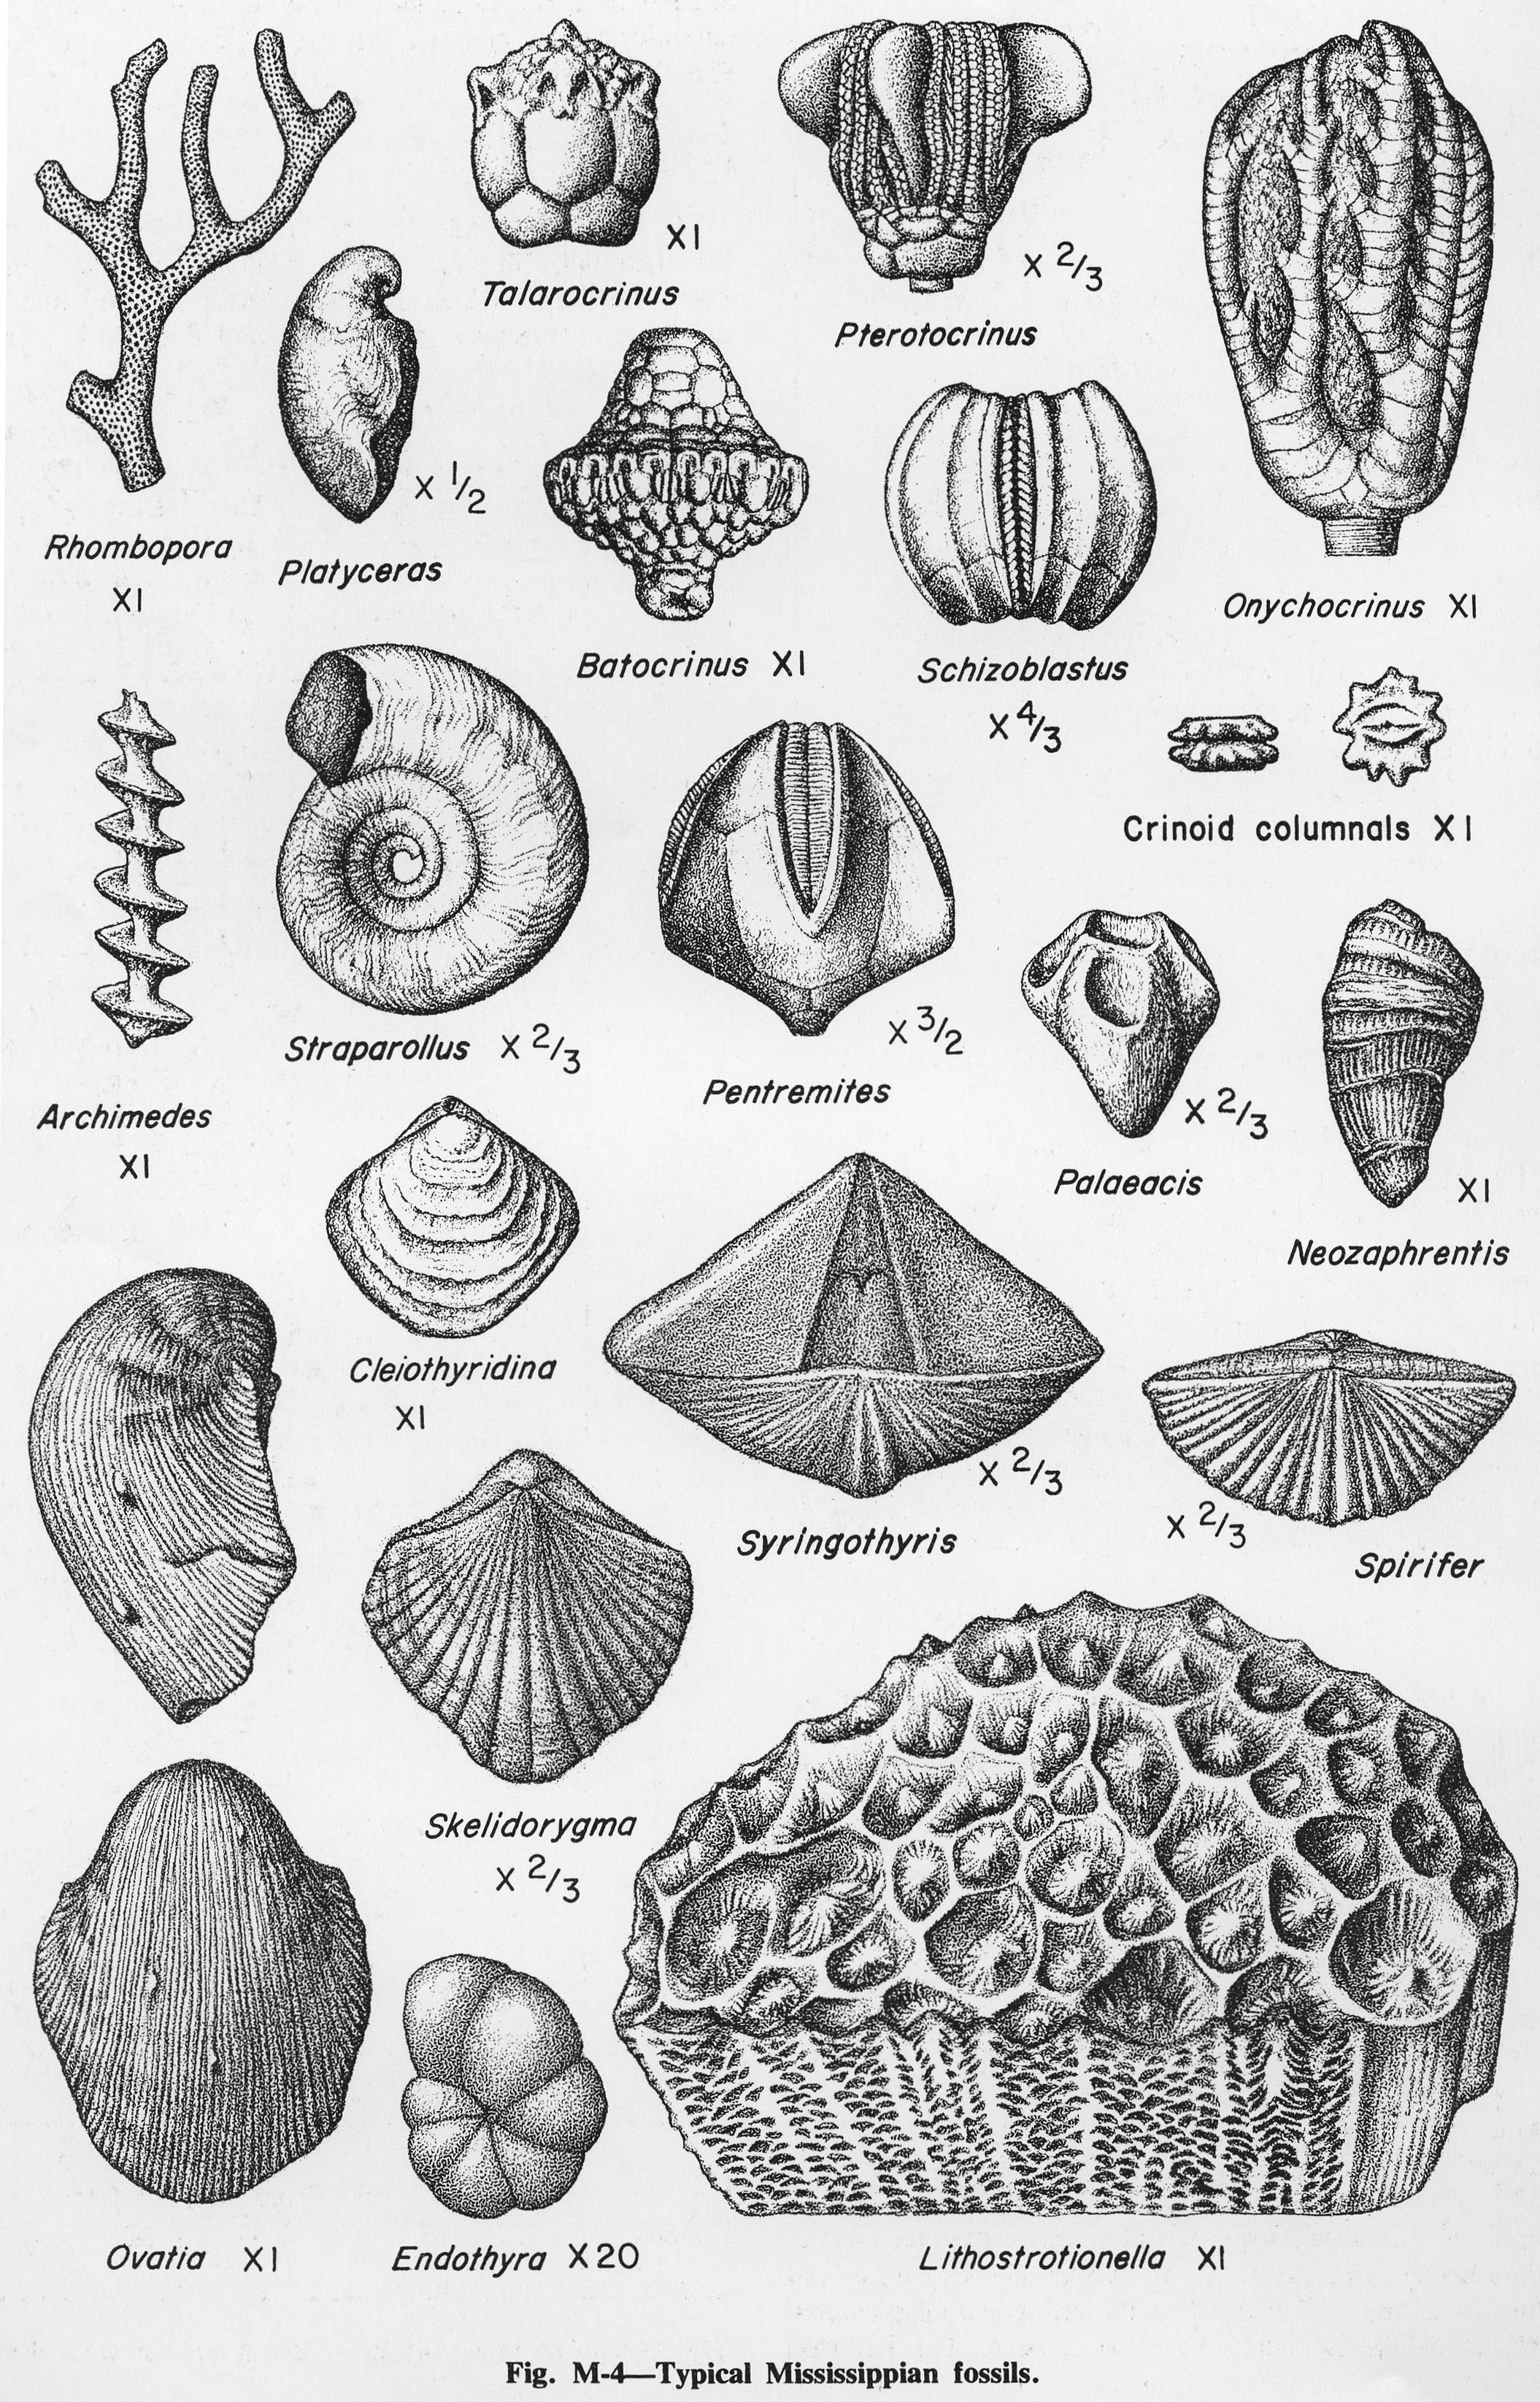
| 13:23, 4 April 2016 | Figure M-4.jpg (file) |  |
1.57 MB | Alan.Myers | Fig. M-4 -- Typical Mississippian fossils. | 1 |
| 13:24, 4 April 2016 | Figure M-5.jpg (file) |  |
257 KB | Alan.Myers | Fig. M-5 -- Thickness of the Kinderhookian Series. | 1 |
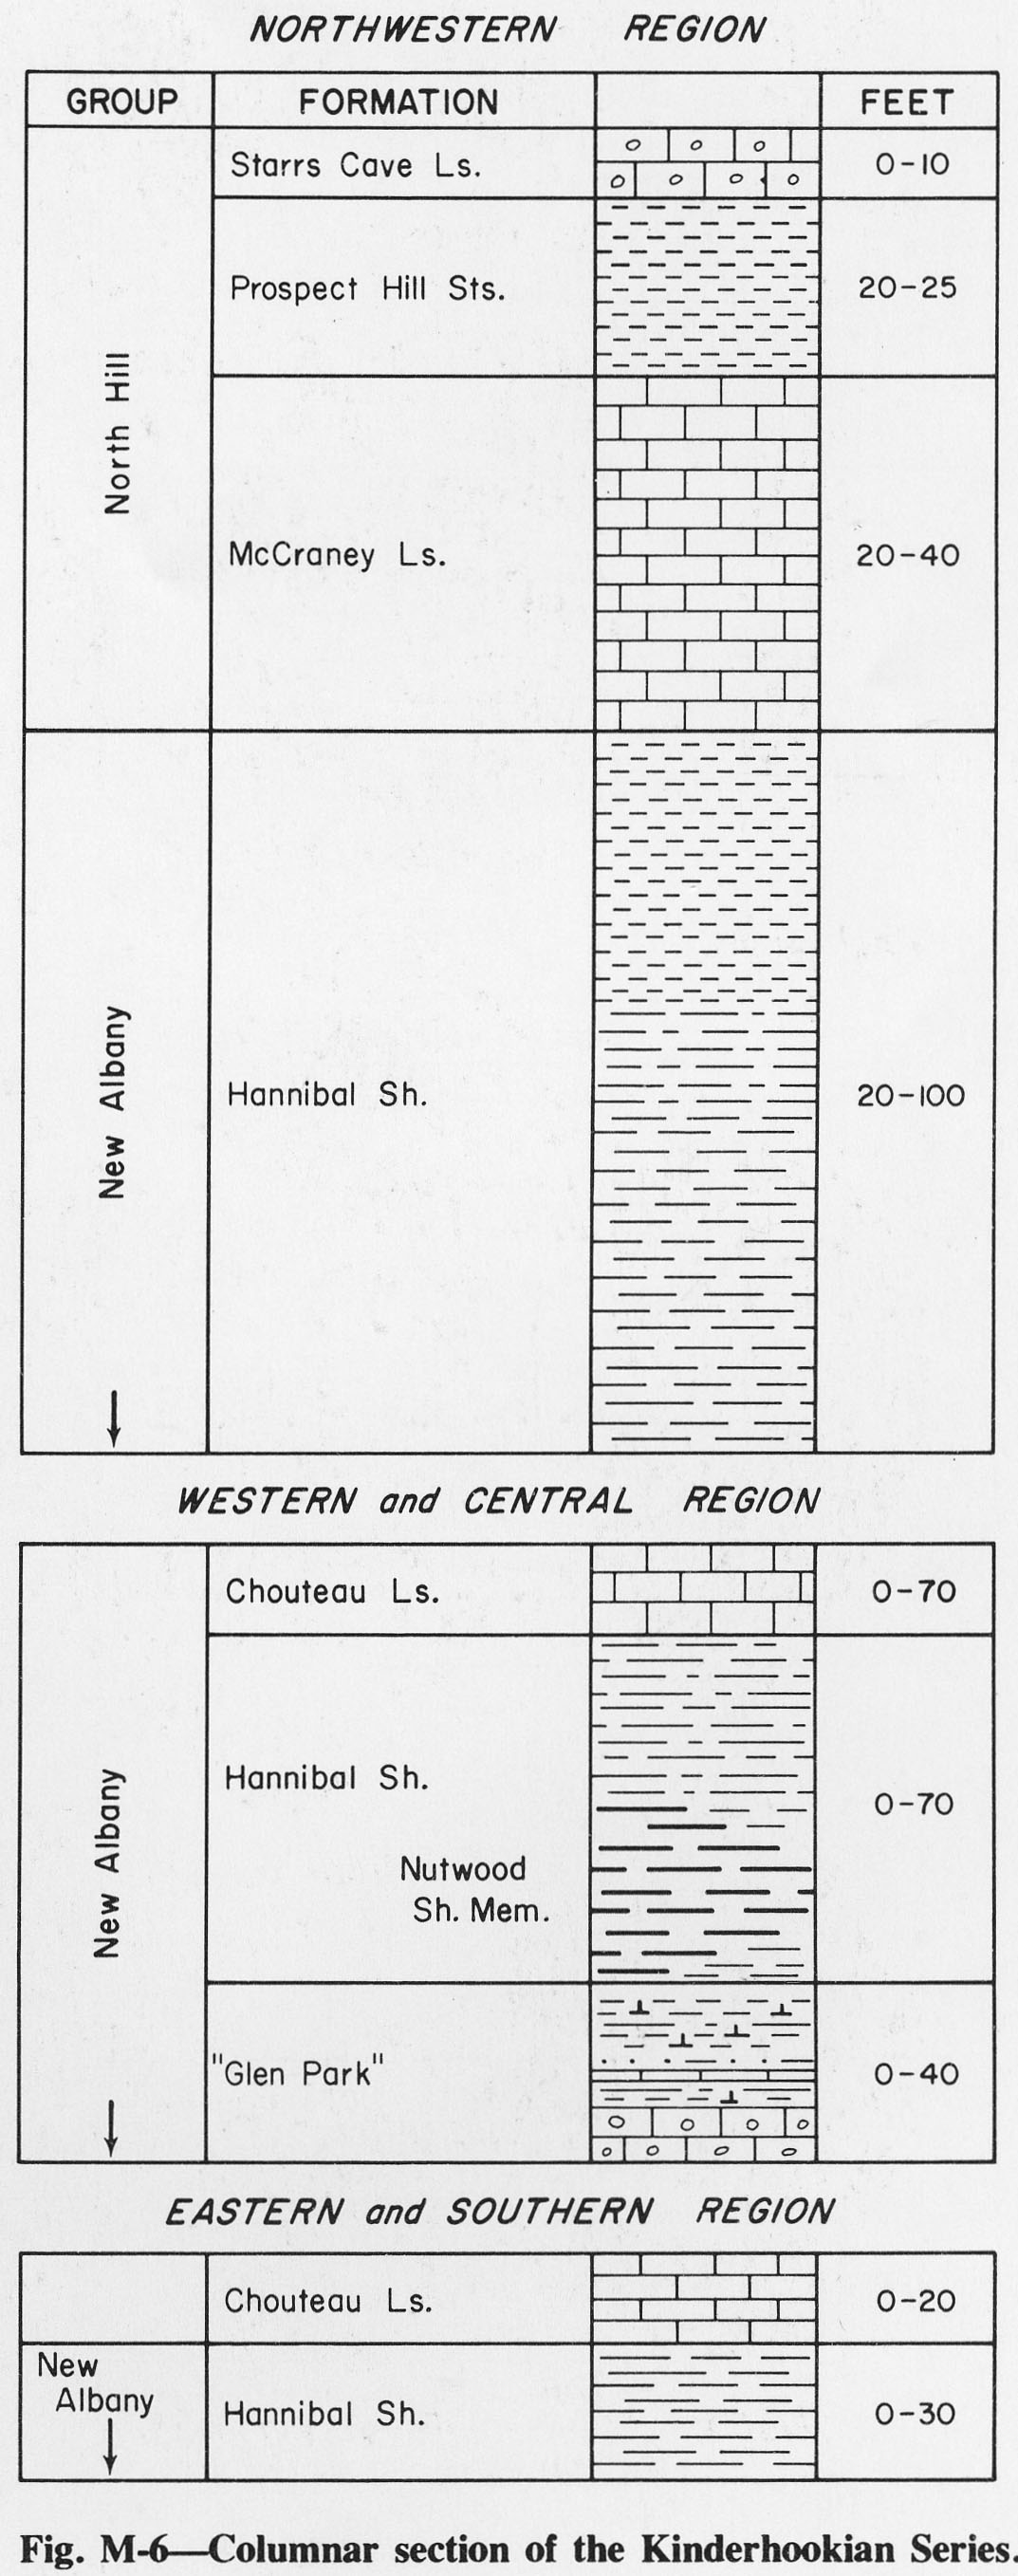
| 13:24, 4 April 2016 | Figure M-6.jpg (file) |  |
325 KB | Alan.Myers | Fig. M-6 -- Columnar section of the Kinderhookian Series. | 1 |
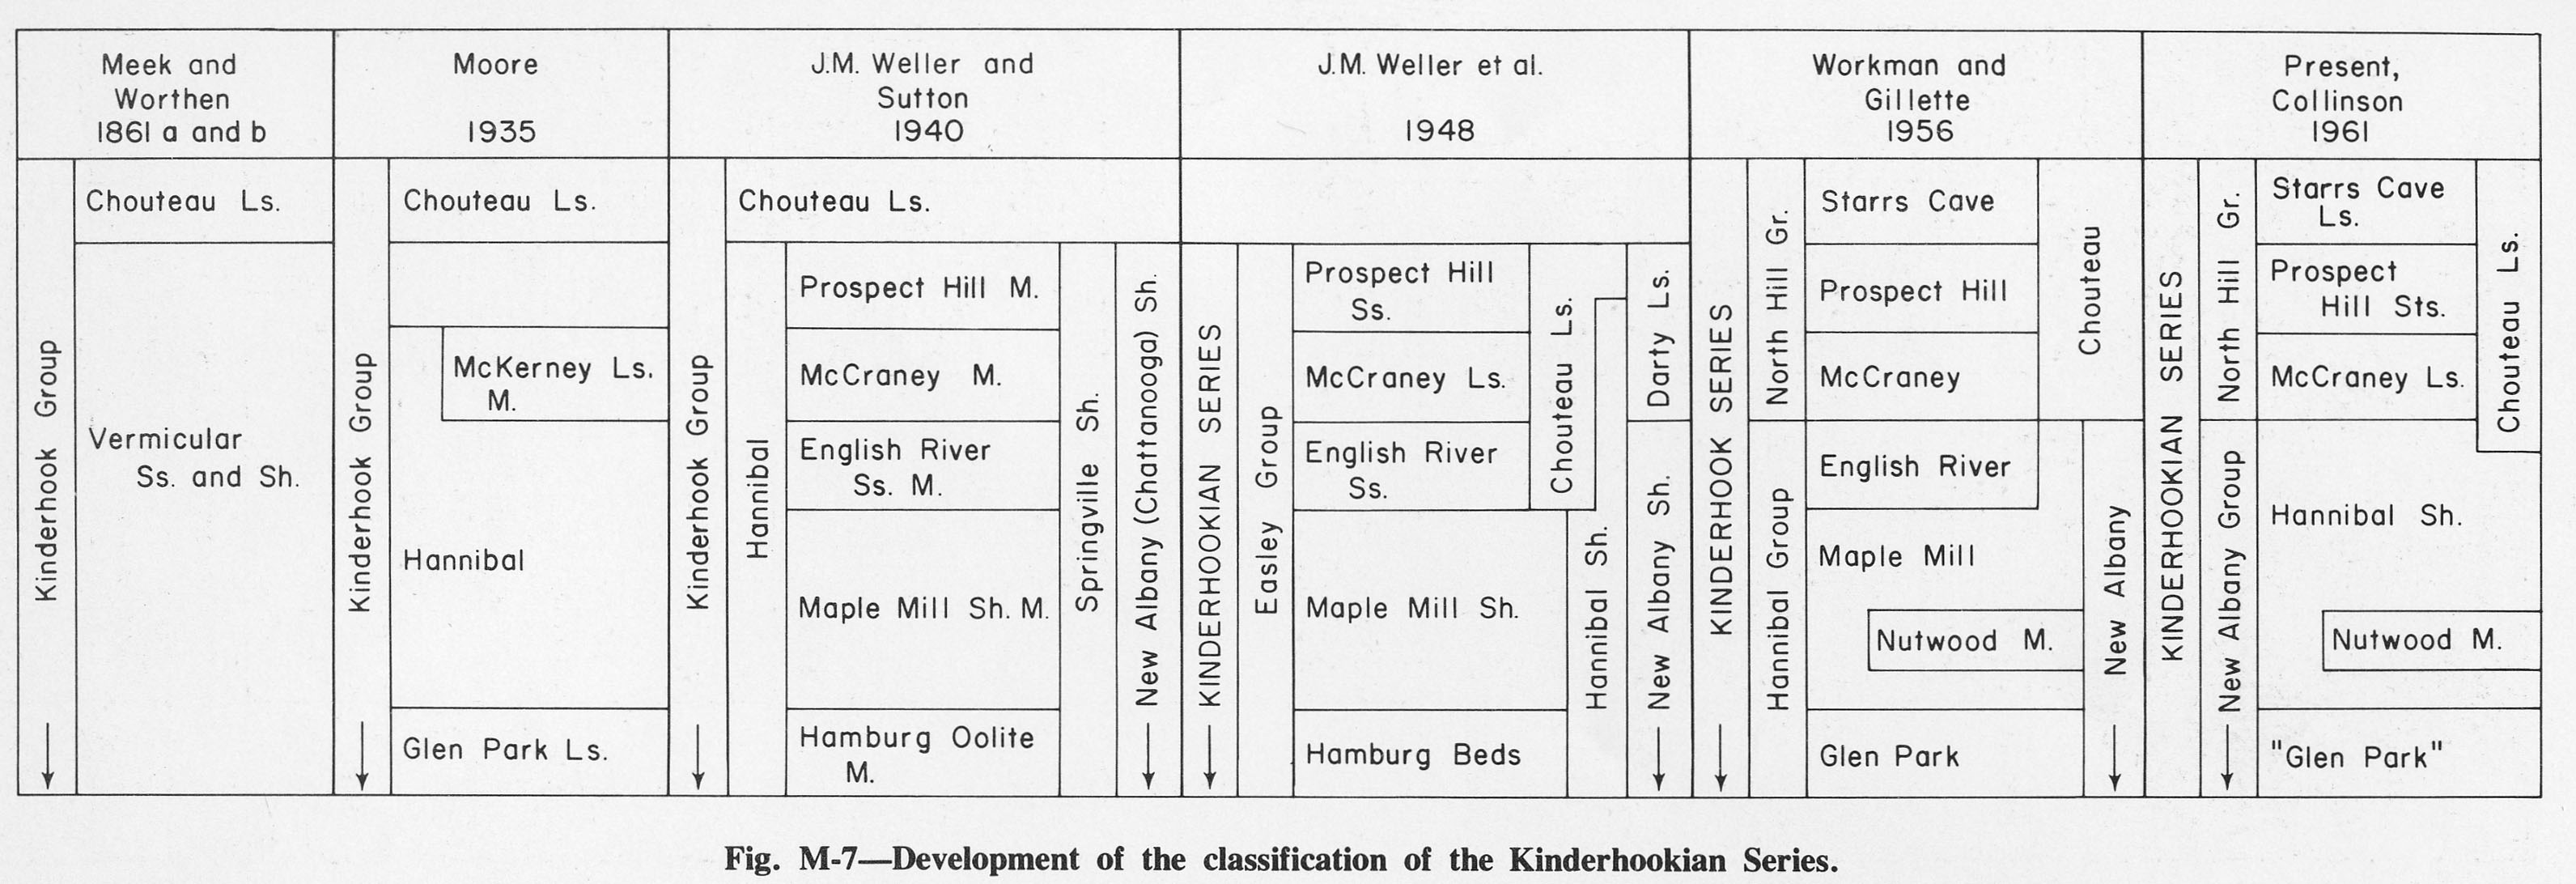
| 13:25, 4 April 2016 | Figure M-7.jpg (file) |  |
391 KB | Alan.Myers | Fig. M-7 -- Development of the classification of the Kinderhookian Series. | 1 |
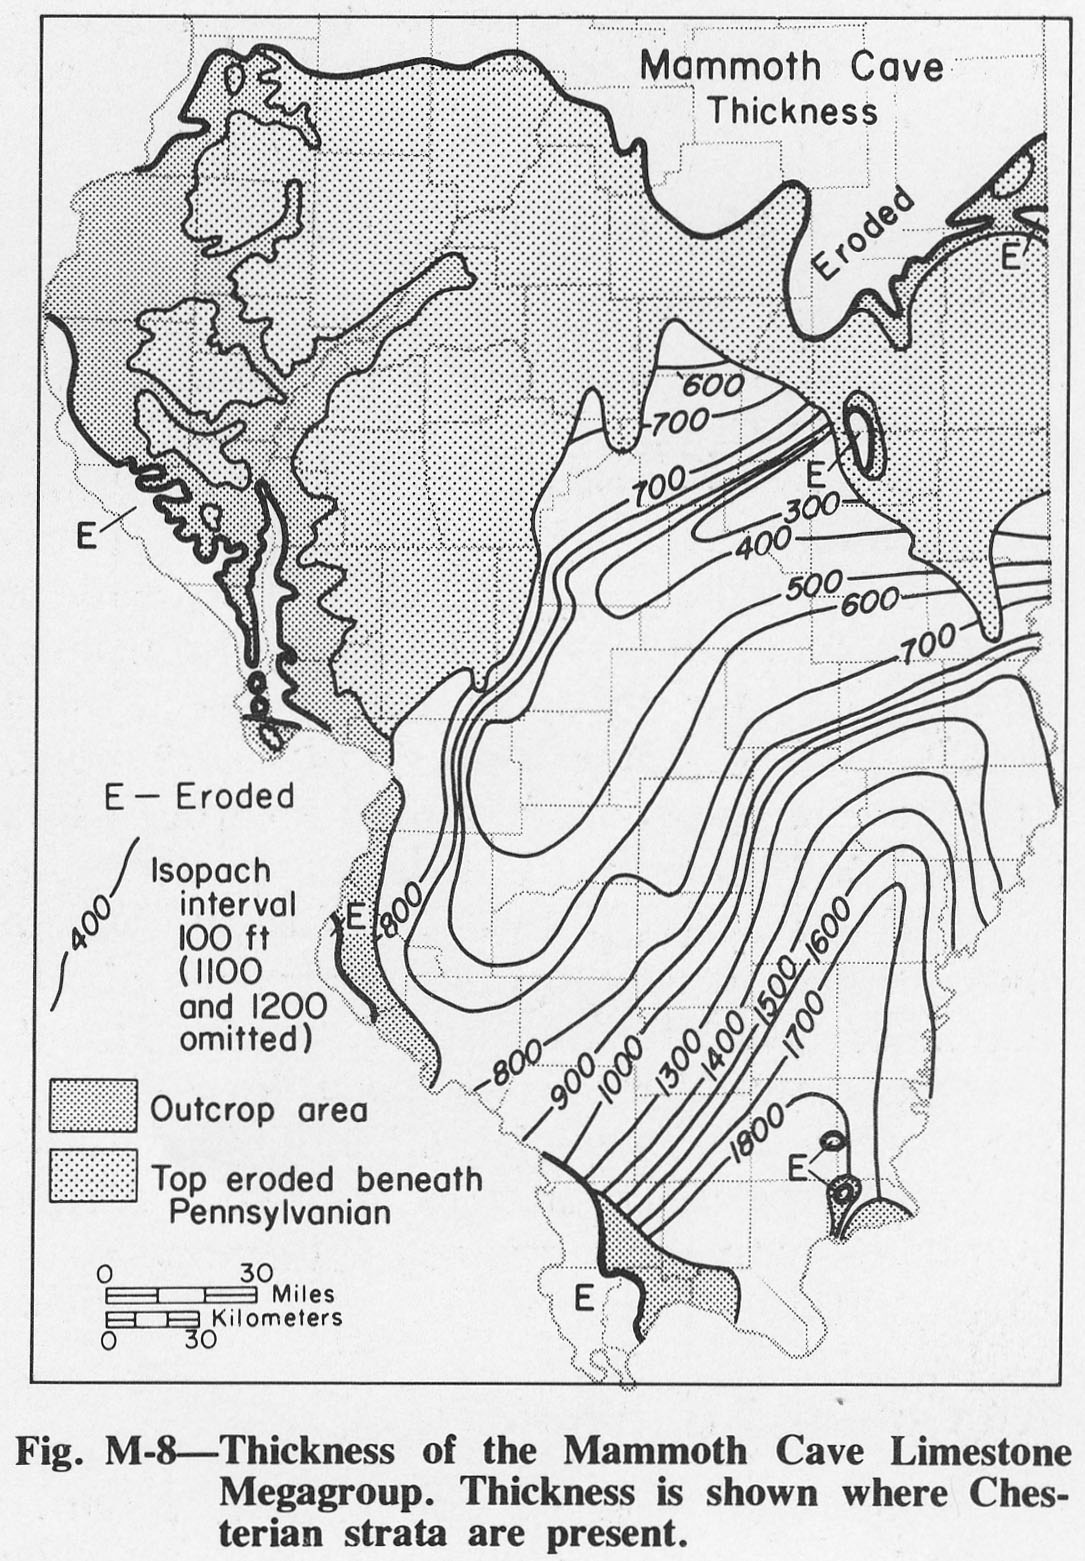
| 13:30, 4 April 2016 | Figure M-8.jpg (file) |  |
400 KB | Alan.Myers | Fig. M-8 -- Thickness of the Mammoth Cave Limestone Megagroup. Thickness is shown where Chesterian strata are present. | 1 |
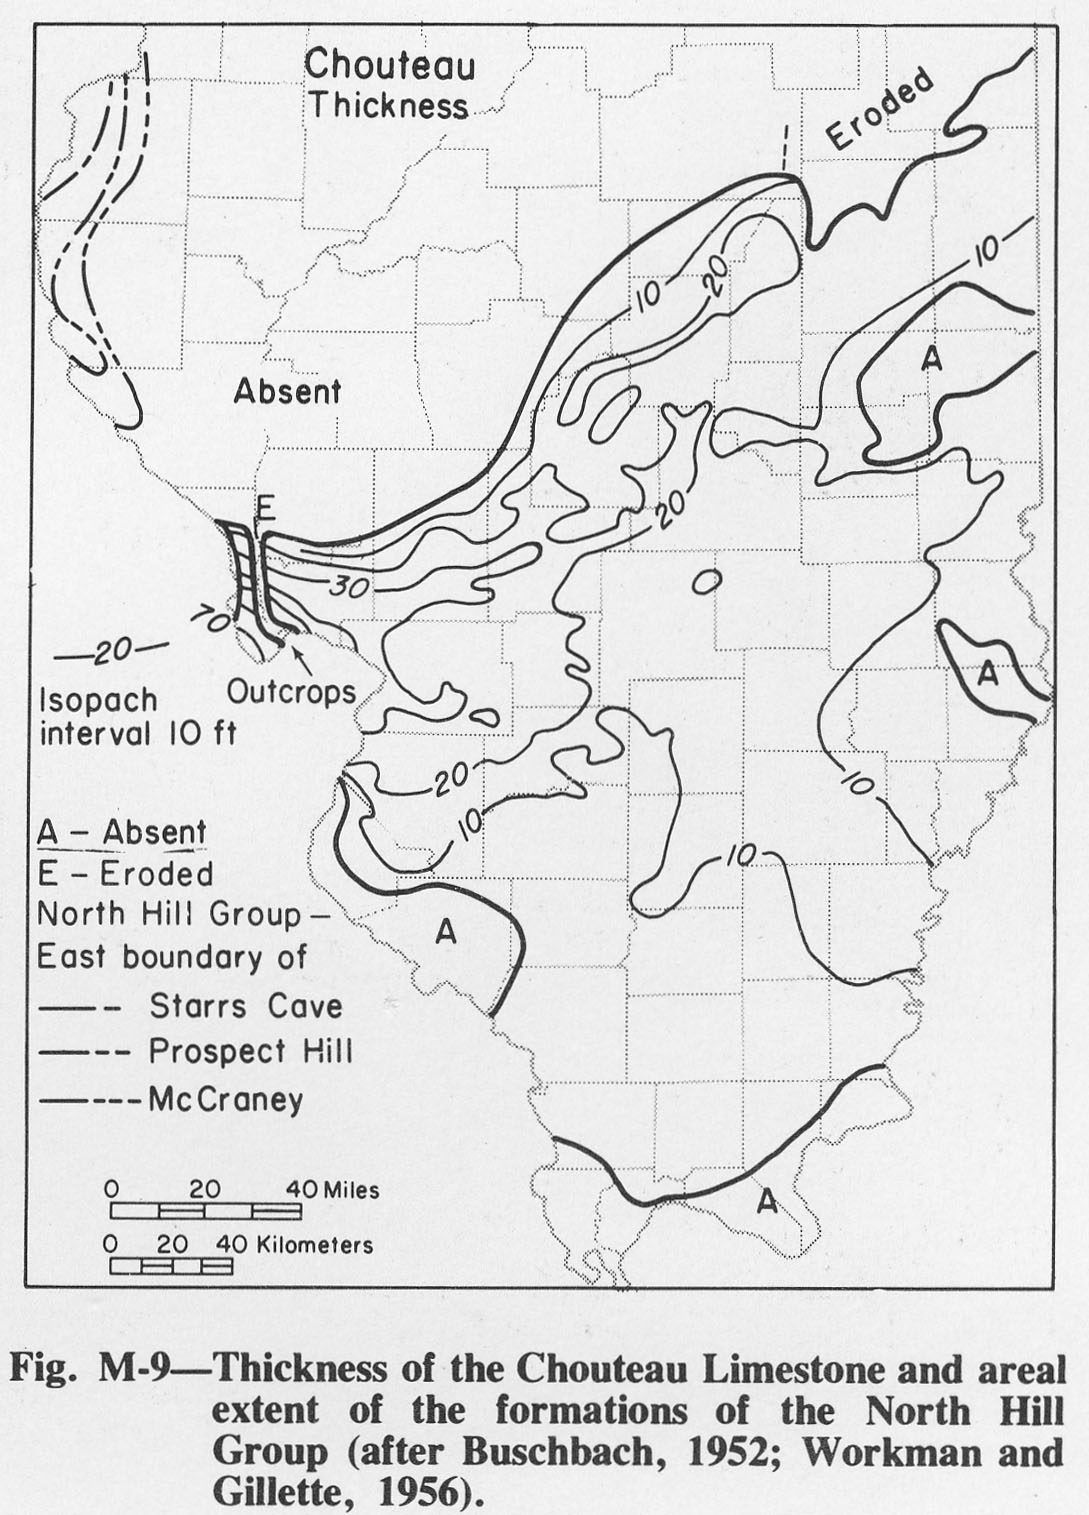
| 13:53, 4 April 2016 | Figure M-9.jpg (file) |  |
259 KB | Alan.Myers | Fig. M-9 -- Thickness of Chouteau Limestone and areal extent of formations of the North Hill Group (after Buschback, 1952; Workman and Gillete, 1956). | 1 |
| 13:54, 4 April 2016 | Figure M-10.jpg (file) |  |
362 KB | Alan.Myers | Fig. M-10 -- Thickness of the Valmeyeran Series. Thickness is shown where Chesterian strata are present. | 1 |
| 13:55, 4 April 2016 | Figure M-11.jpg (file) |  |
182 KB | Alan.Myers | Fig. M-11 -- Columnar section of the Valmeyeran Series in western Illinois. | 1 |
| 13:56, 4 April 2016 | Figure M-12.jpg (file) |  |
406 KB | Alan.Myers | Fig. M-12 -- Columnar section of the Valmeyeran Series in central Illinois. | 1 |
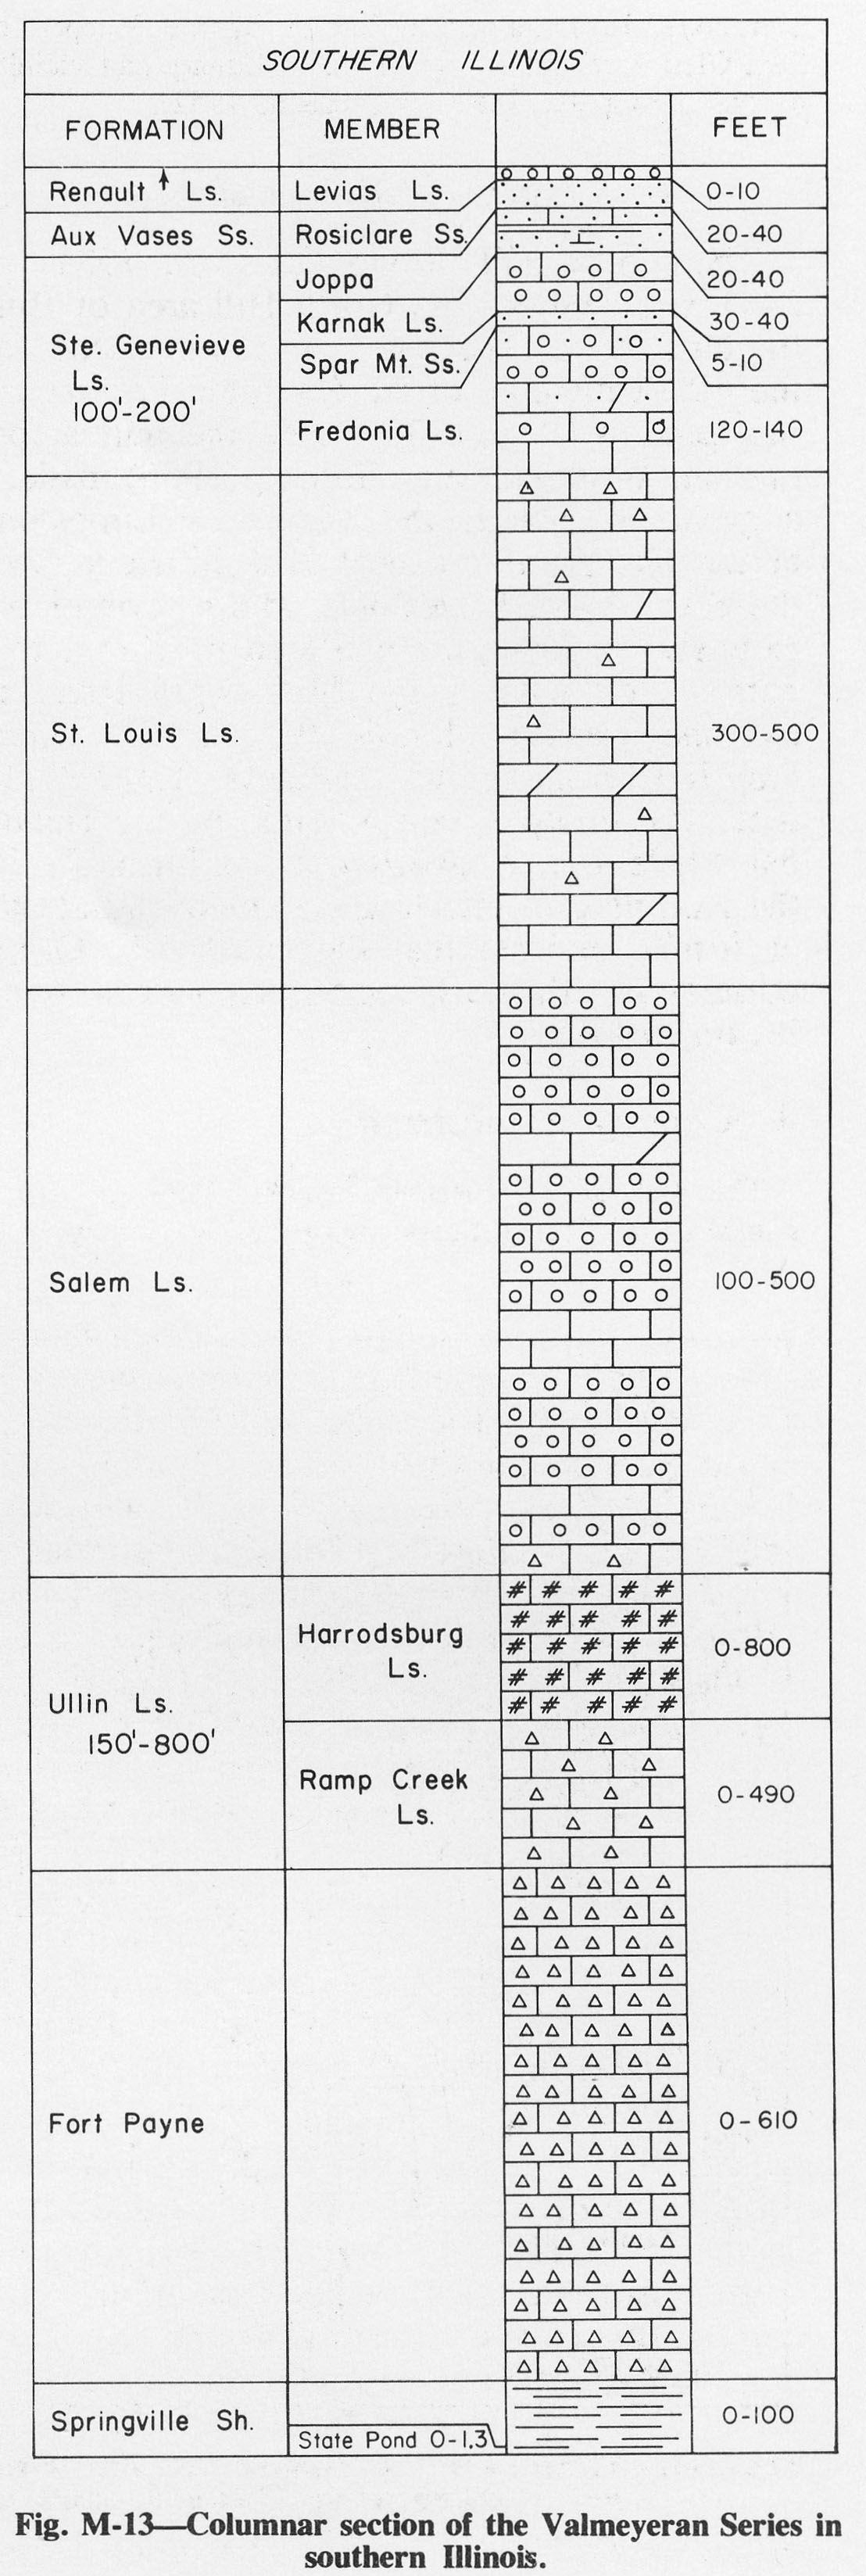
| 13:57, 4 April 2016 | Figure M-13.jpg (file) |  |
415 KB | Alan.Myers | Fig. M-13 -- Columnar section of the Valmeyeran Series in southern Illinois. | 1 |
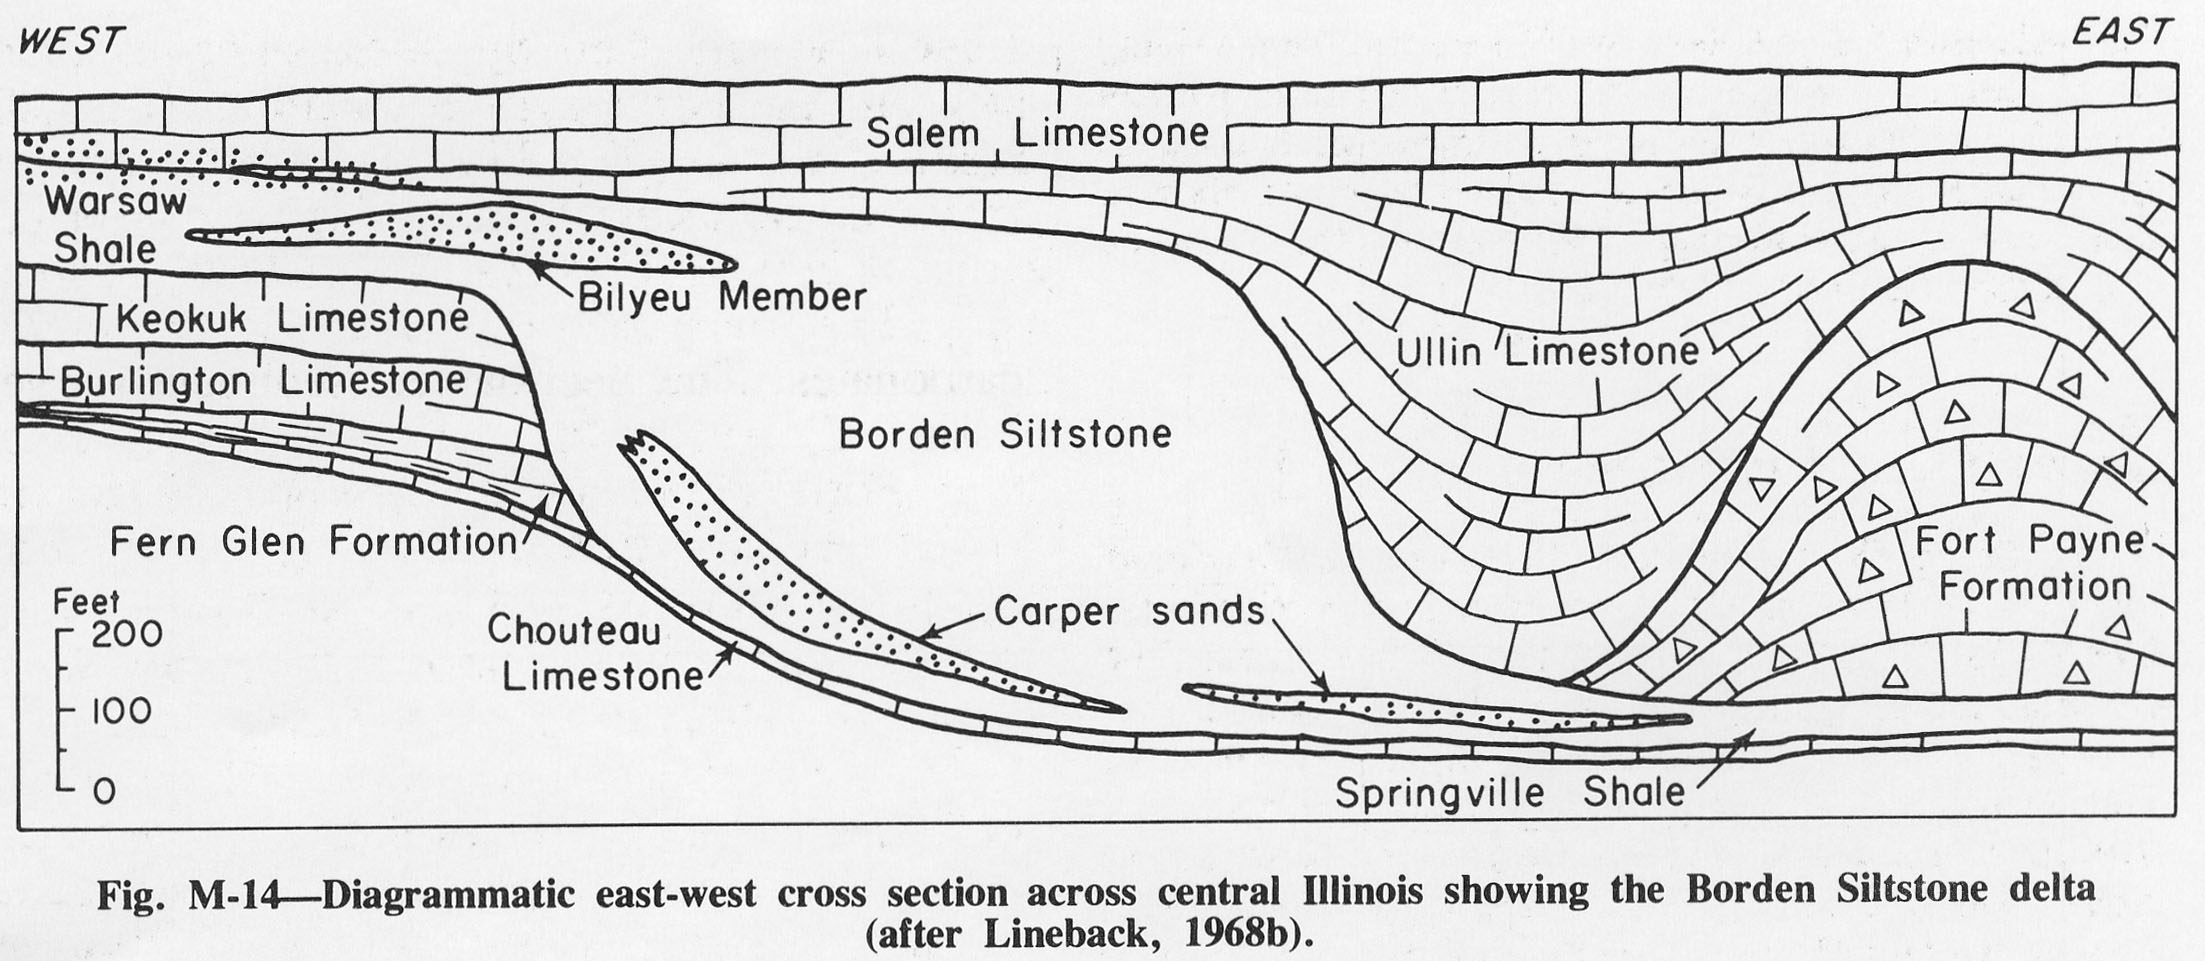
| 13:58, 4 April 2016 | Figure M-14.jpg (file) |  |
319 KB | Alan.Myers | Fig. M-14 -- Diagrammatic east-west cross section across central Illinois showing the Borden Siltstone delta (after Lineback, 1968b). | 1 |