Uploads by Illex-gron
Jump to navigation
Jump to search
This special page shows all uploaded files.
| Date | Name | Thumbnail | Size | Description | Versions |
|---|---|---|---|---|---|
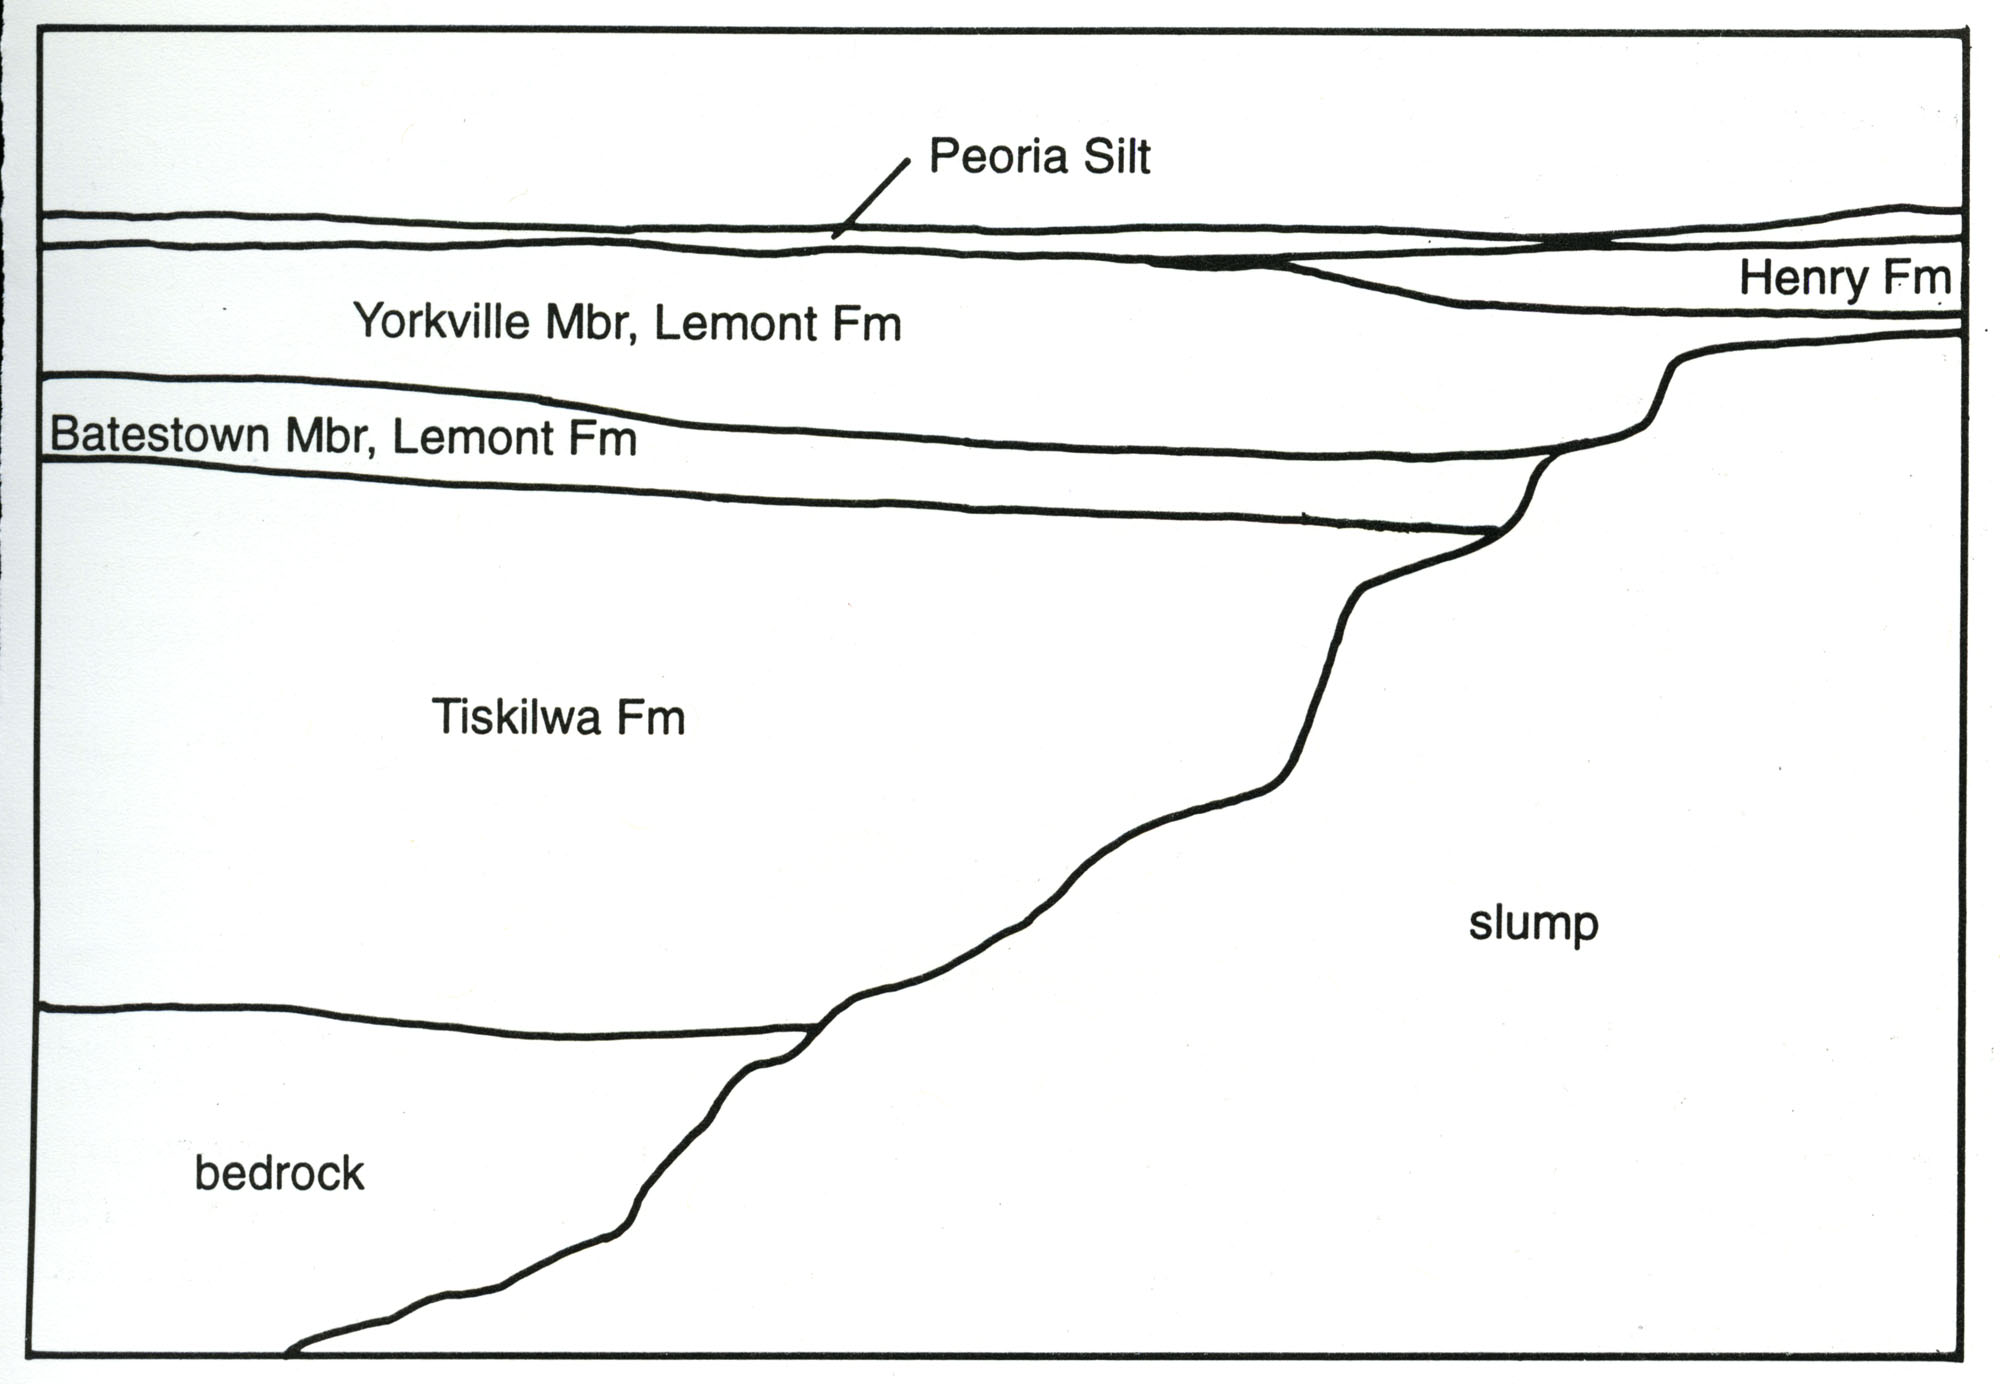
| 17:45, 19 April 2016 | 104-Figure 27 Diagram.jpg (file) |  |
205 KB | Figure 27 Diagram | 1 |
| 15:50, 19 April 2016 | 104-Figure 2.jpg (file) |  |
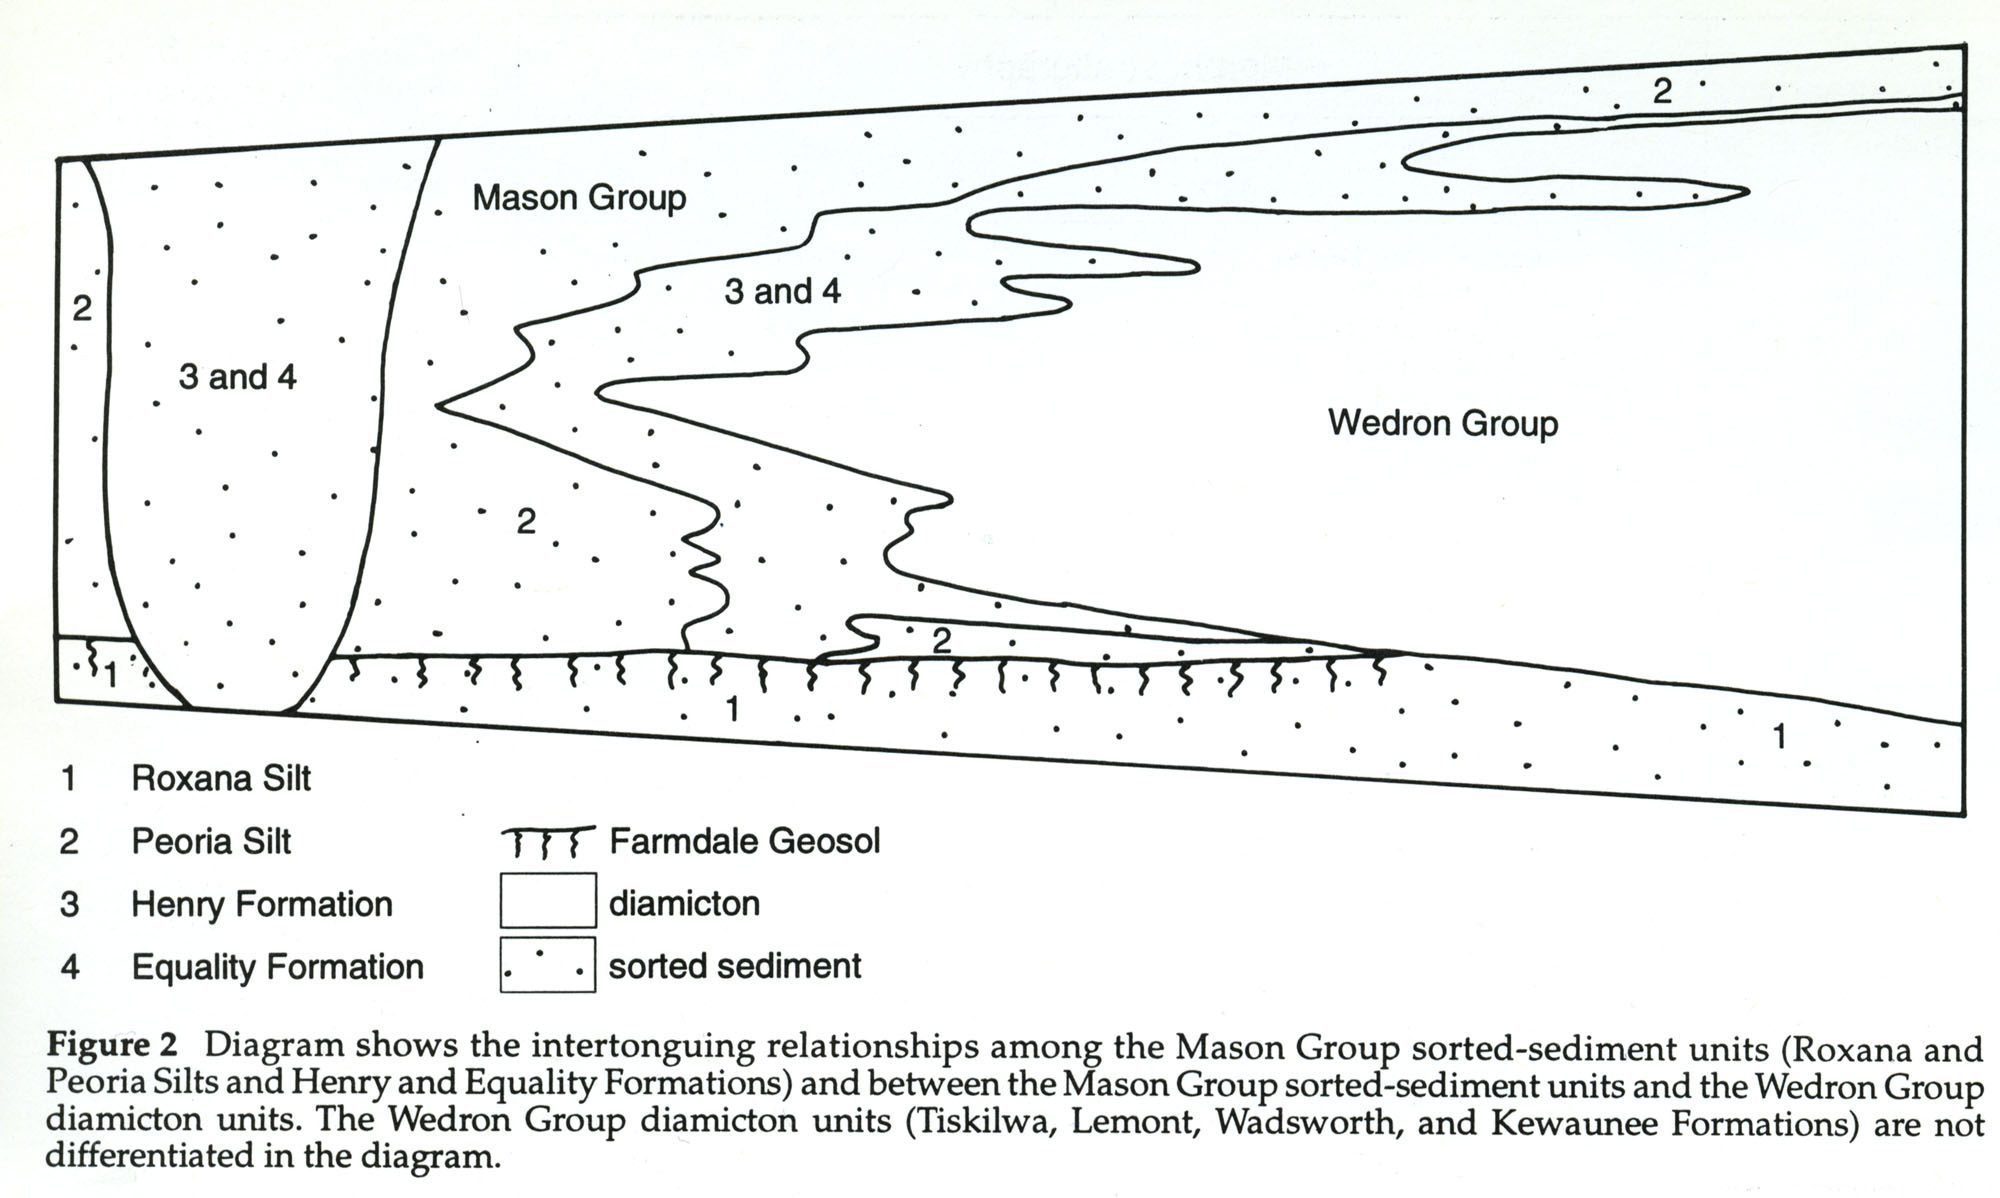
261 KB | Figure 2 -- Diagram shows the intertonguing relationships among the Mason Group sorted-sediment units (Roxana and Peoria Silts and Henry and Equality Formations) and between the Mason Group sorted-sediment units and the Wedron Group diamicton units. Th... | 1 |
| 17:22, 18 April 2016 | 94-tb 6-m.jpg (file) |  |
261 KB | 1 | |
| 15:57, 19 April 2016 | 104-Figure 4a.jpg (file) |  |
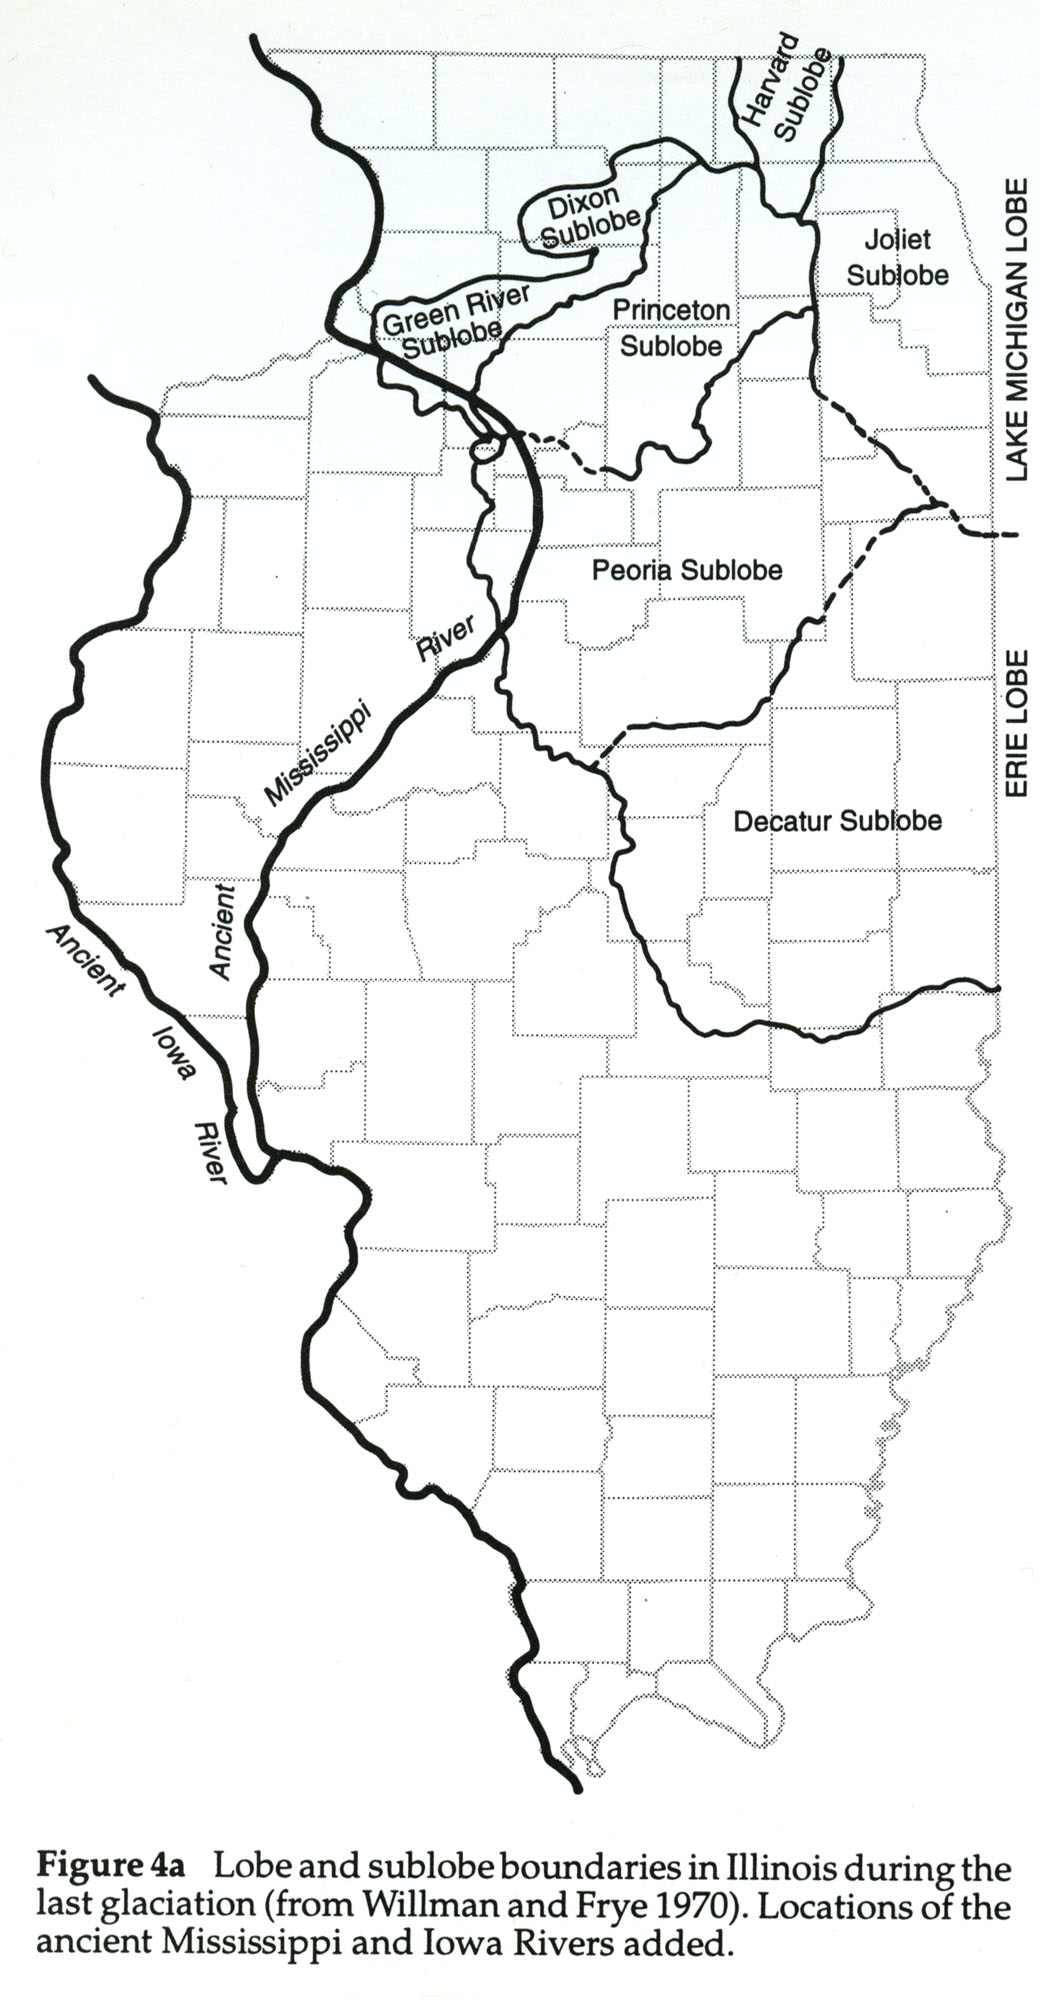
271 KB | Figure 4a -- Lobe and sublobe boundaries in Illinois during the last glaciation (from Willman and Frye 1970). Locations of the ancient Mississippi and Iowa Rivers added. | 1 |
| 15:31, 1 April 2016 | Figure P-7.jpg (file) |  |
276 KB | Fig. P-7 -- Arrangement of lithologic units in a cyclothem (after Willman and Payne, 1942). | 1 |
| 16:42, 18 April 2016 | 94-fig 12.jpg (file) |  |
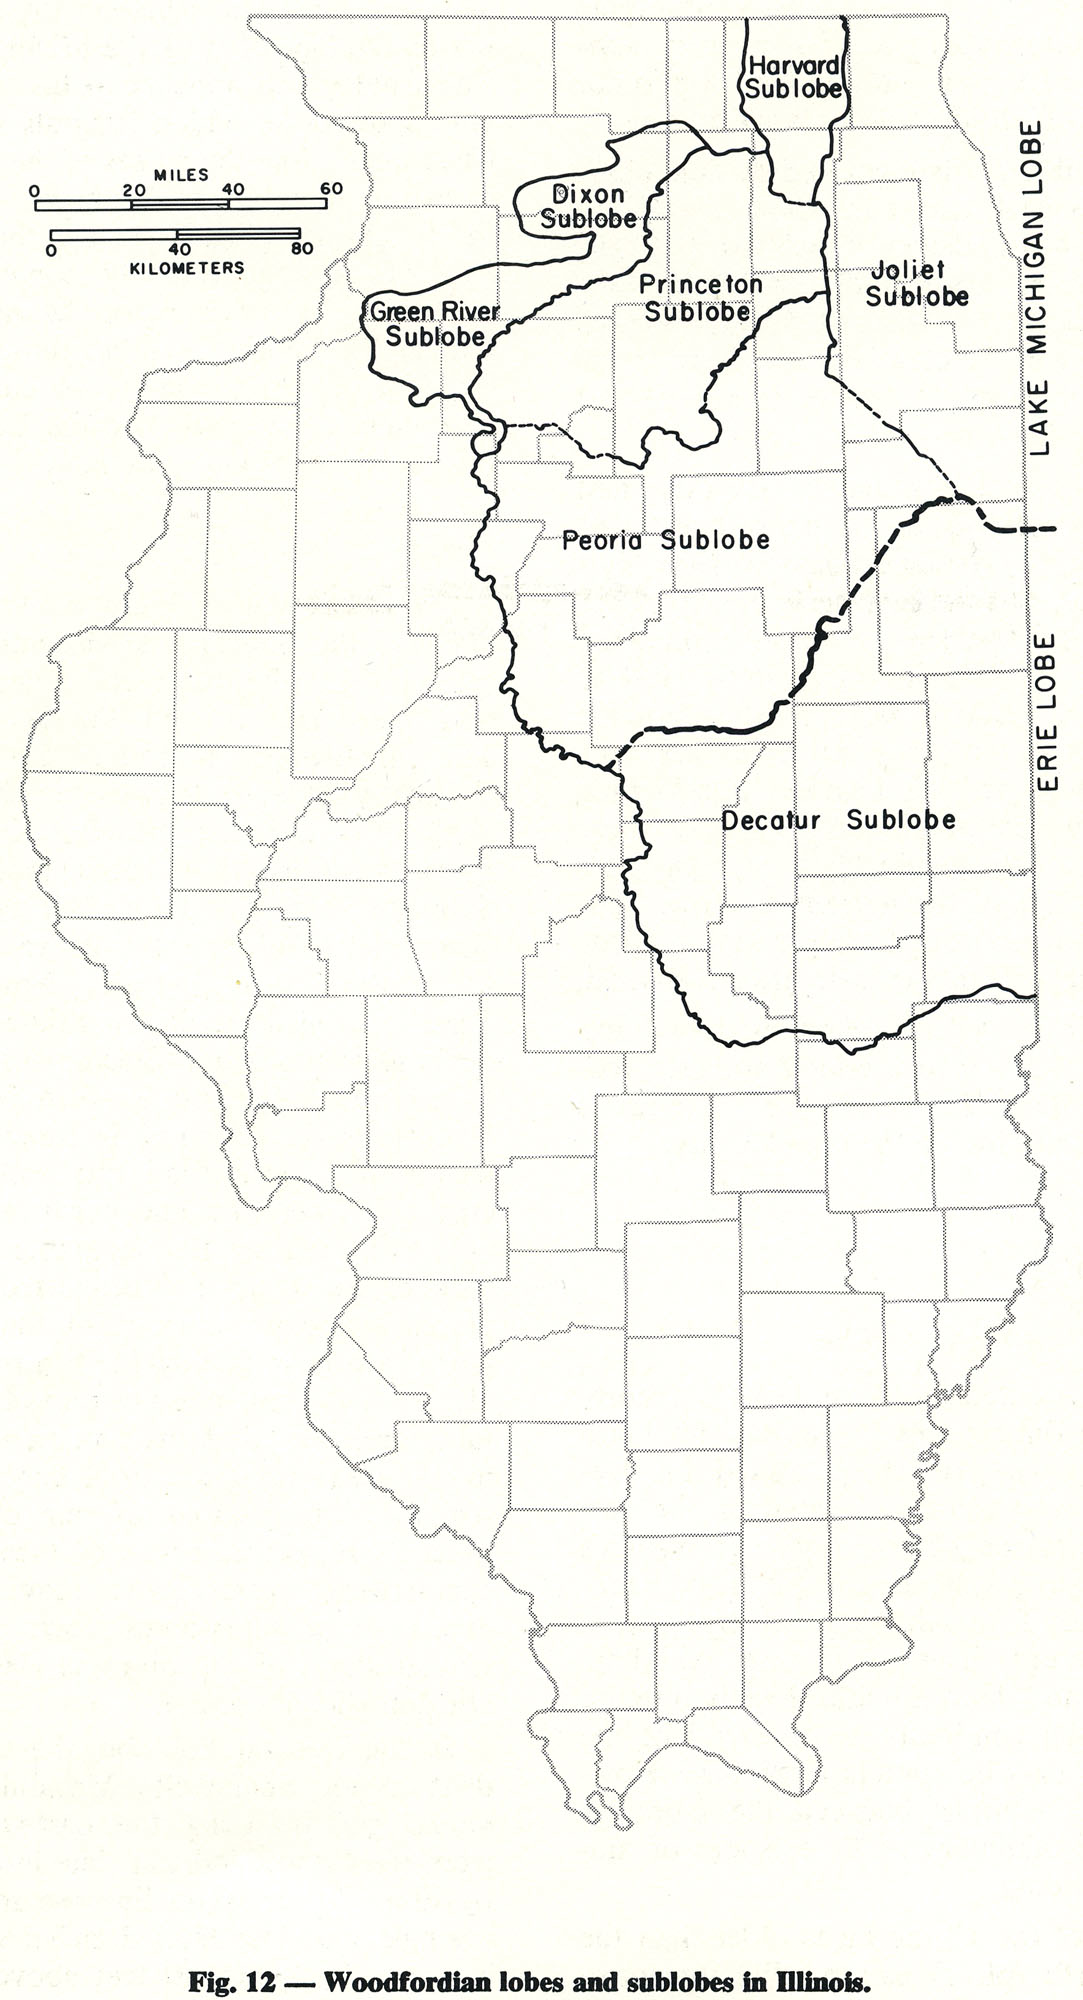
290 KB | Fig. 12 -- Woodfordian lobes and sublobes in Illinois. | 1 |
| 15:47, 19 April 2016 | 104-Figure 1 2.jpg (file) |  |
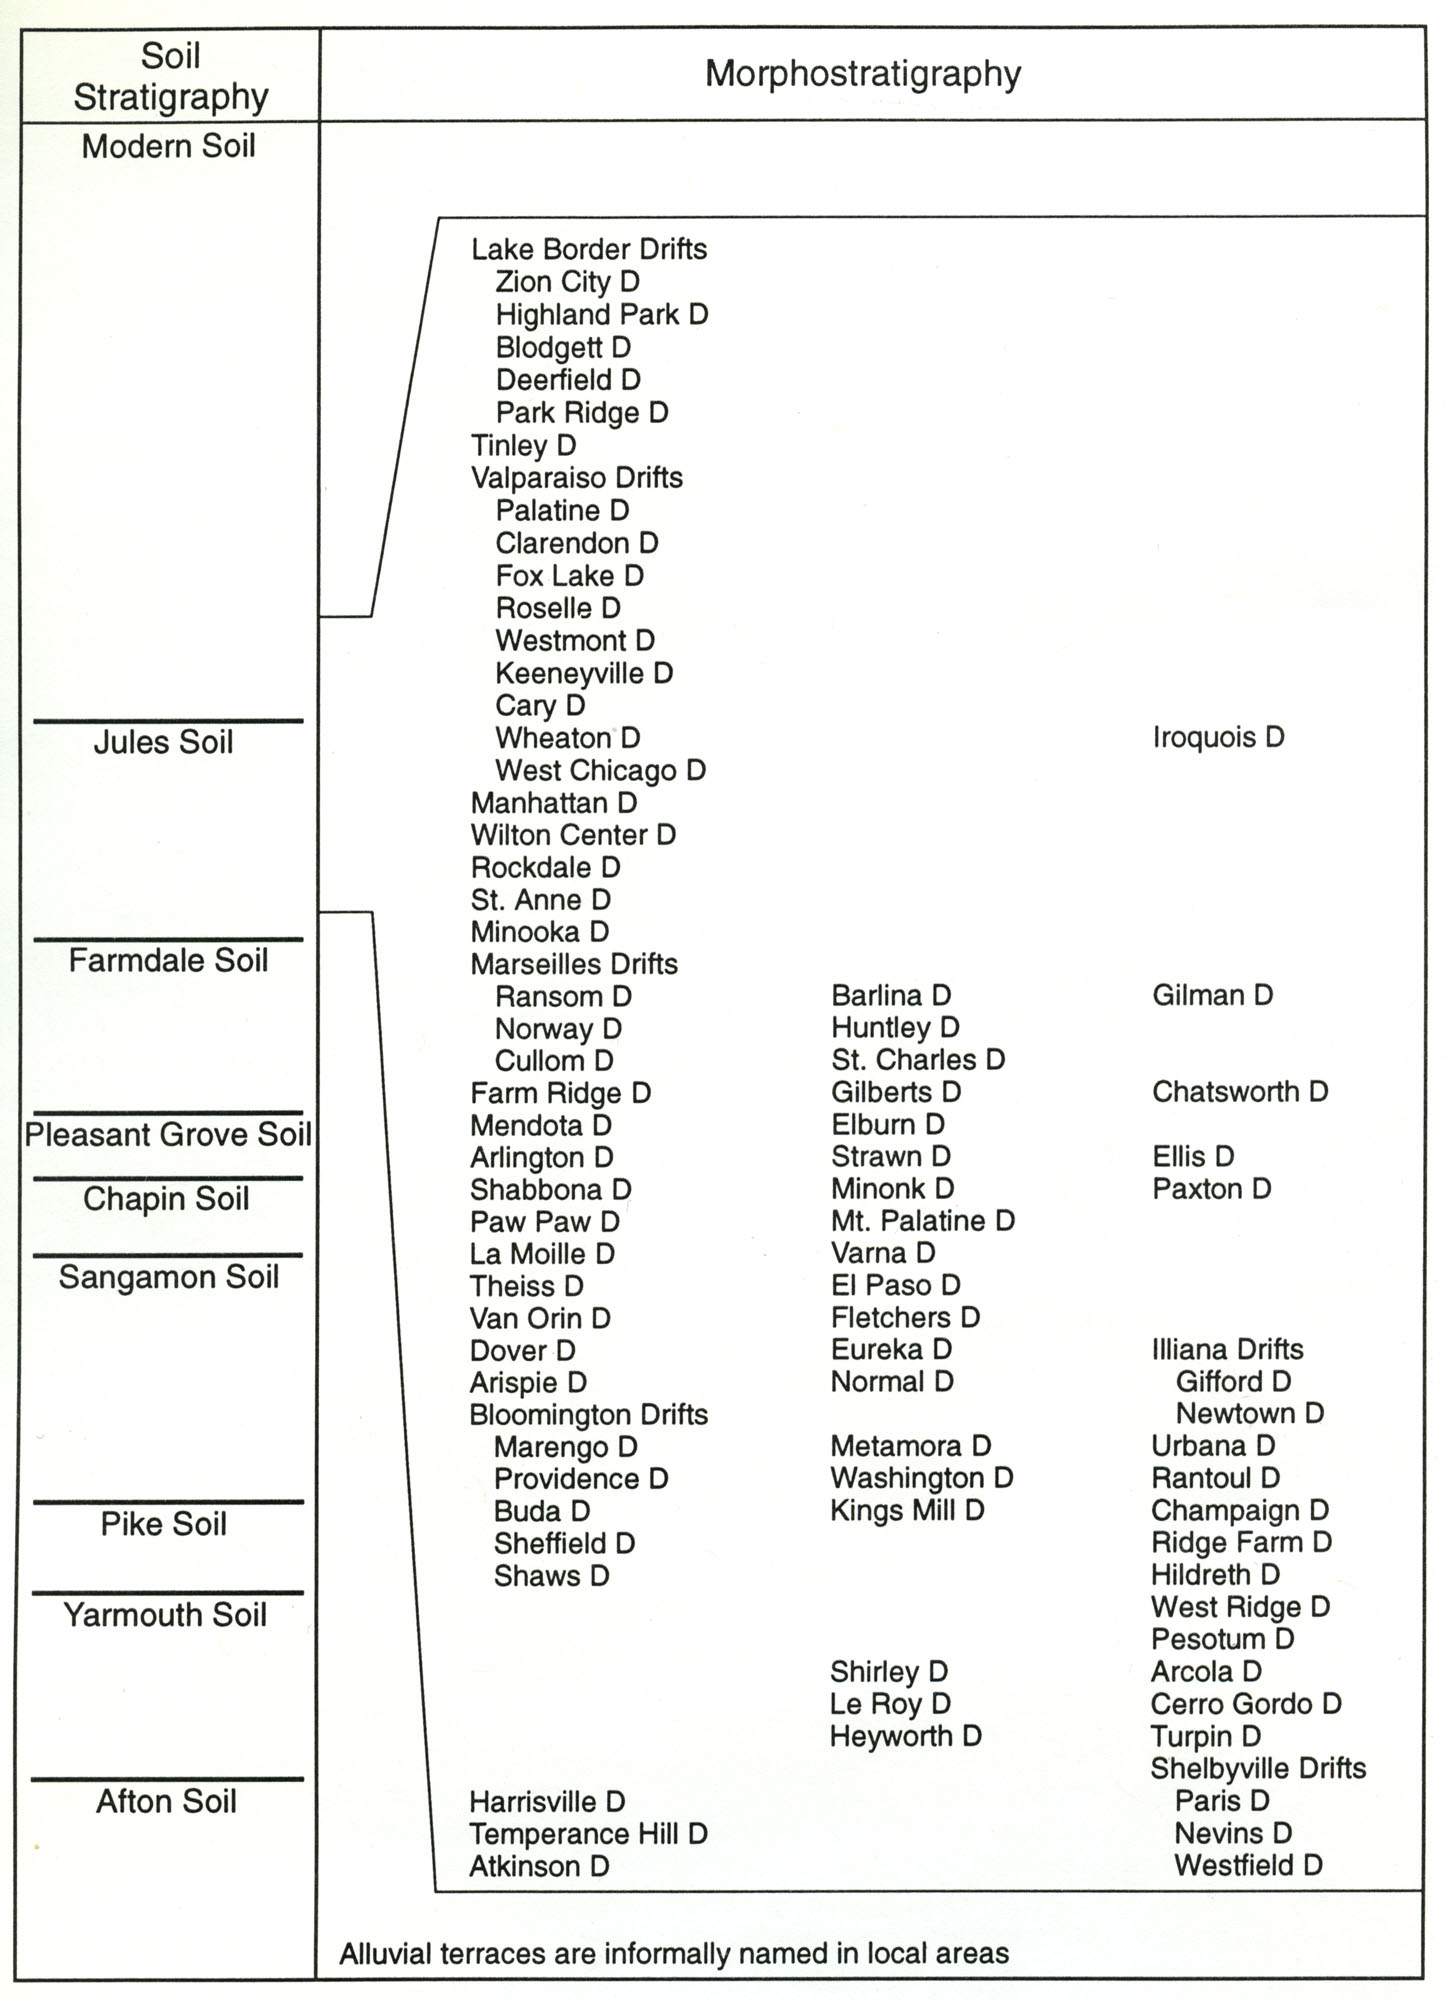
307 KB | Soil Stratigraphy | 1 |
| 16:41, 18 April 2016 | 94-fig 11.jpg (file) |  |
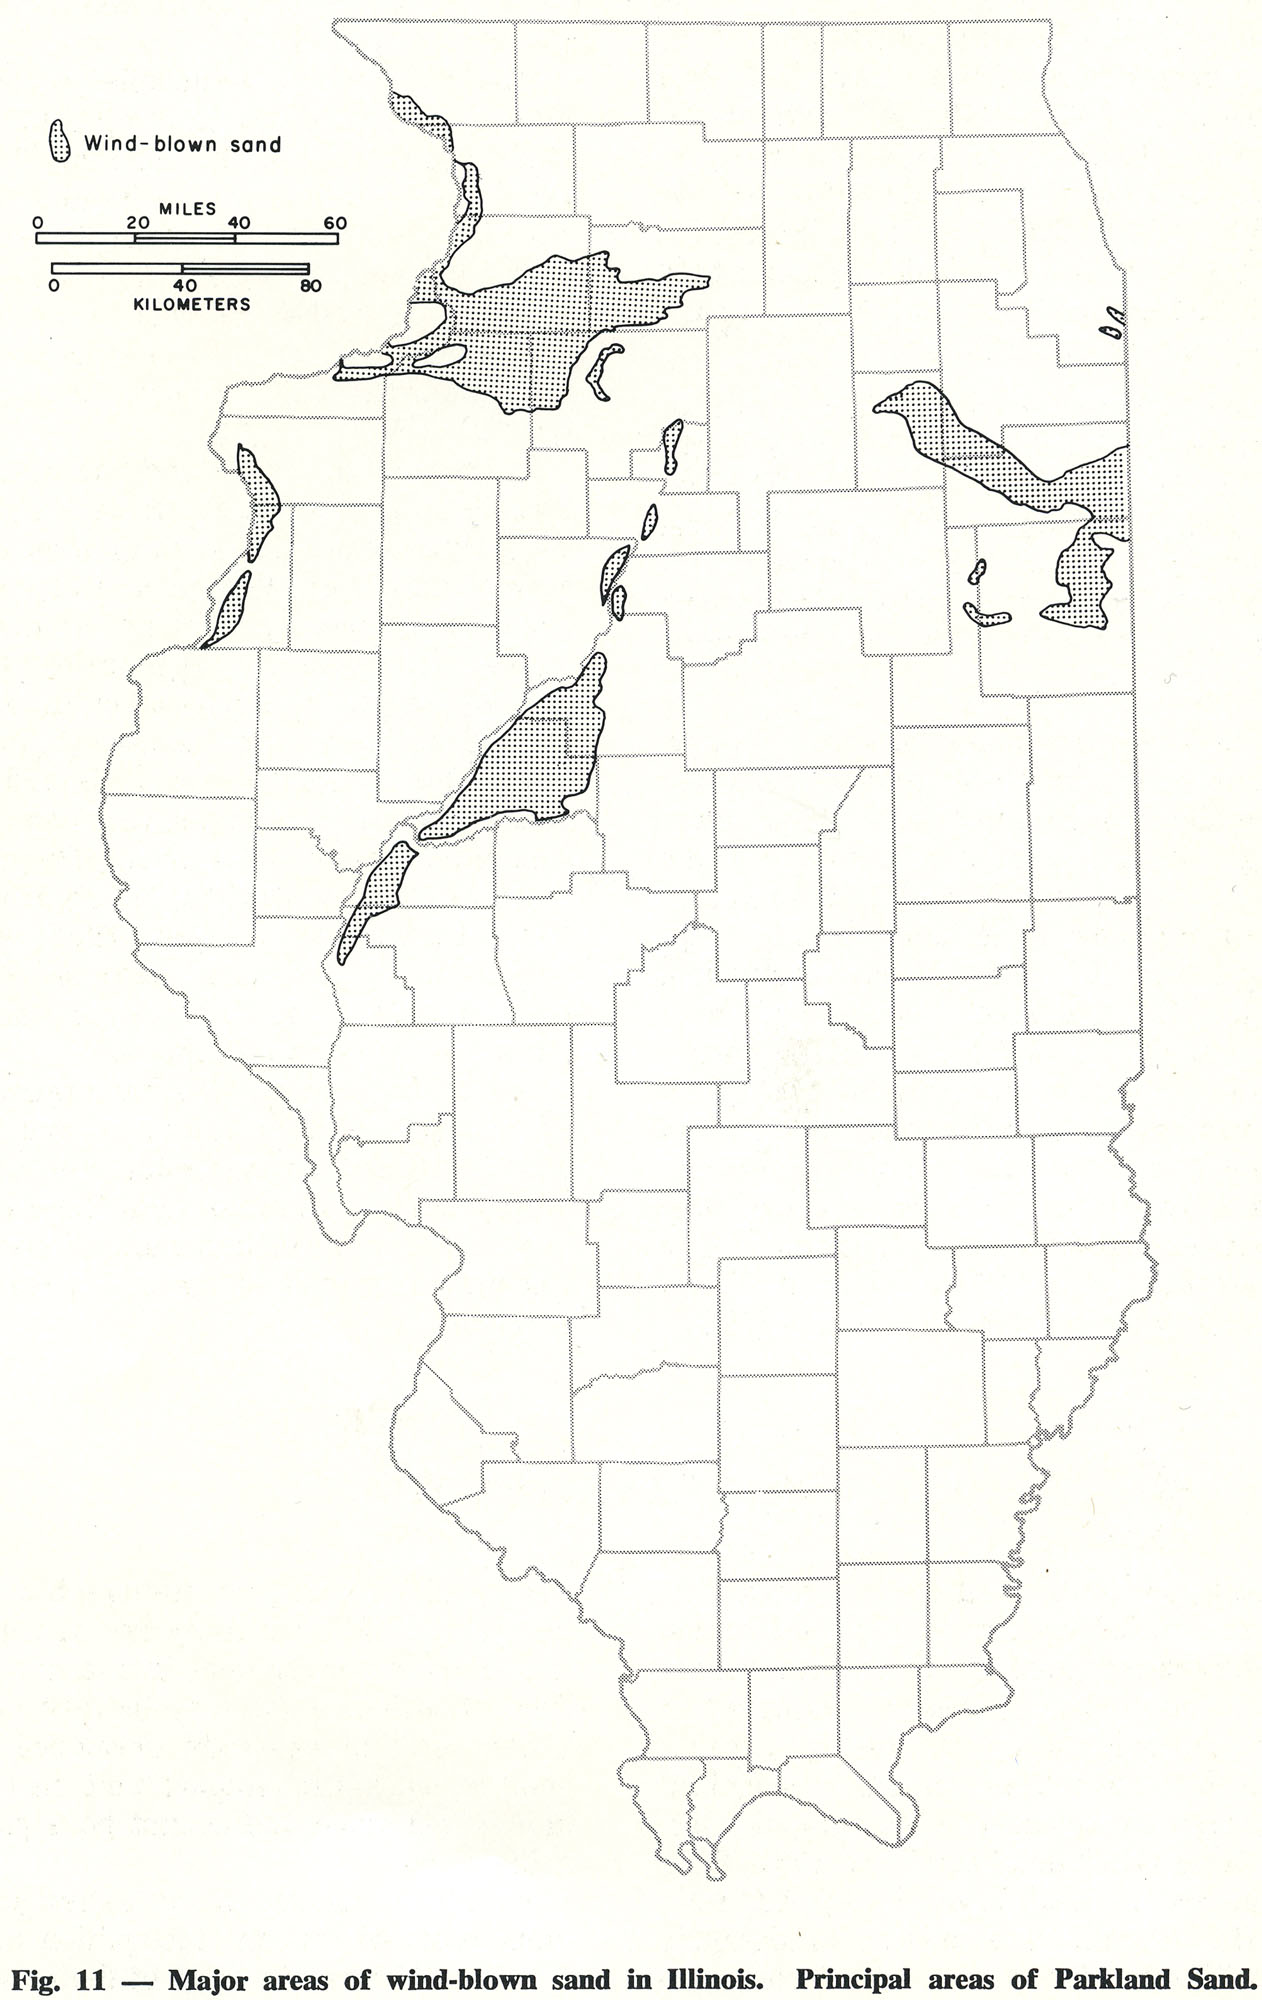
309 KB | Fig. 11 -- Major areas of wind-blown sand in Illinois. Principal areas of Parkland Sand. | 1 |
| 16:42, 19 April 2016 | 104-Figure 13b.jpg (file) |  |
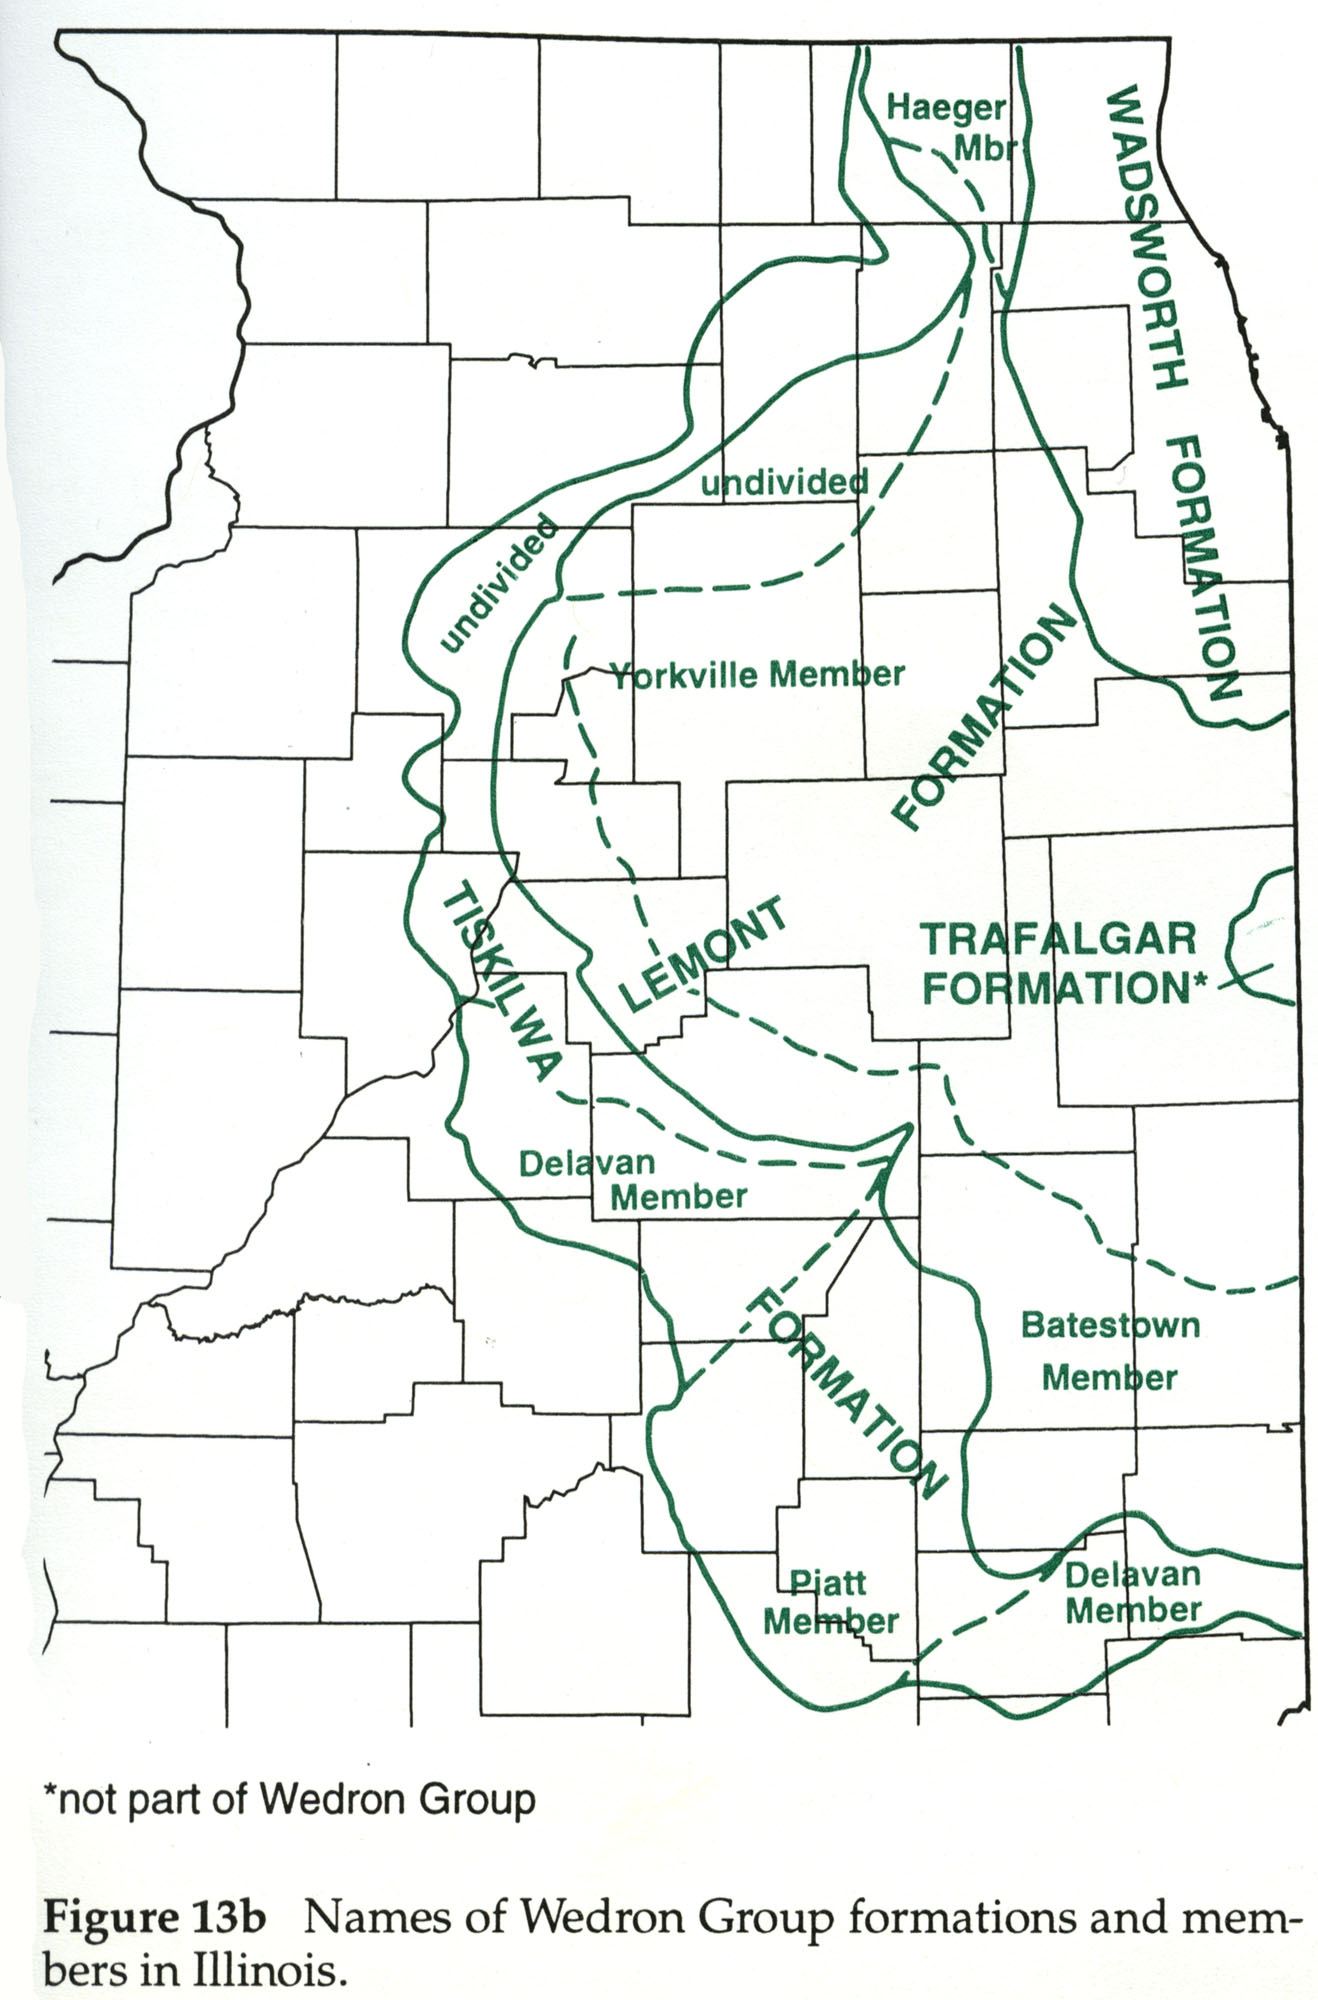
309 KB | Figure 13b -- Names of Wedron Group formations and members in Illinois. | 1 |
| 15:42, 1 April 2016 | Figure P-16.jpg (file) |  |
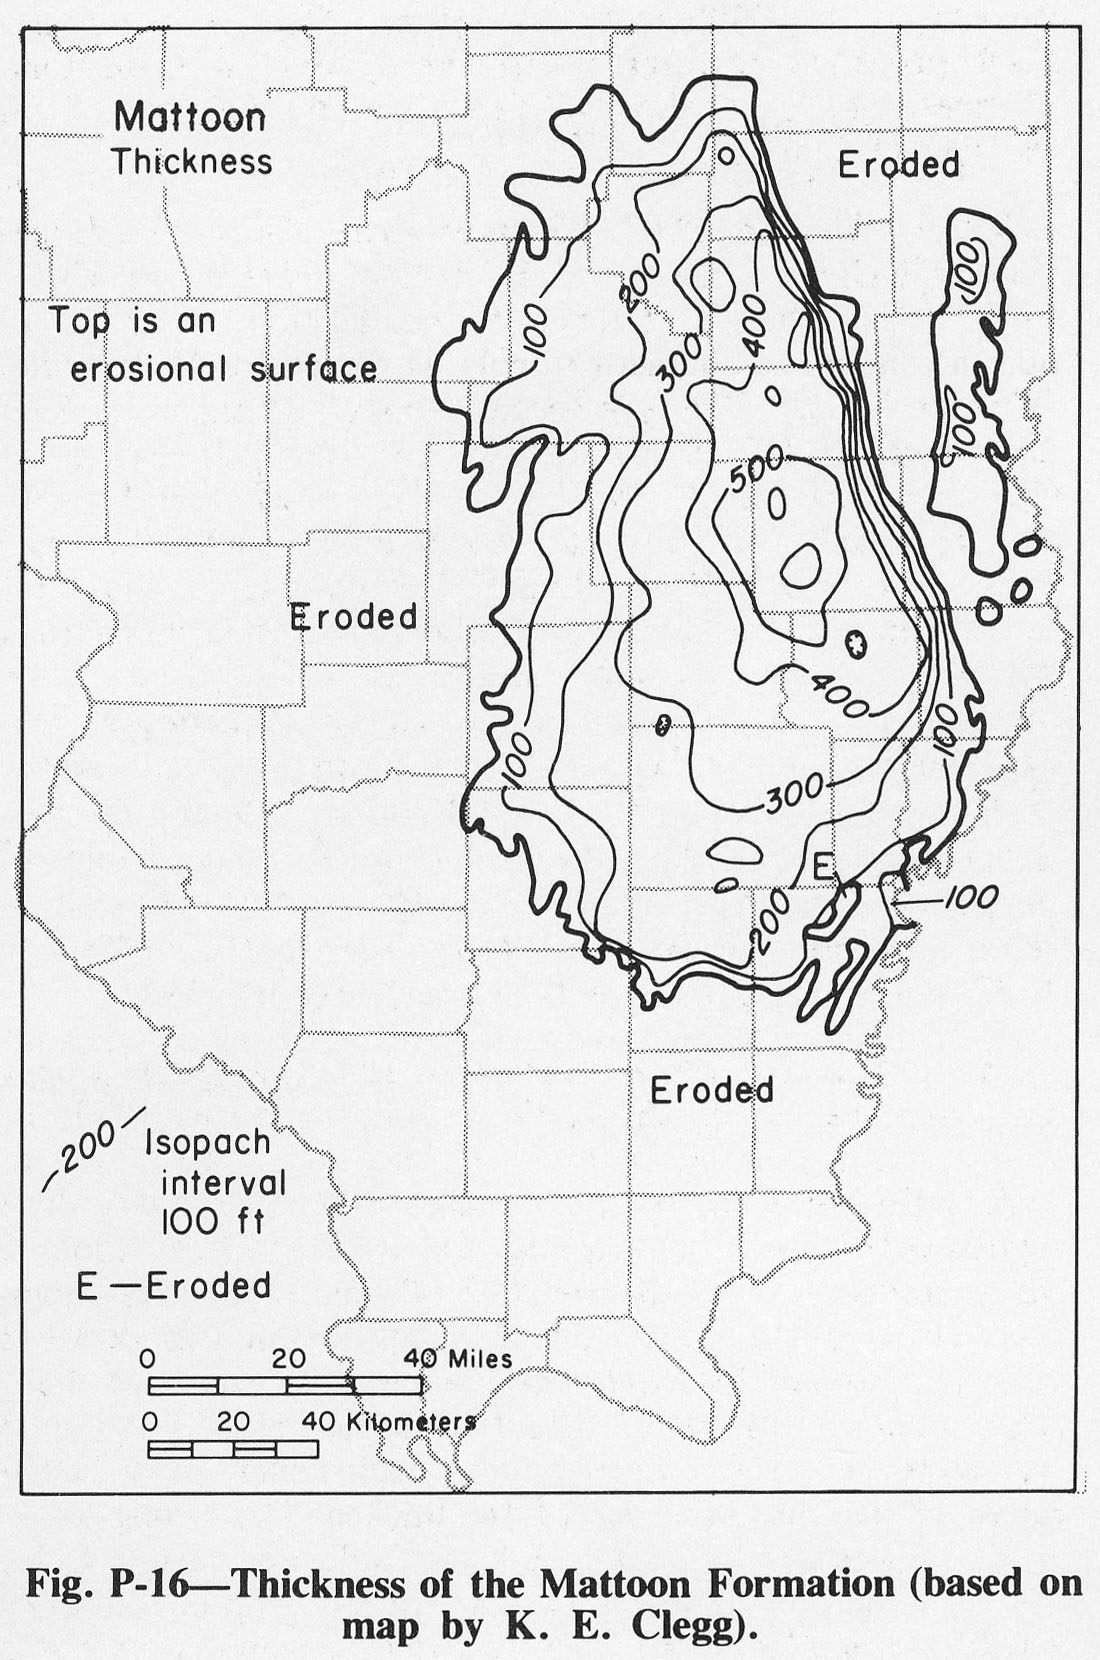
320 KB | Fig. P-16 -- Thickness of the Mattoon Formation (based on map by K. E. Clegg). | 1 |
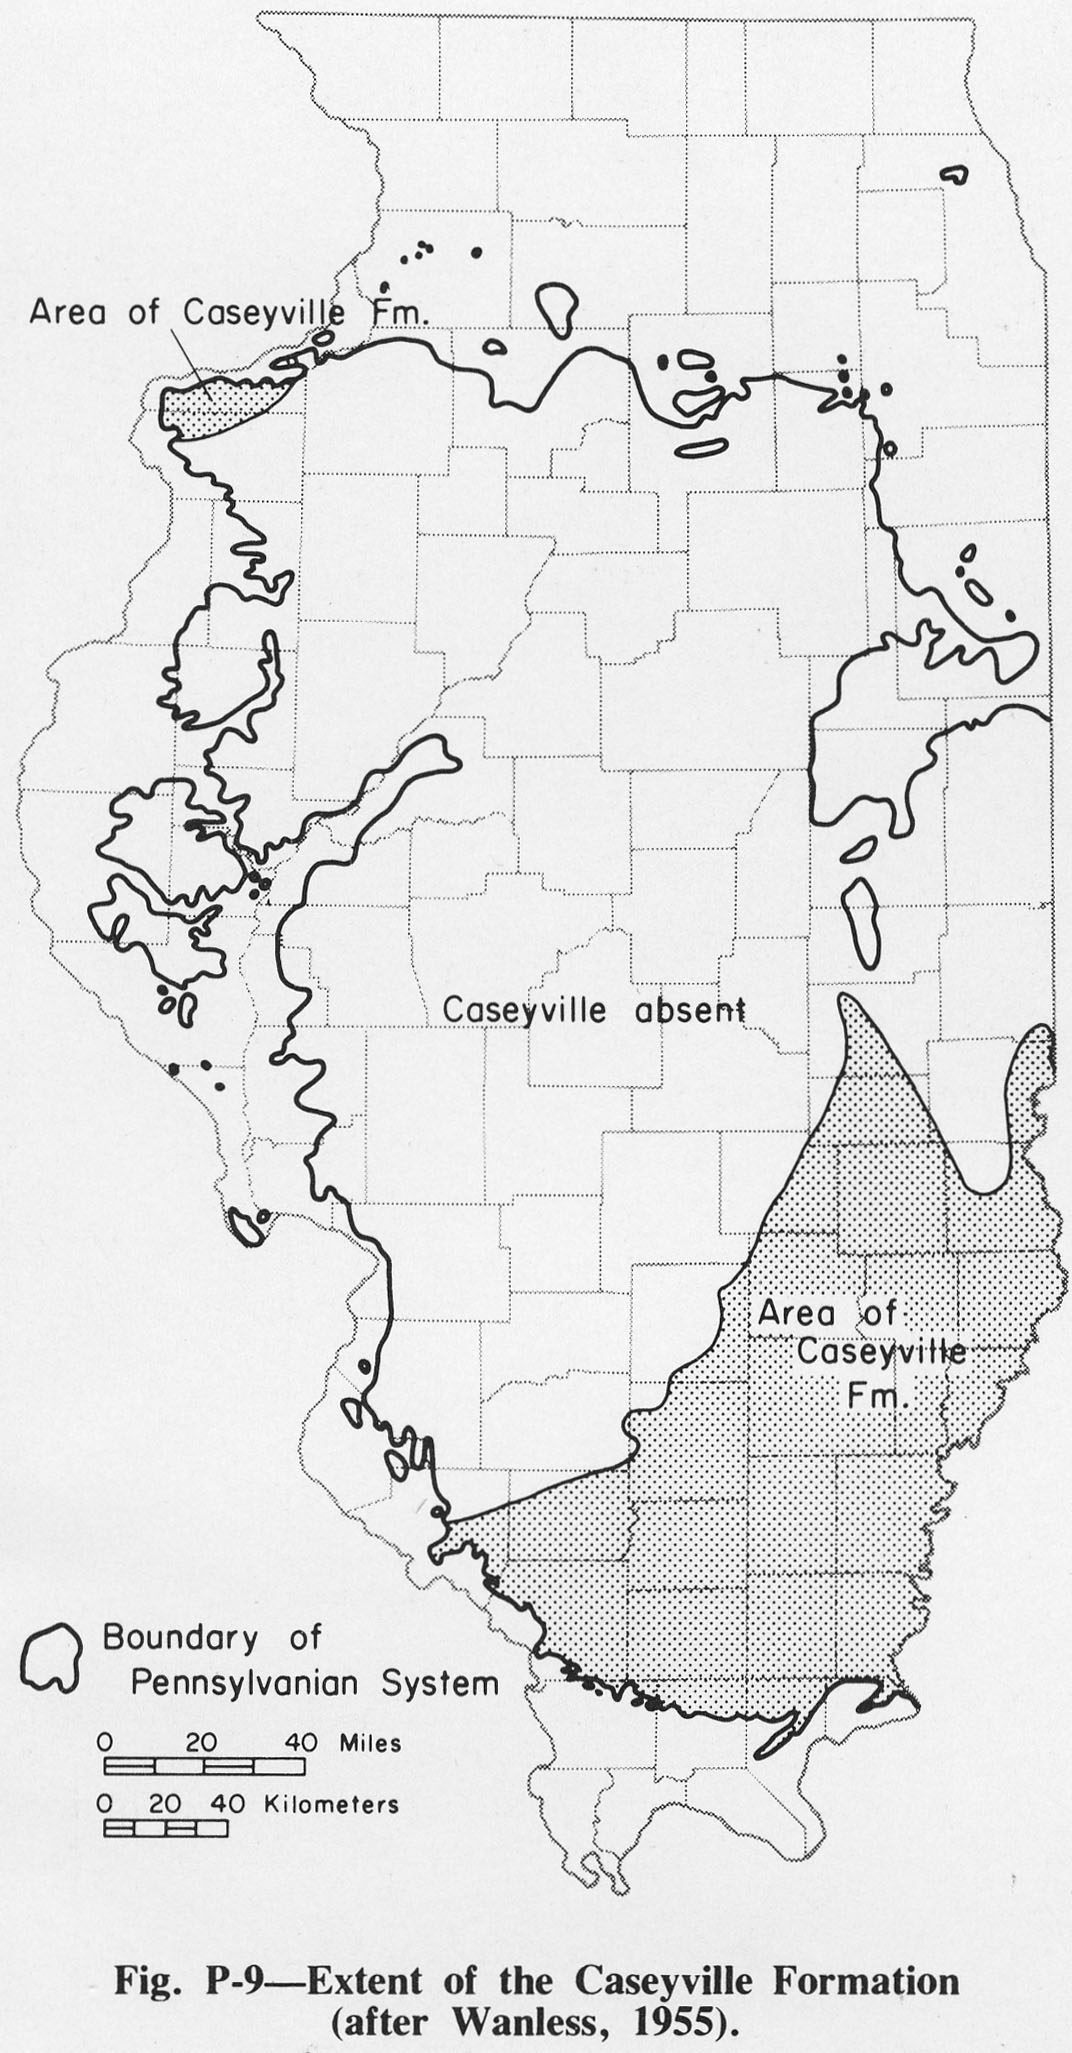
| 14:55, 1 April 2016 | Figure P-9.jpg (file) |  |
334 KB | Fig. P-4 -- Extent of the Caseyville Formation (after Wanless, 1955). | 1 |
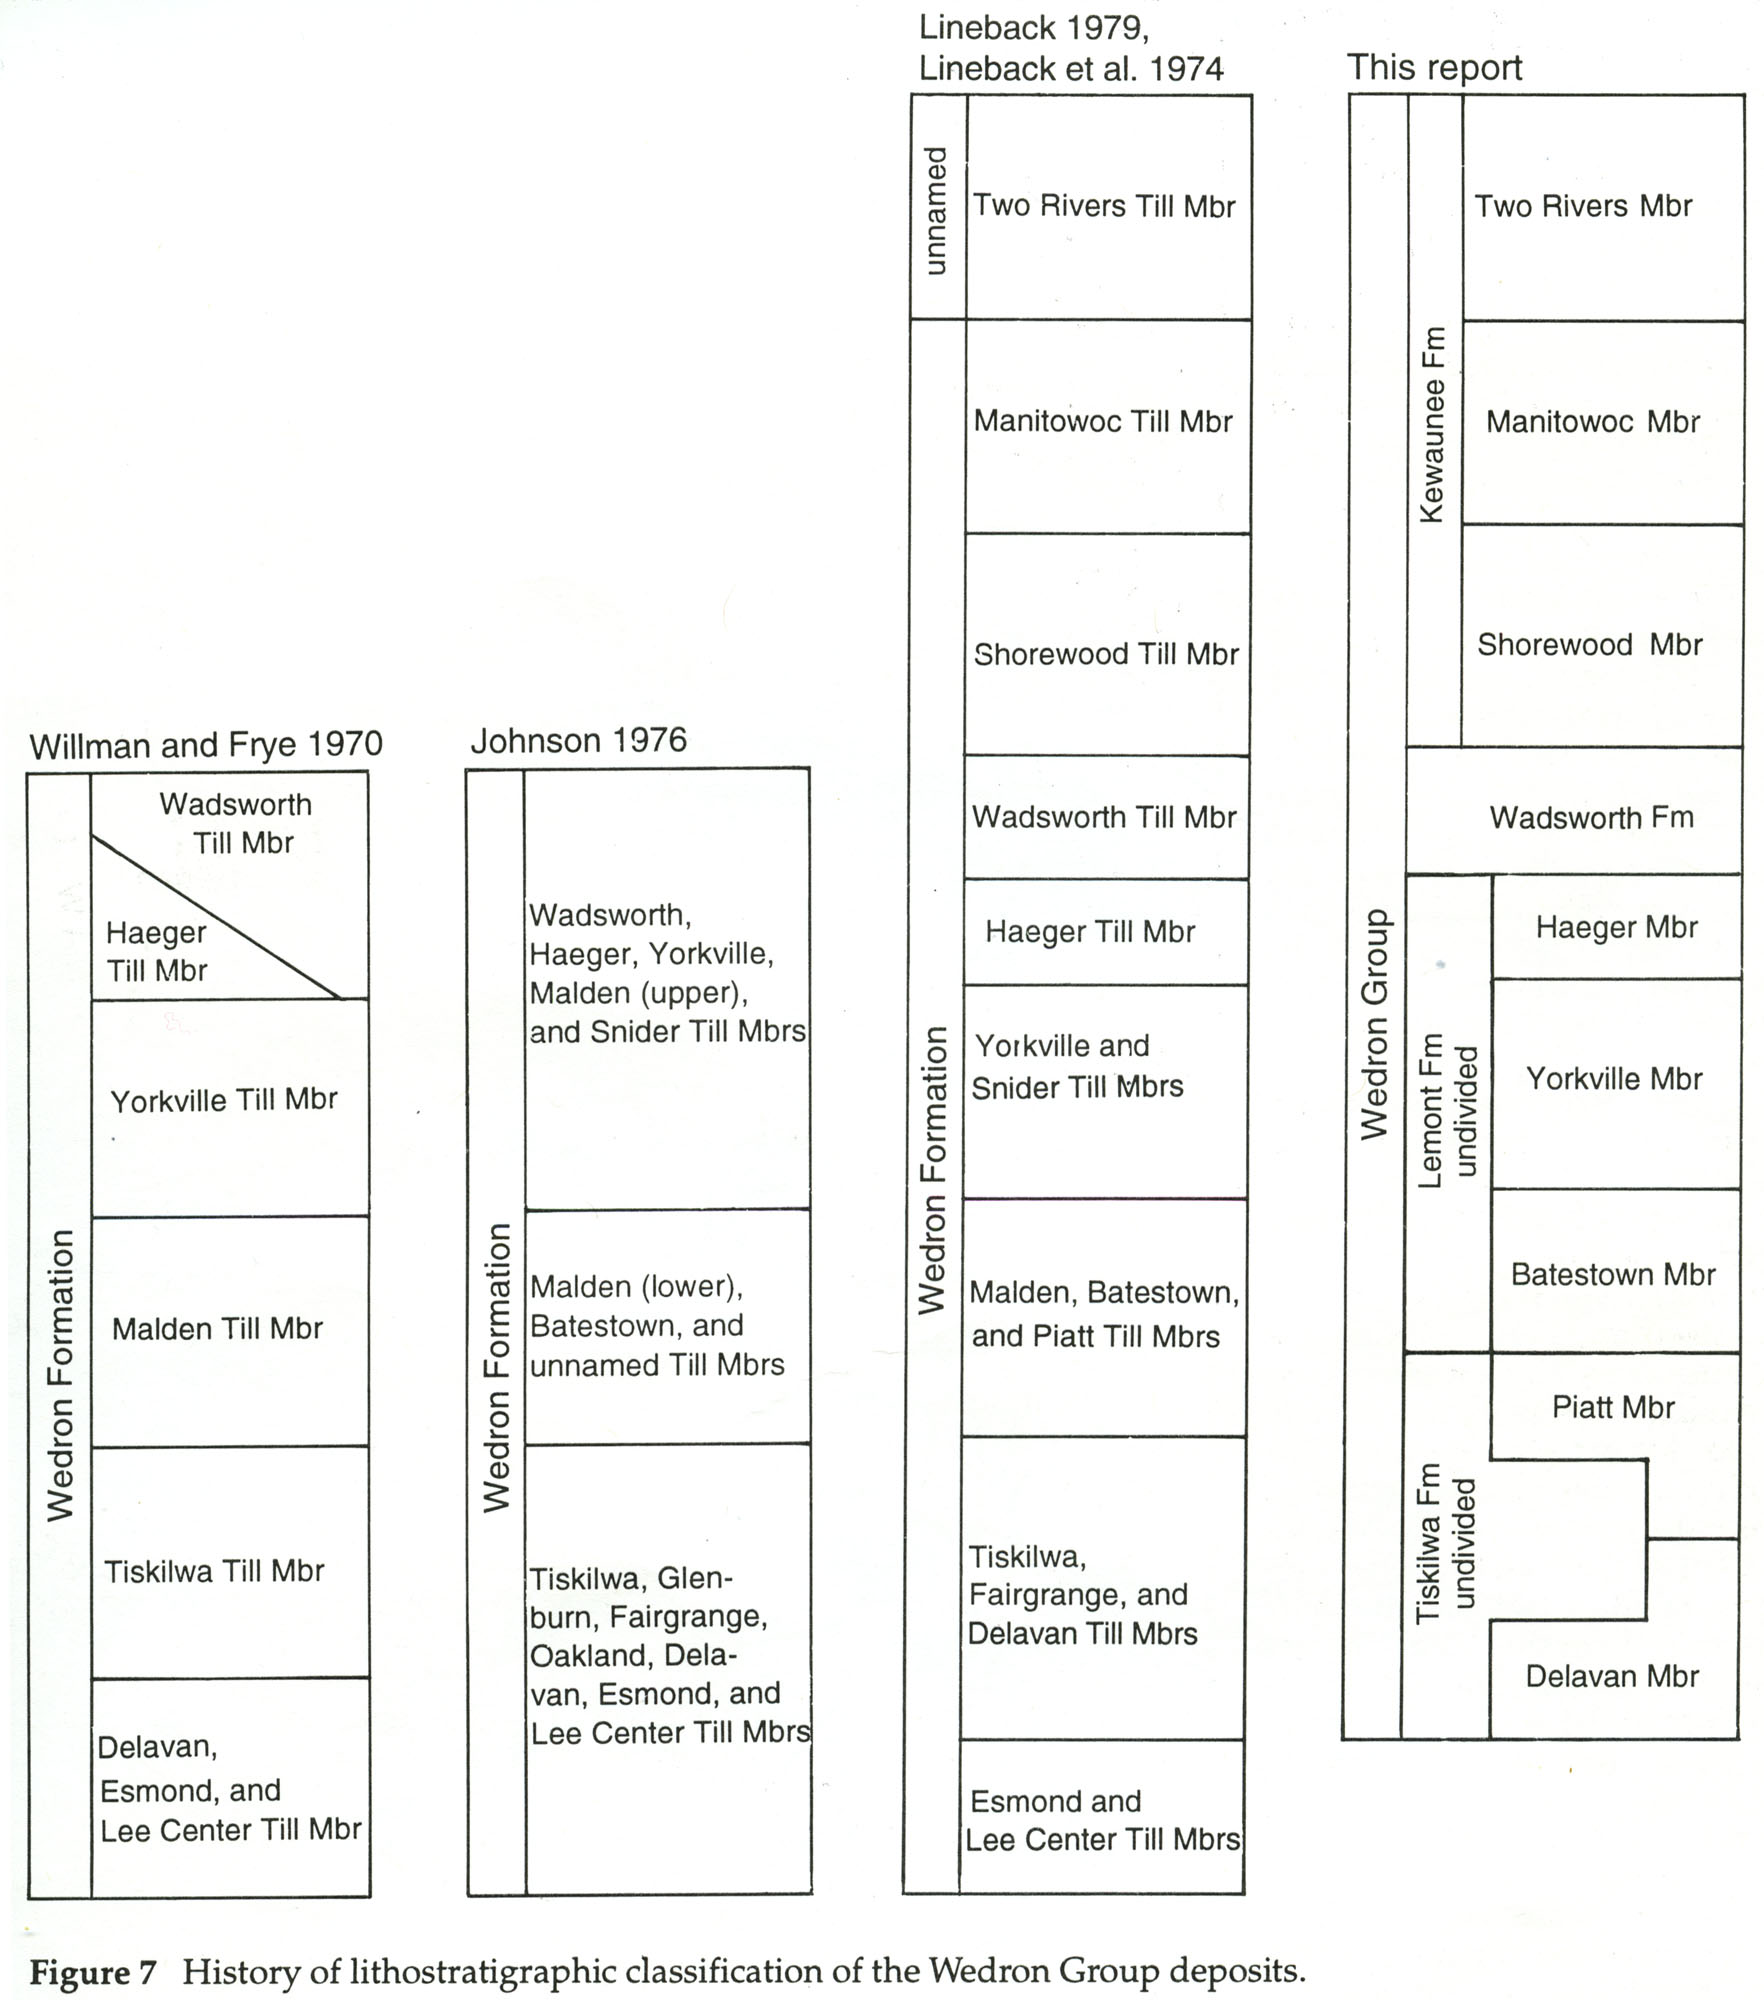
| 16:21, 19 April 2016 | 104-Figure 7.jpg (file) |  |
336 KB | Figure 7 -- History of lithostratigraphic classification of the Wedron Group deposits. | 1 |
| 16:24, 19 April 2016 | 104-Figure 9.jpg (file) |  |
345 KB | Figure 9 -- History of the litho-stratigraphic classification of the Mason Group deposits with respect to the Wedron Group deposits: (a) Peoria and Roxana Silts, (b) Henry Formation, and (c) Equality Formation. Vertical lines indicate part of section m... | 1 |
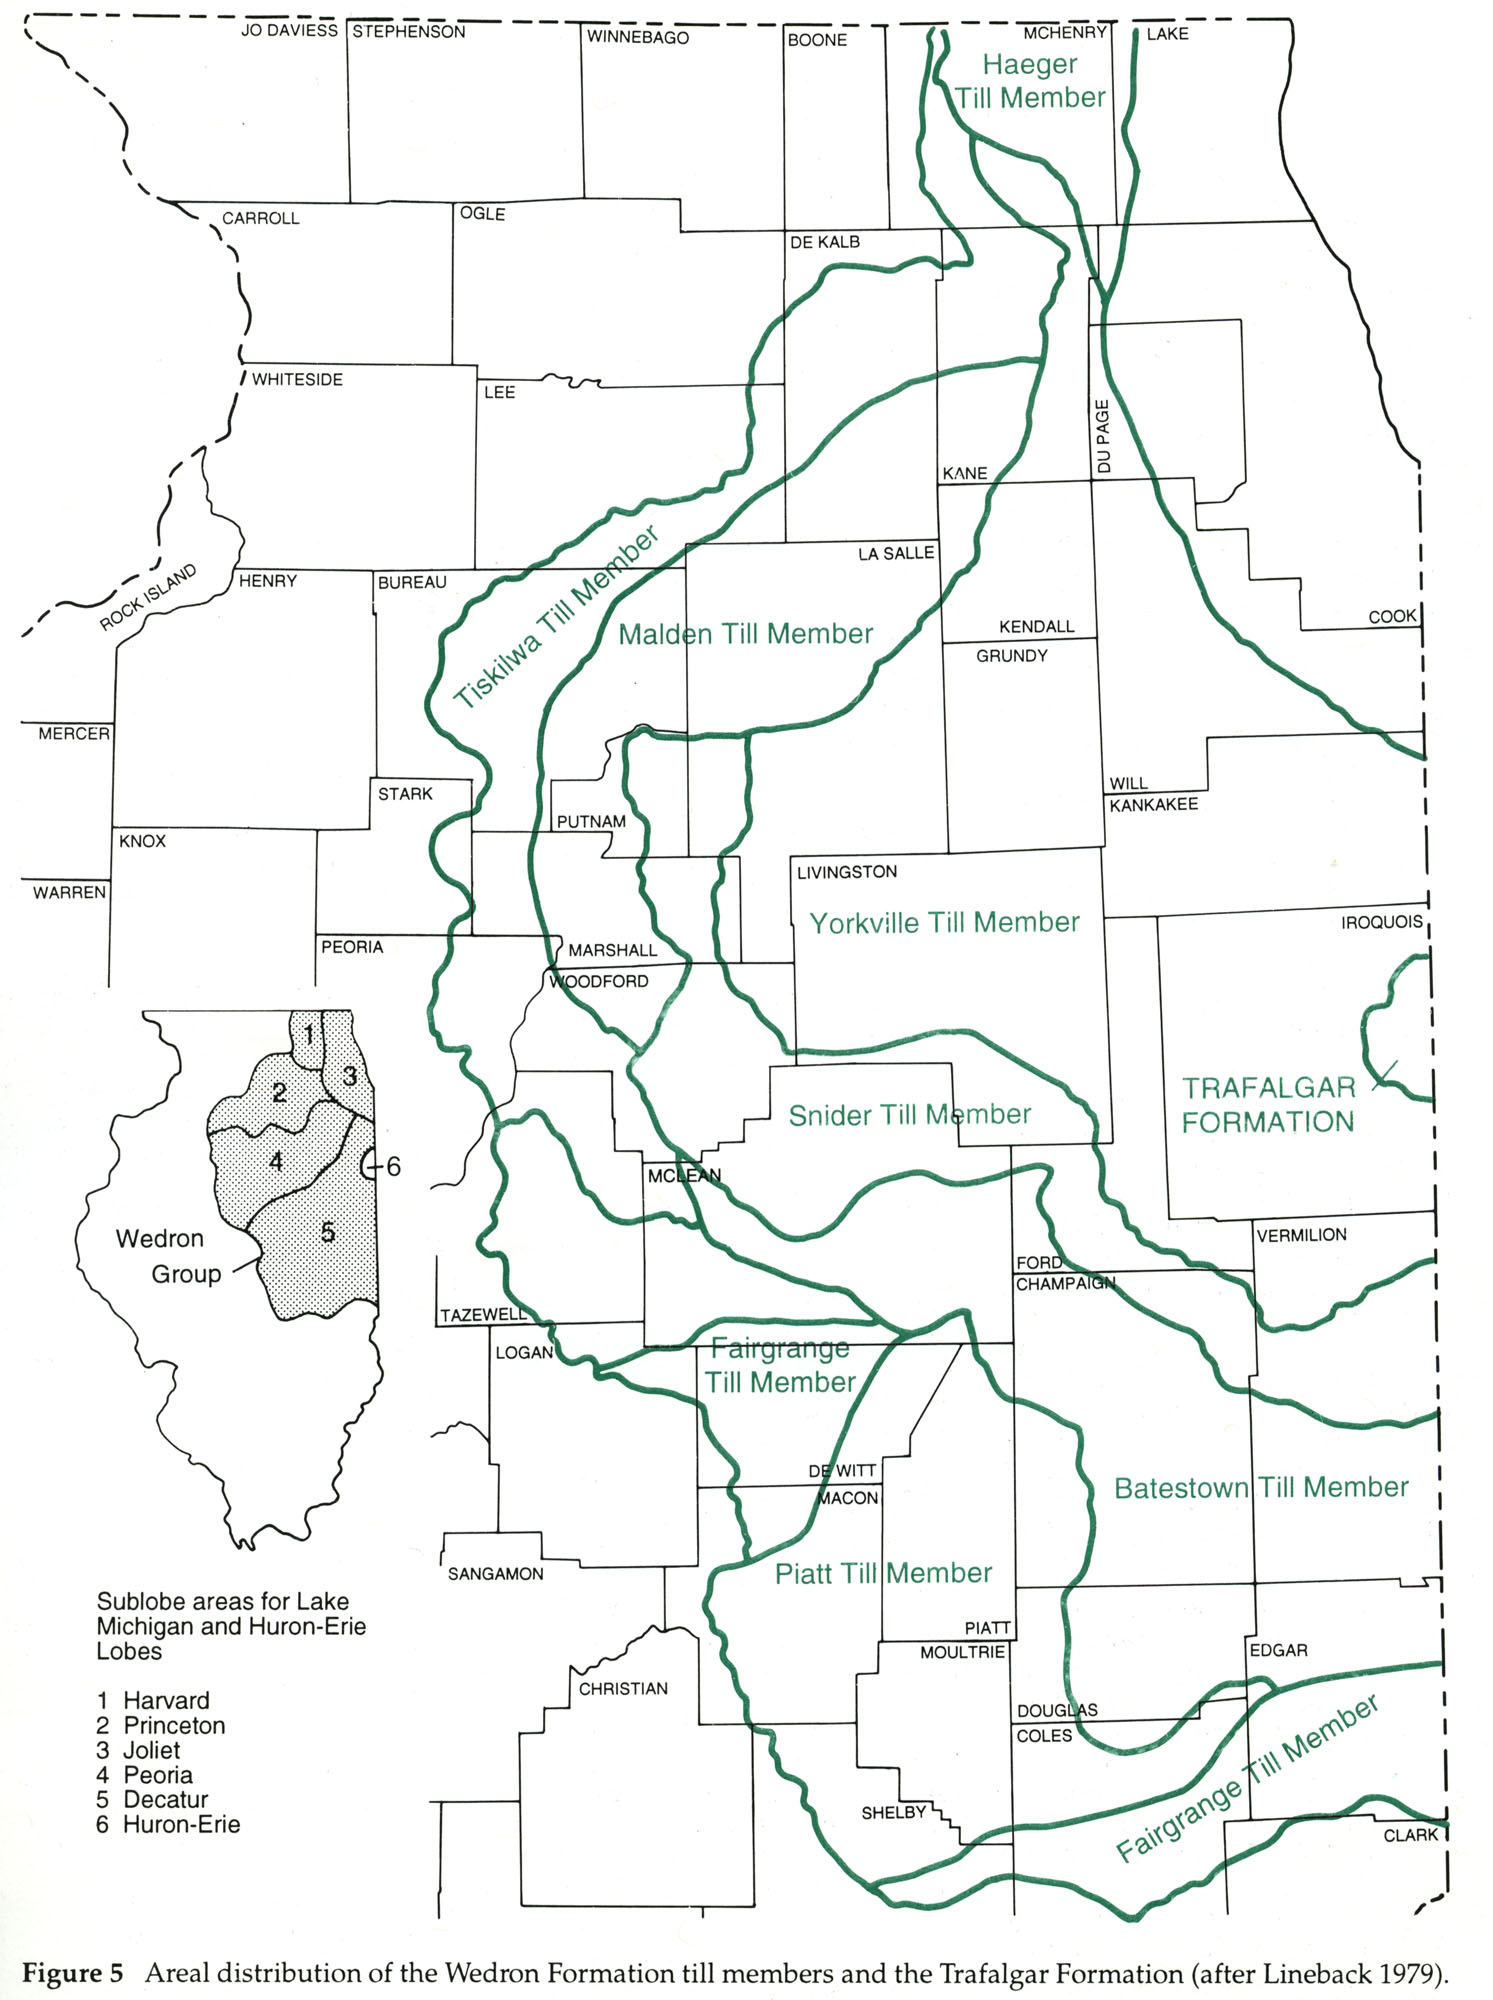
| 16:12, 19 April 2016 | 104-Figure 5.jpg (file) |  |
357 KB | Figure 5 -- Areal distribution of the Wedron Formation till members and the Trafalgar Formation )after Lineback 1979). | 1 |
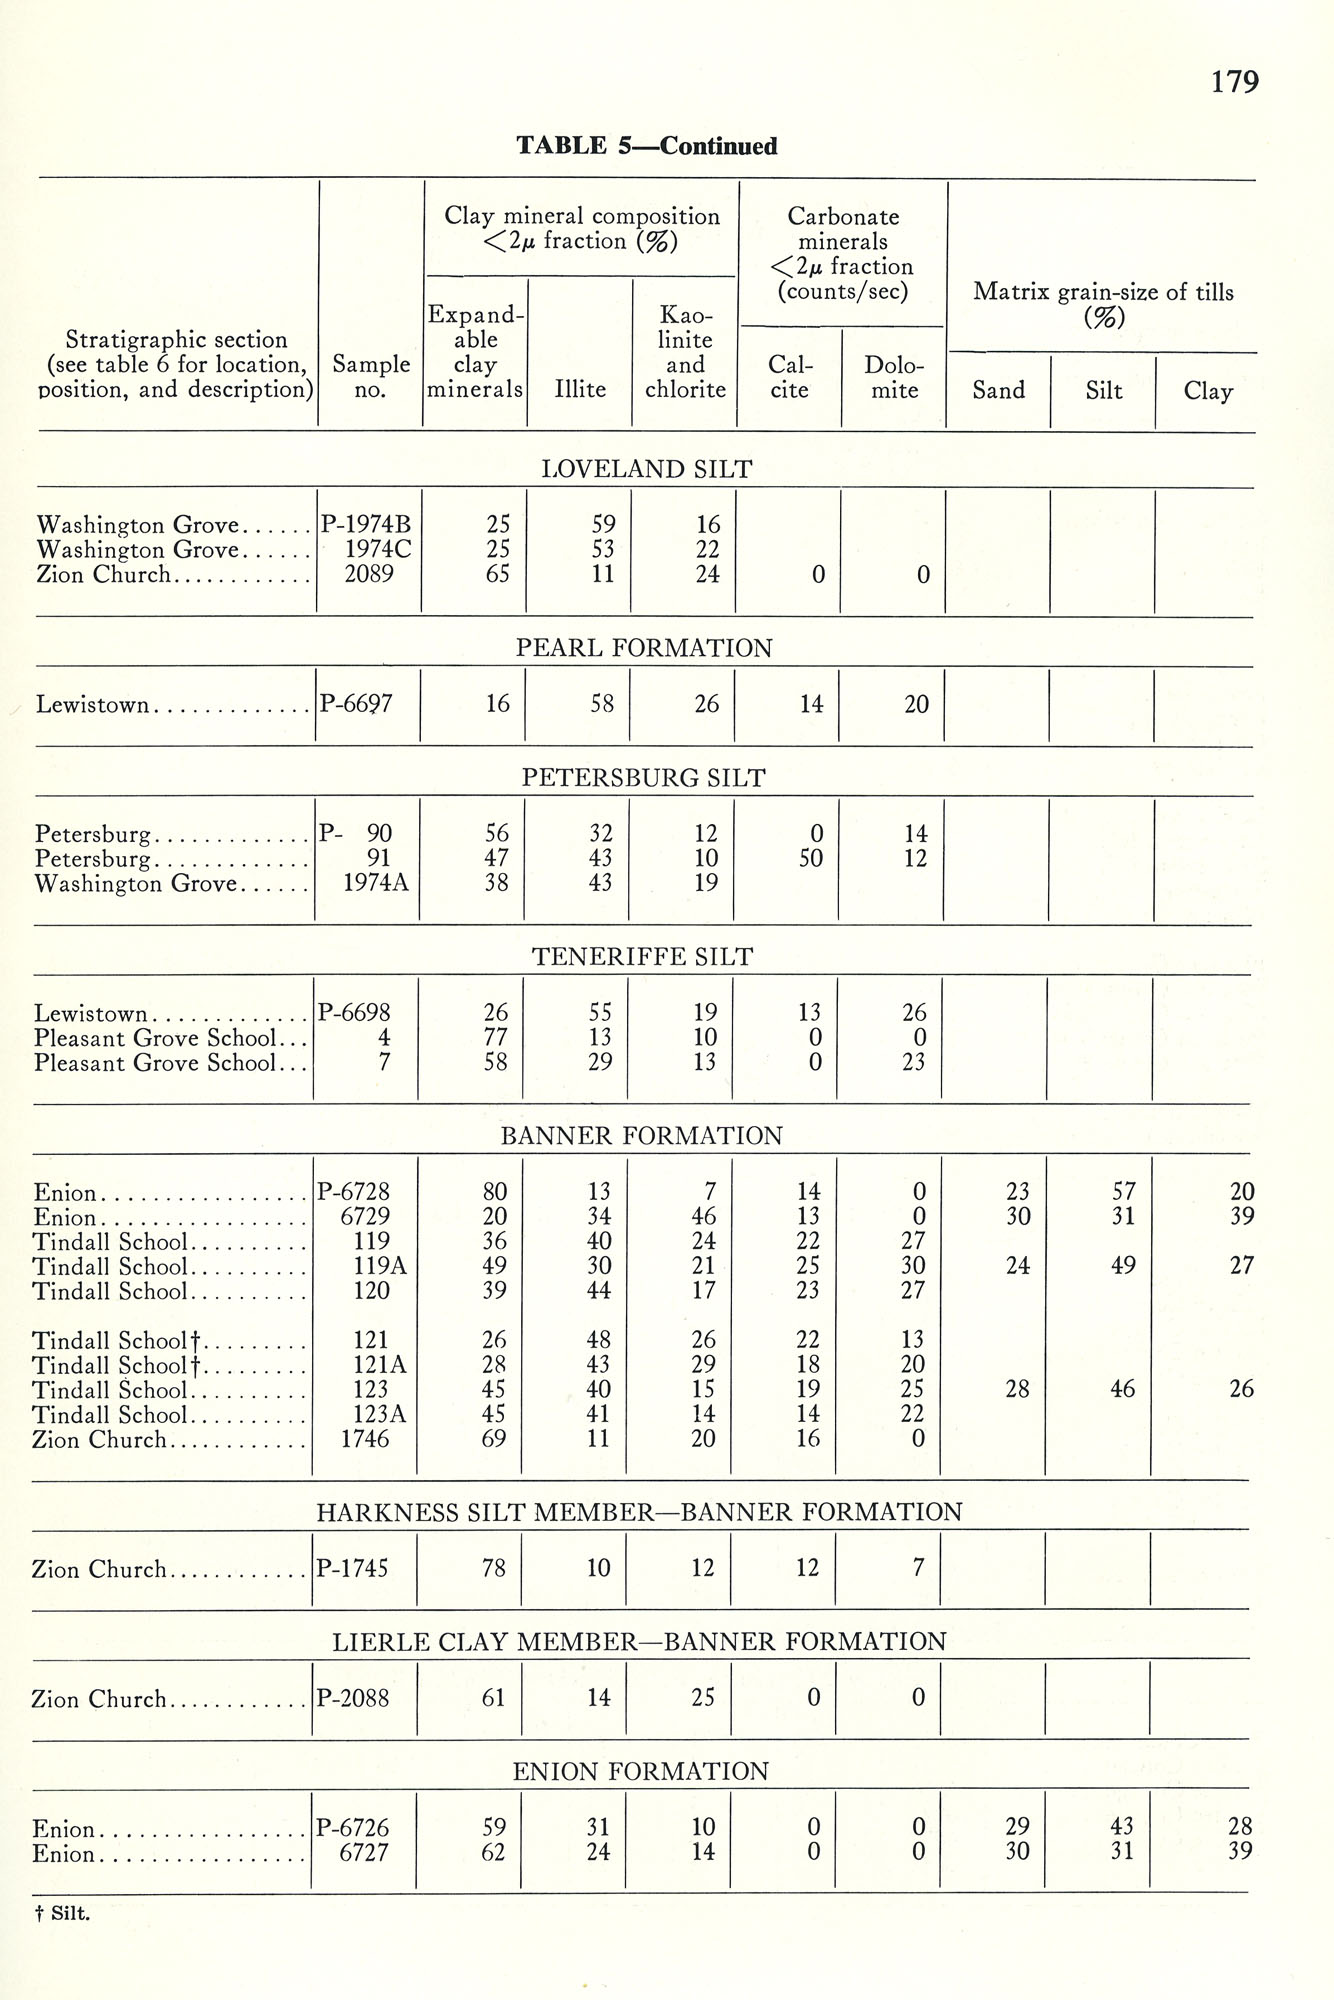
| 17:01, 18 April 2016 | 94-tb 5-.jpg (file) |  |
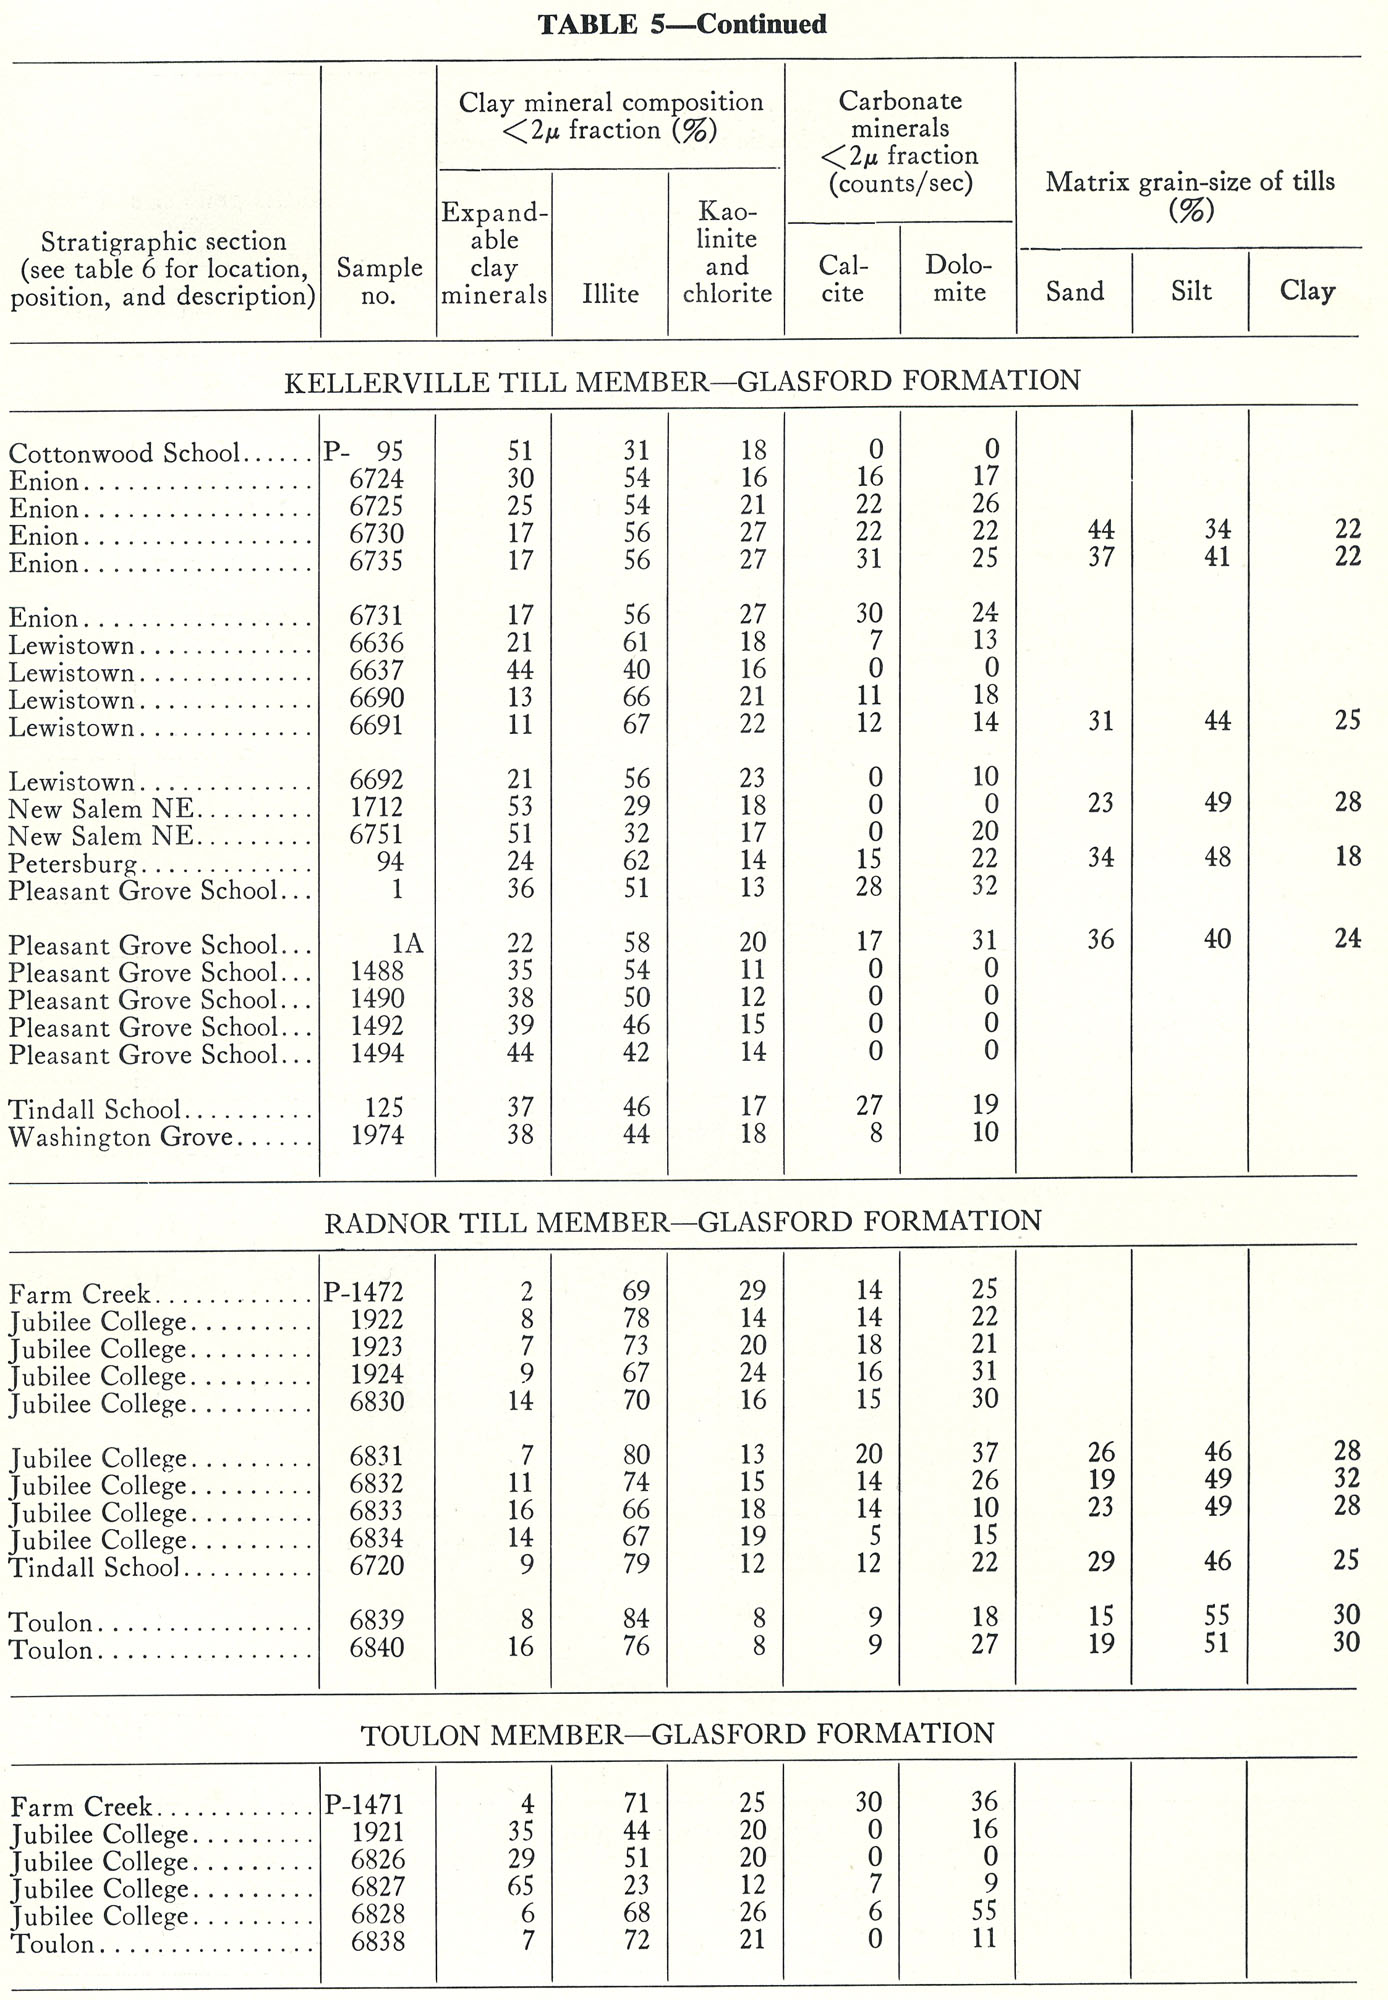
358 KB | Table 5 -- Continued. | 1 |
| 16:35, 19 April 2016 | 104-Figure 11.jpg (file) |  |
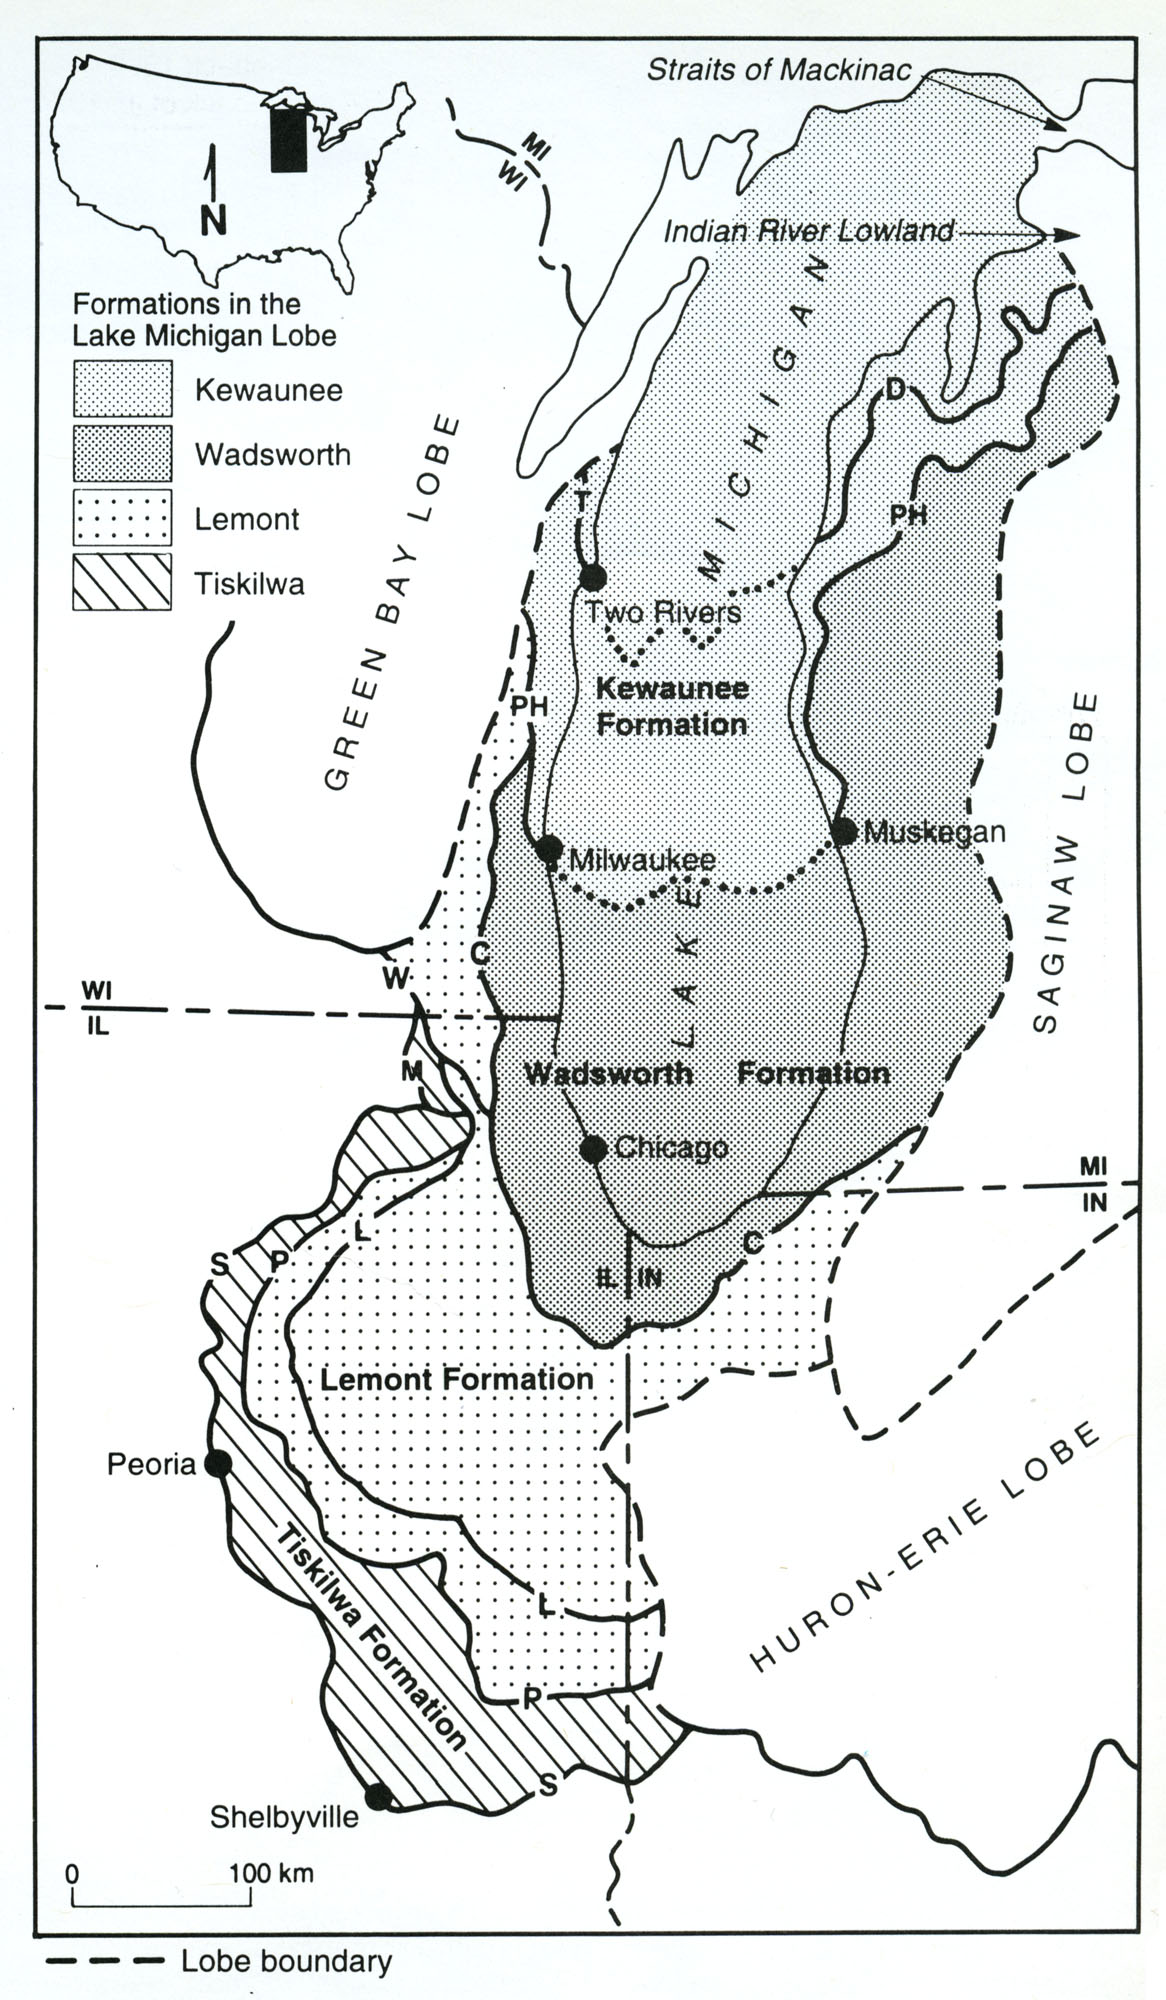
362 KB | Figure 11 Correlation of the Wedron Group formations and members in the Lake Michigan Lobe area (units in Wisconsin from Mickelson et. al. 1984, Mickelson and Syverson, in press; units in Indiana from Bleuer et al. 1983, N.K. Bleuer, Indiana Geological... | 1 |
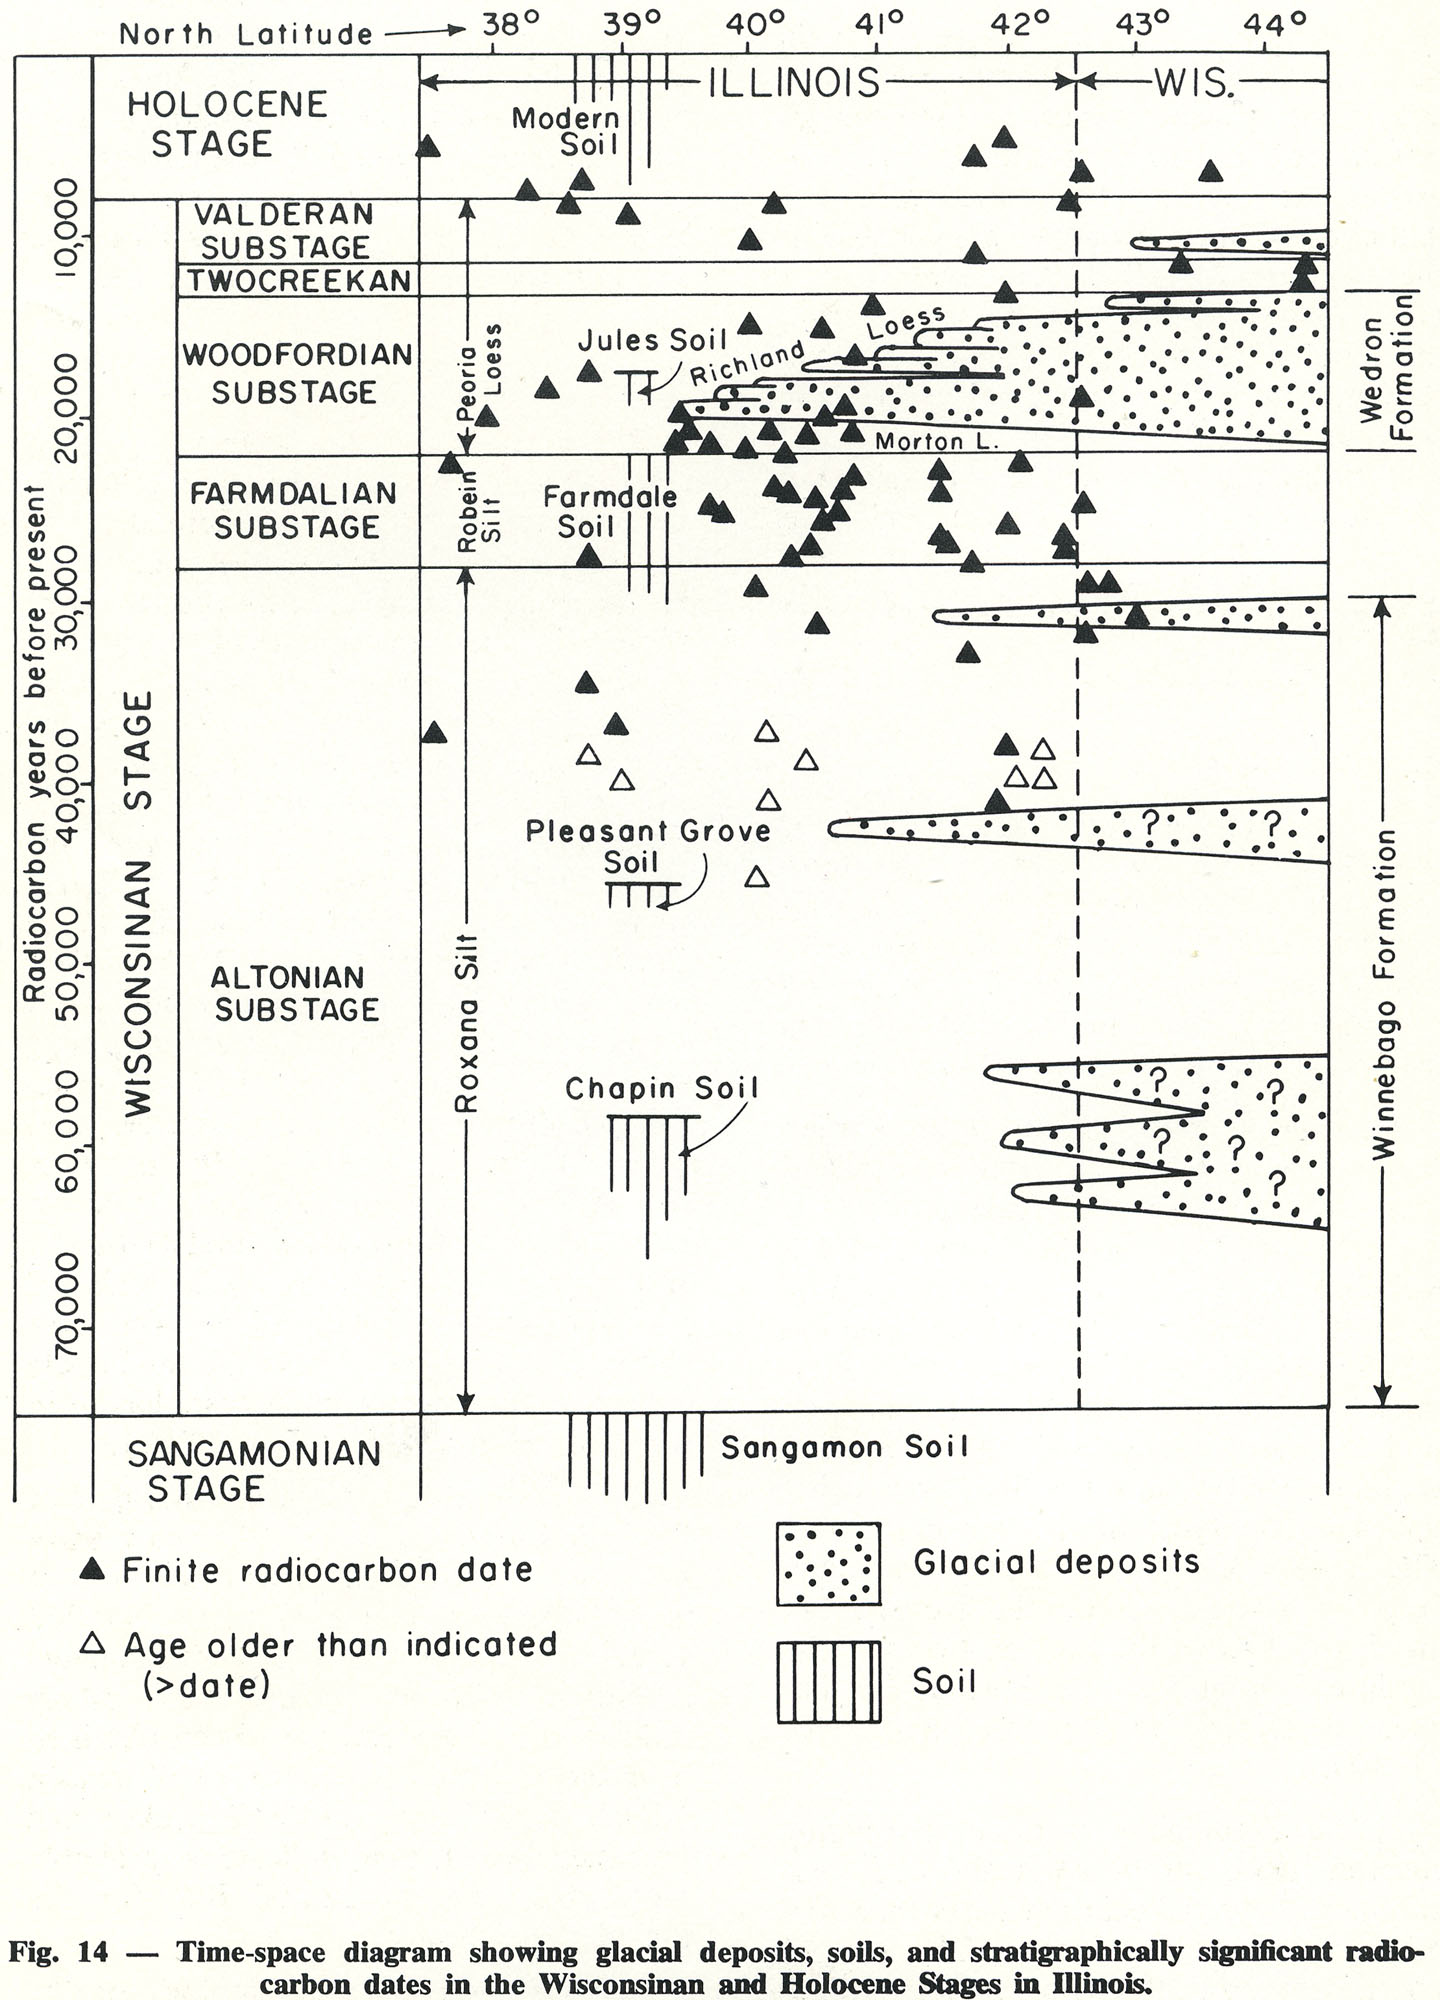
| 16:45, 18 April 2016 | 94-fig 14.jpg (file) |  |
398 KB | Fig. 14 -- Time-space diagram showing glacial deposits, soils, and stratigraphically significant radio-carbon dates in the Wisconsinan and Holocene Stages in Illinois. | 1 |
| 16:26, 18 April 2016 | 94-fig 5.jpg (file) |  |
399 KB | Fig. 5 -- Sequence of glaciations and interglacial drainage in Illinois. | 1 |
| 17:11, 18 April 2016 | 94-tb 5-b.jpg (file) |  |
404 KB | Table 5 - Continued. | 1 |
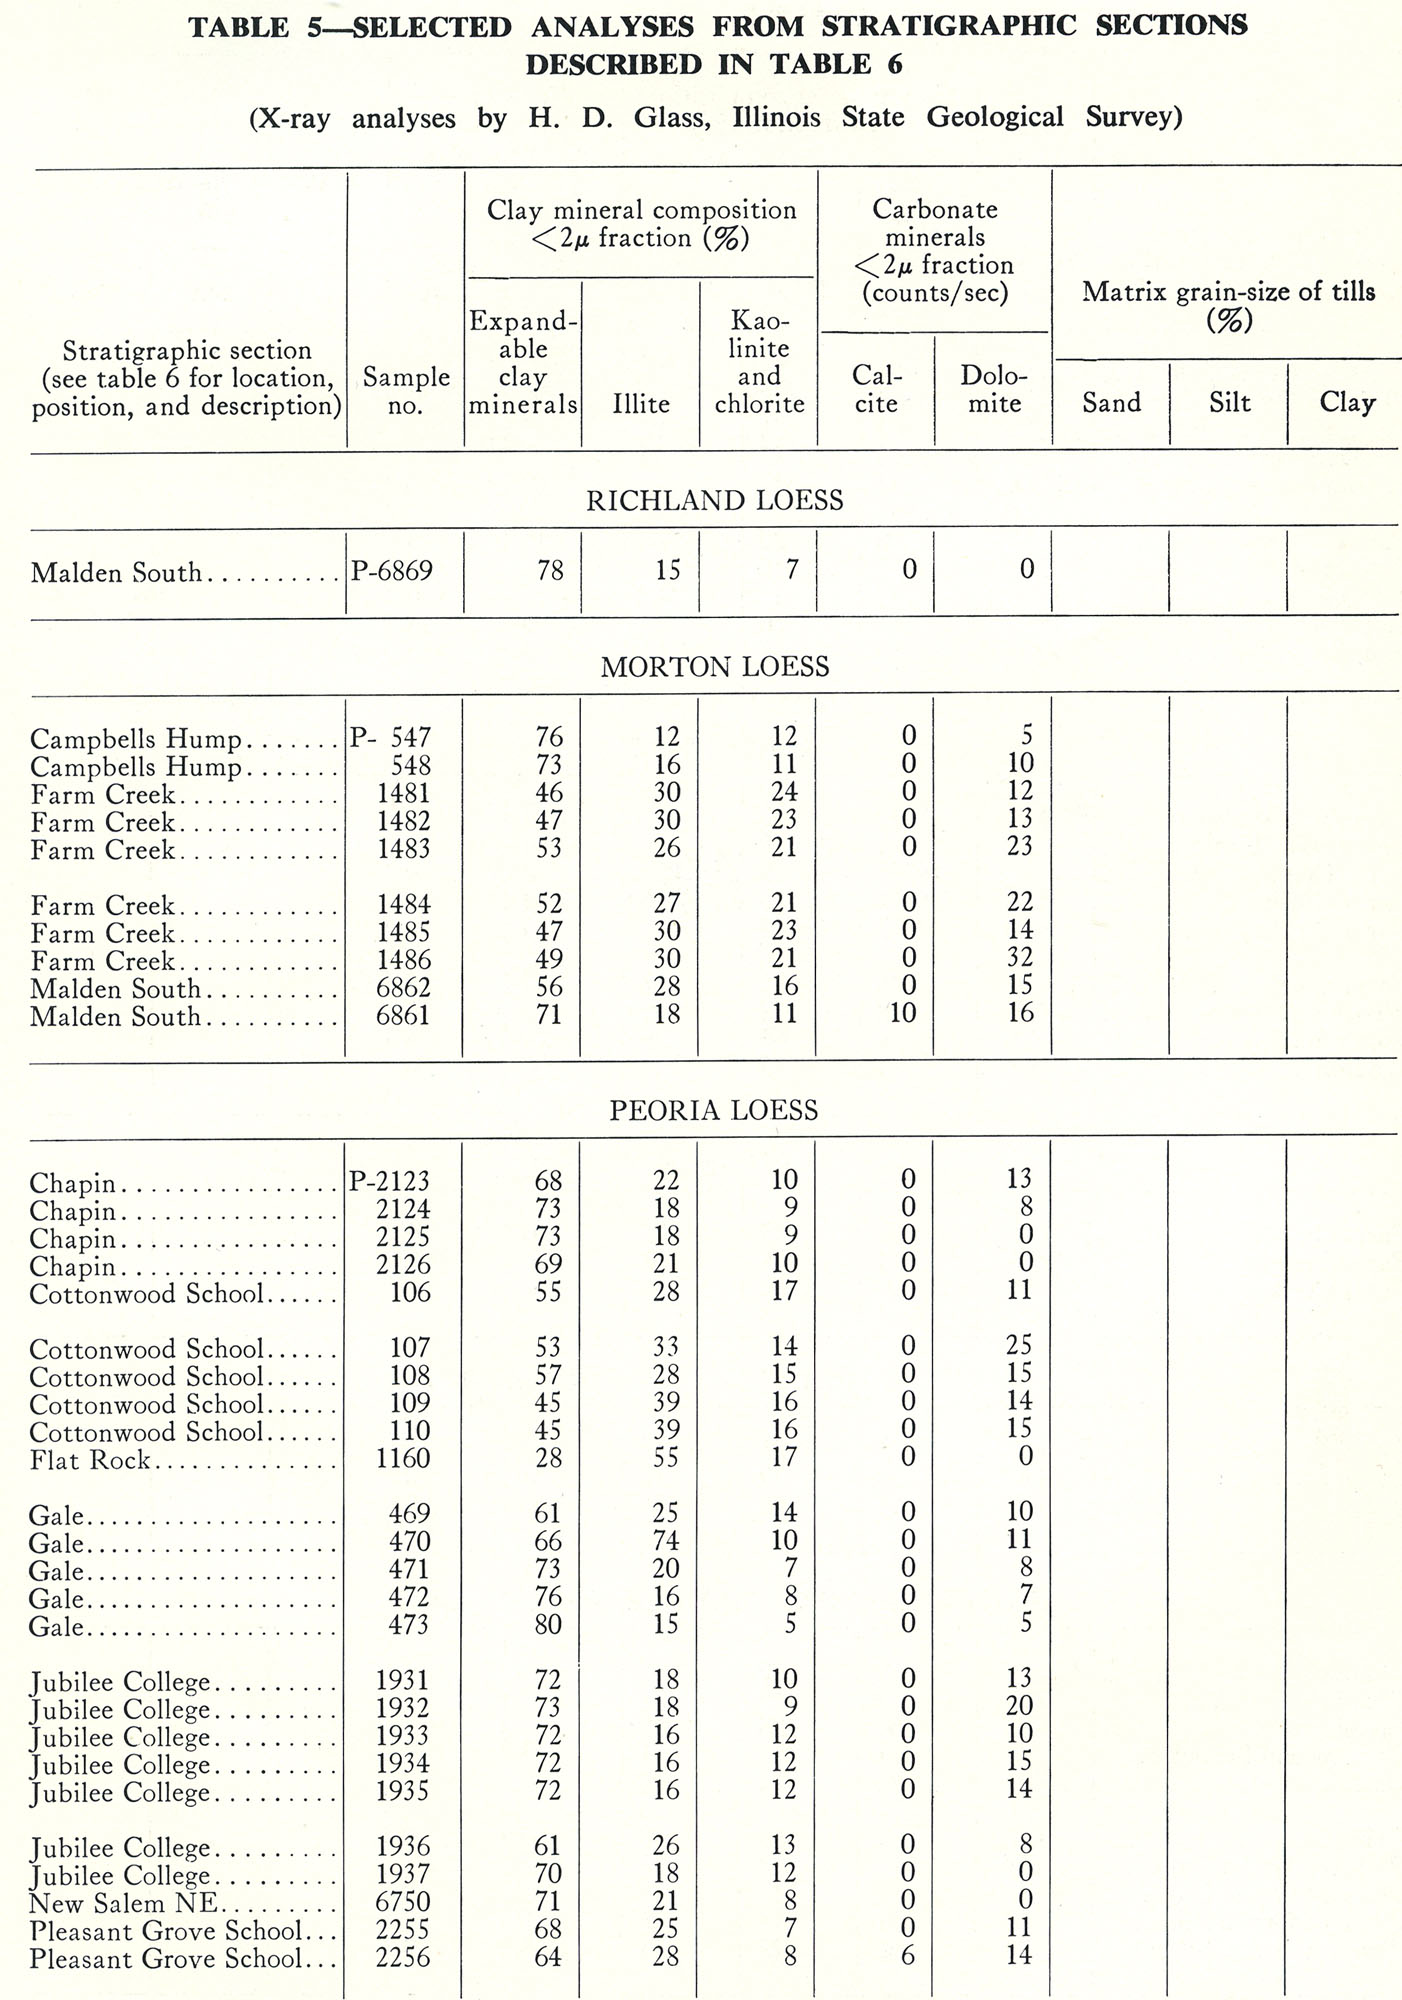
| 17:10, 18 April 2016 | 94-tb 5-a.jpg (file) |  |
410 KB | Table 5 -- Selected Analyses from Stratigraphic Sections Described in Table 6 (X-ray analyses by H. D. Glass, Illinois State Geological Survey). | 1 |
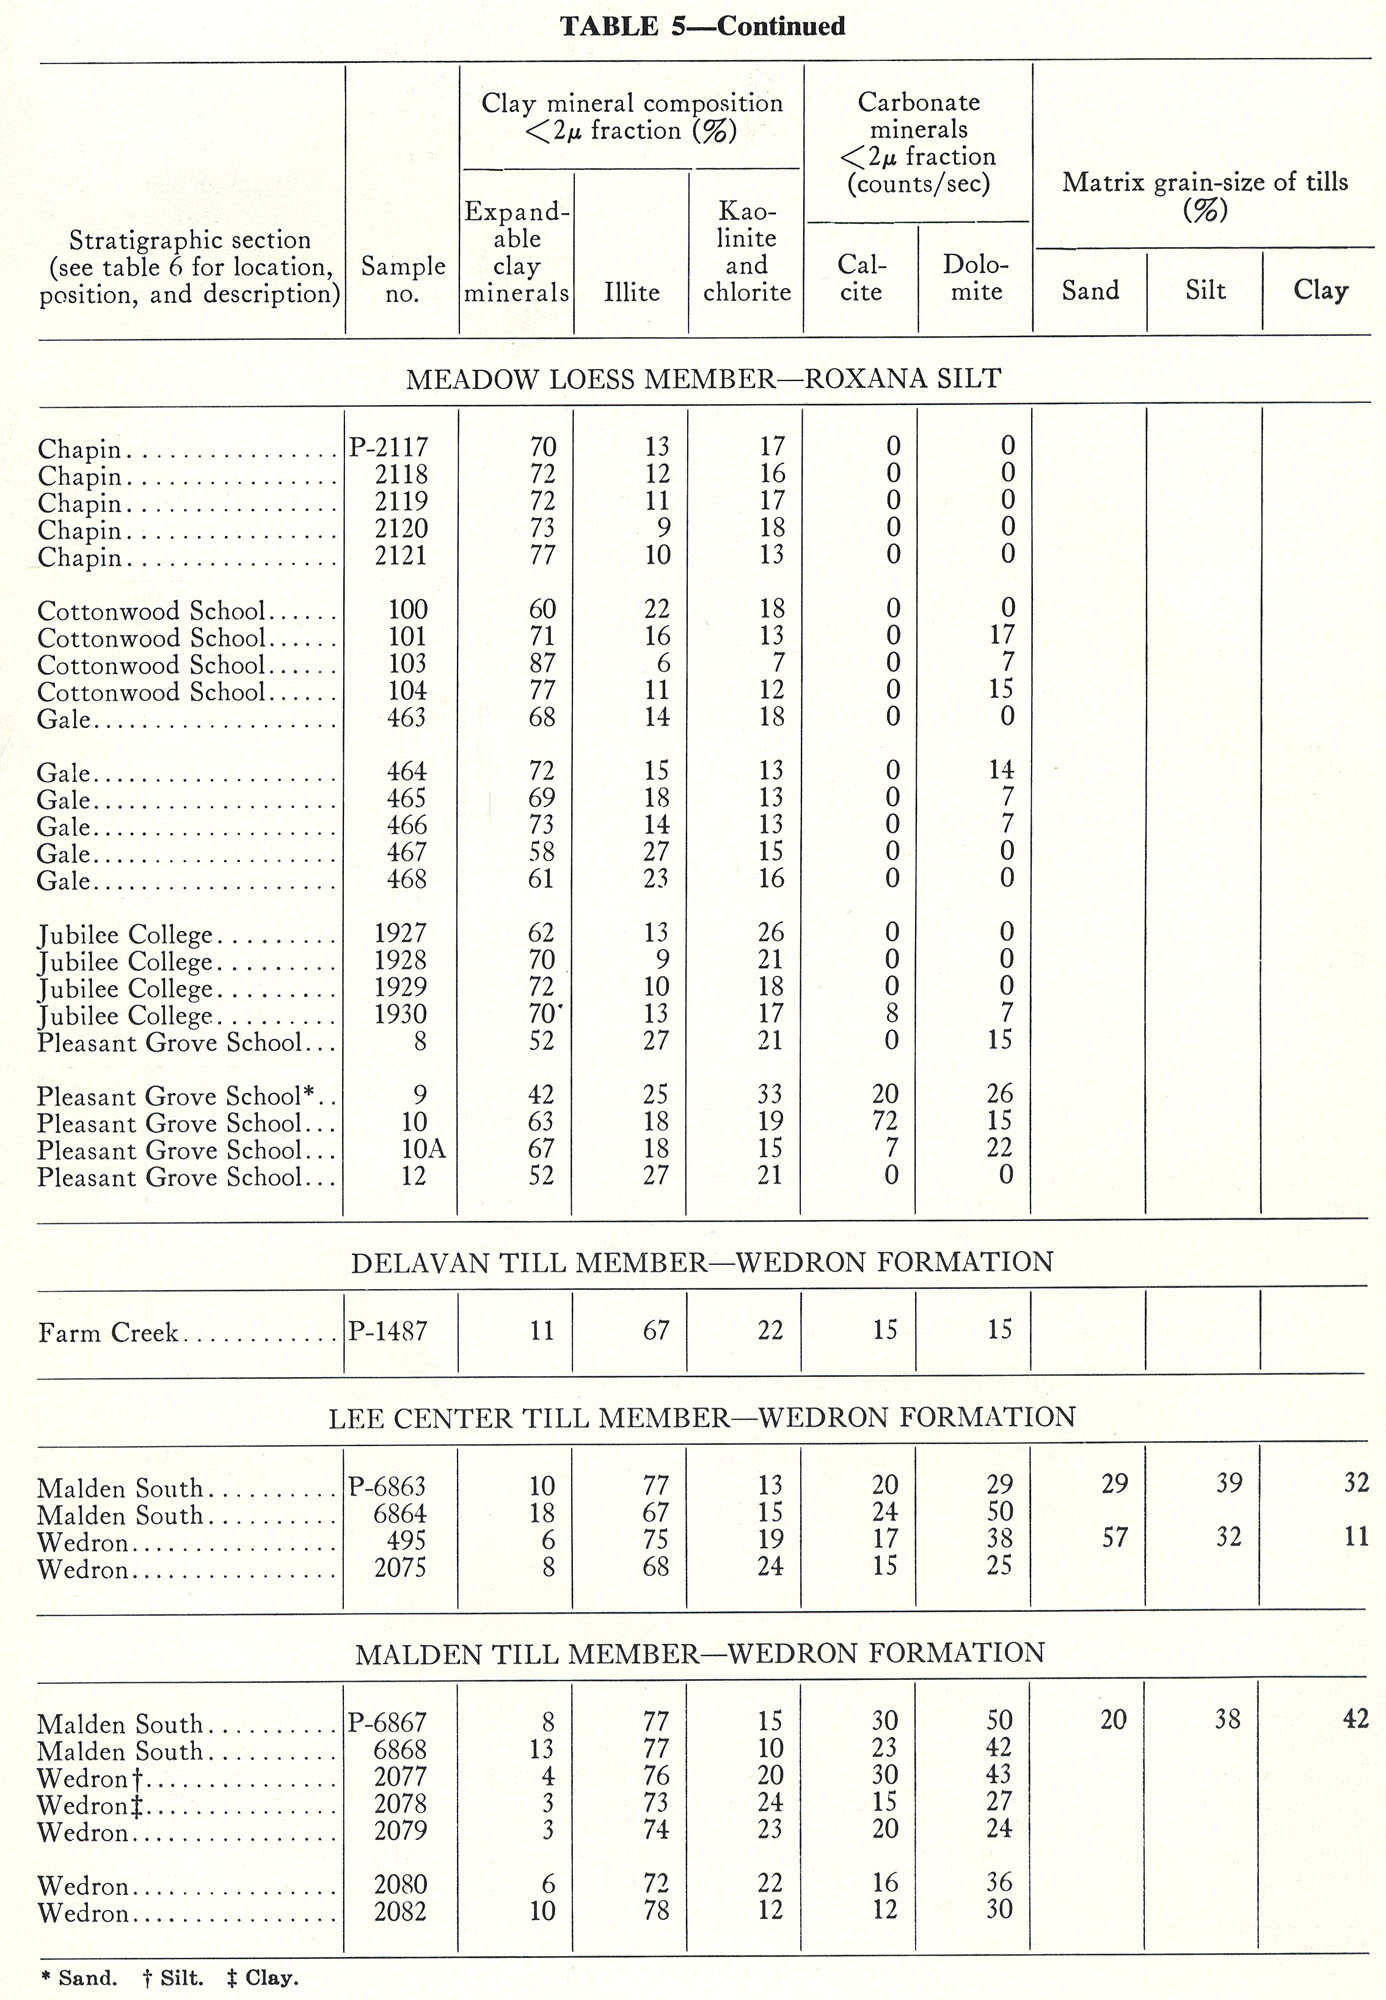
| 17:12, 18 April 2016 | 94-tb 5-d.jpg (file) |  |
414 KB | Table 5 -- Continued. | 1 |
| 17:11, 18 April 2016 | 94-tb 5-c.jpg (file) |  |
414 KB | Table 5 -- Continued. | 1 |
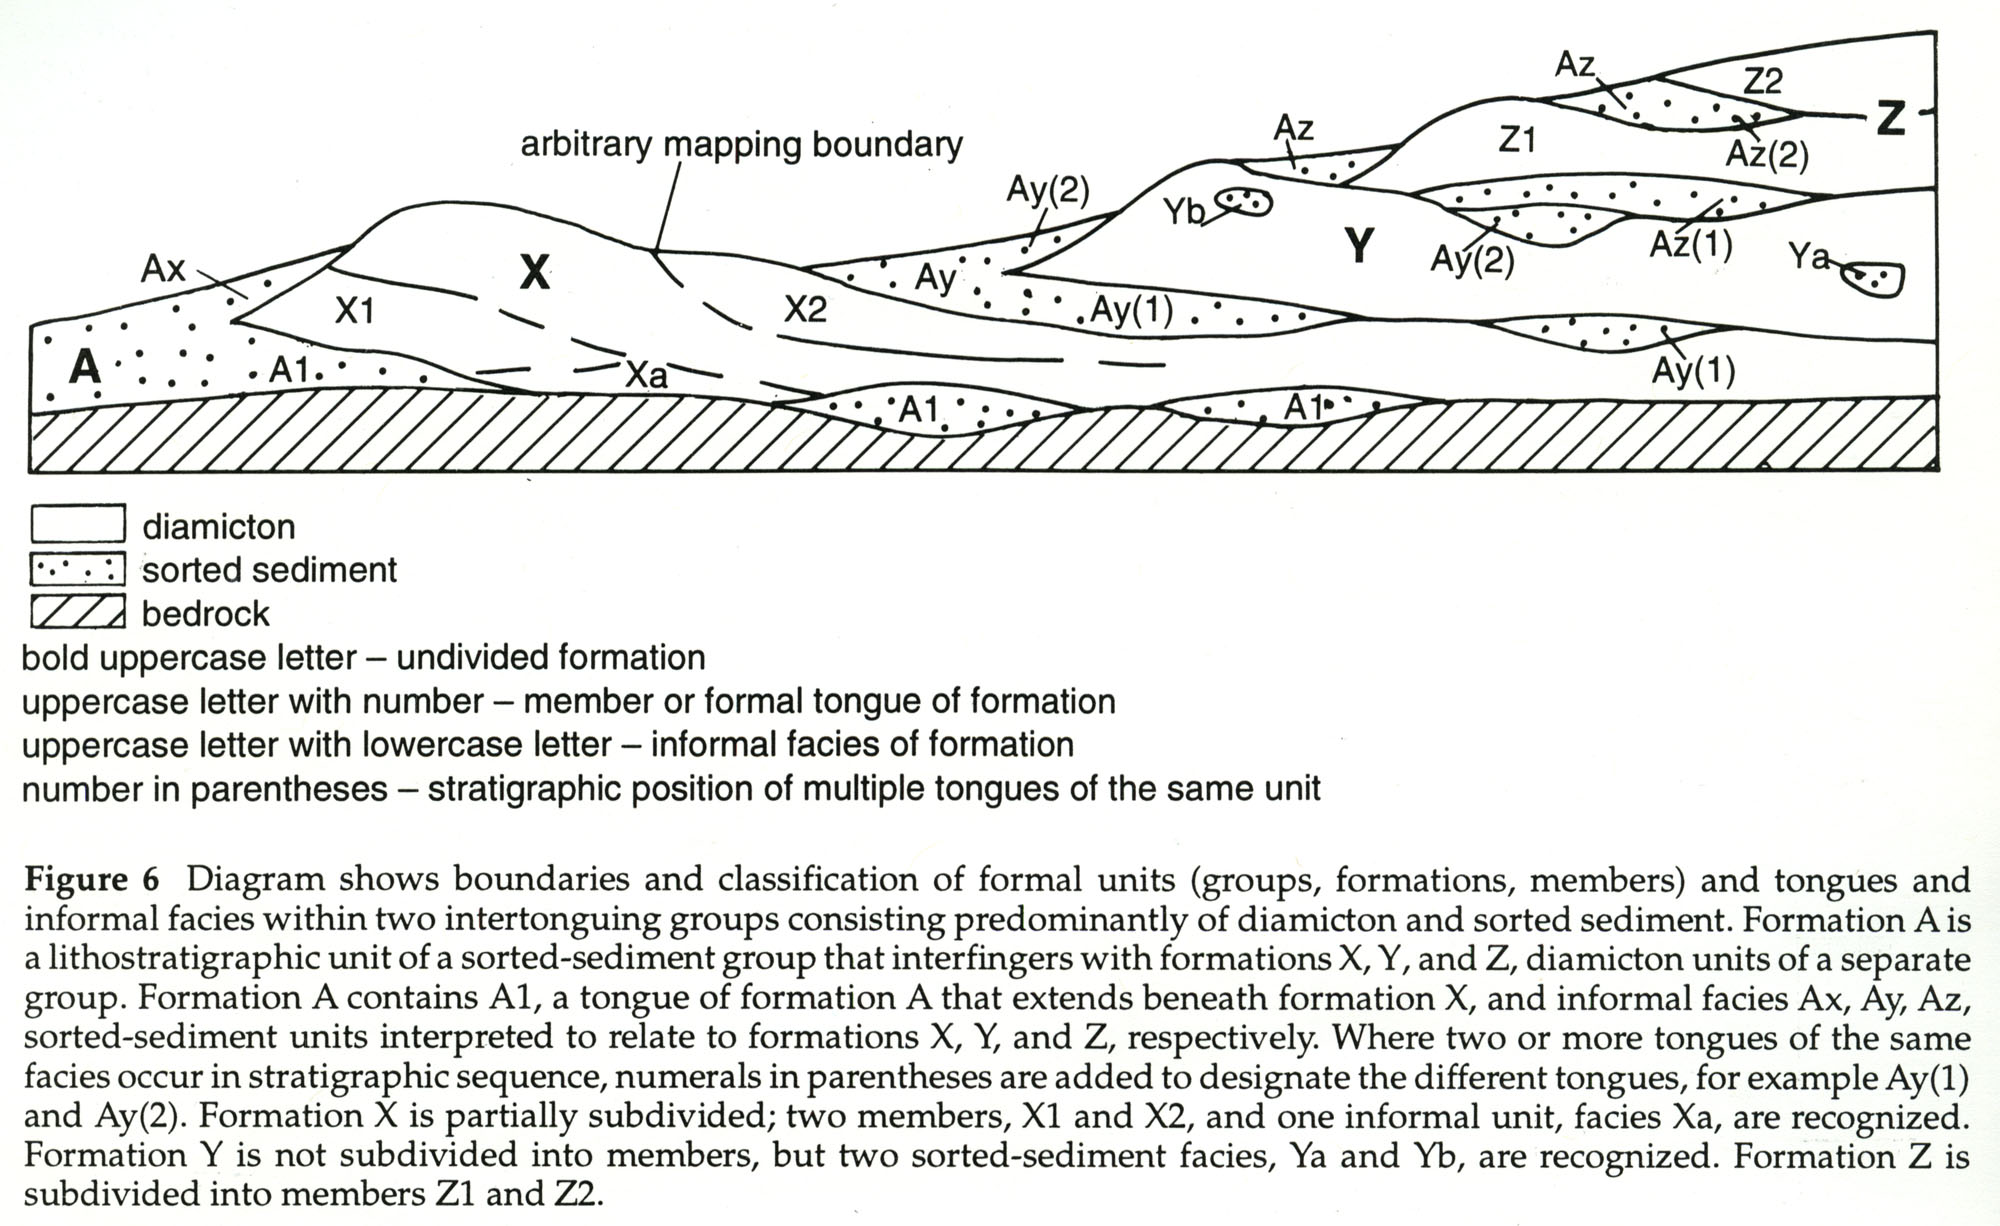
| 16:17, 19 April 2016 | 104-Figure 6.jpg (file) |  |
418 KB | Figure 6 -- Diagram shows boundaries and classification of formal units (groups, formations, members) and tongues and informal facies within two intertonguing groups consisting predominantly of diamicton and sorted sediment. Formation A is a lithostrat... | 1 |
| 16:44, 18 April 2016 | 94-fig 13.jpg (file) |  |
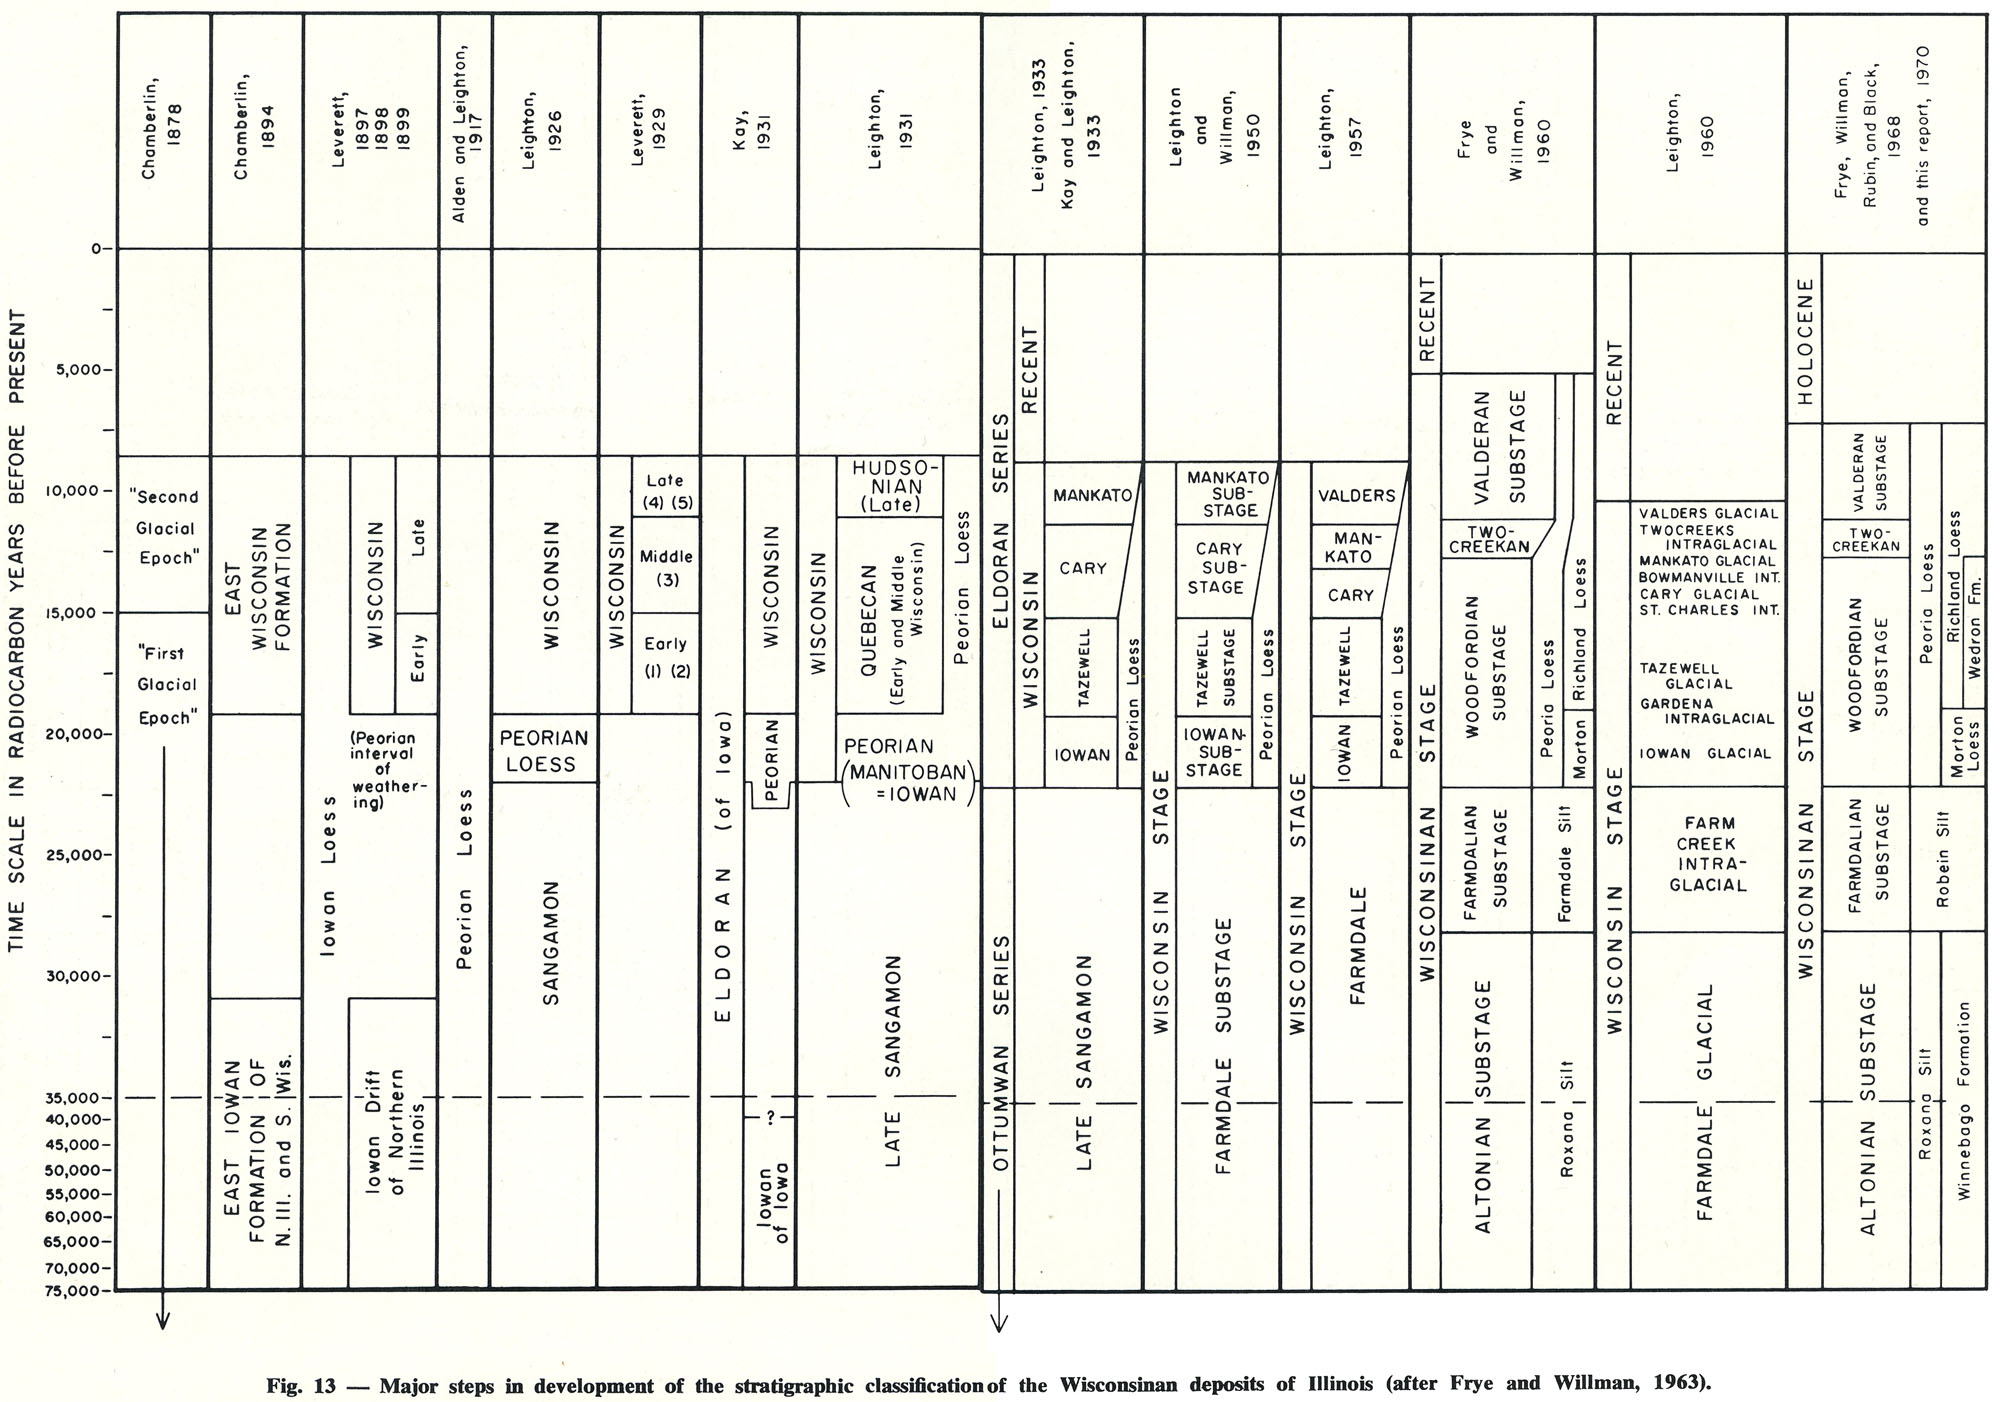
431 KB | Fig. 13 -- Major steps in development of the stratigraphic classification of the Wisconsinan deposits of Illinois (after Frye and Willman, 1963). | 1 |
| 16:38, 18 April 2016 | 94-fig 9.jpg (file) |  |
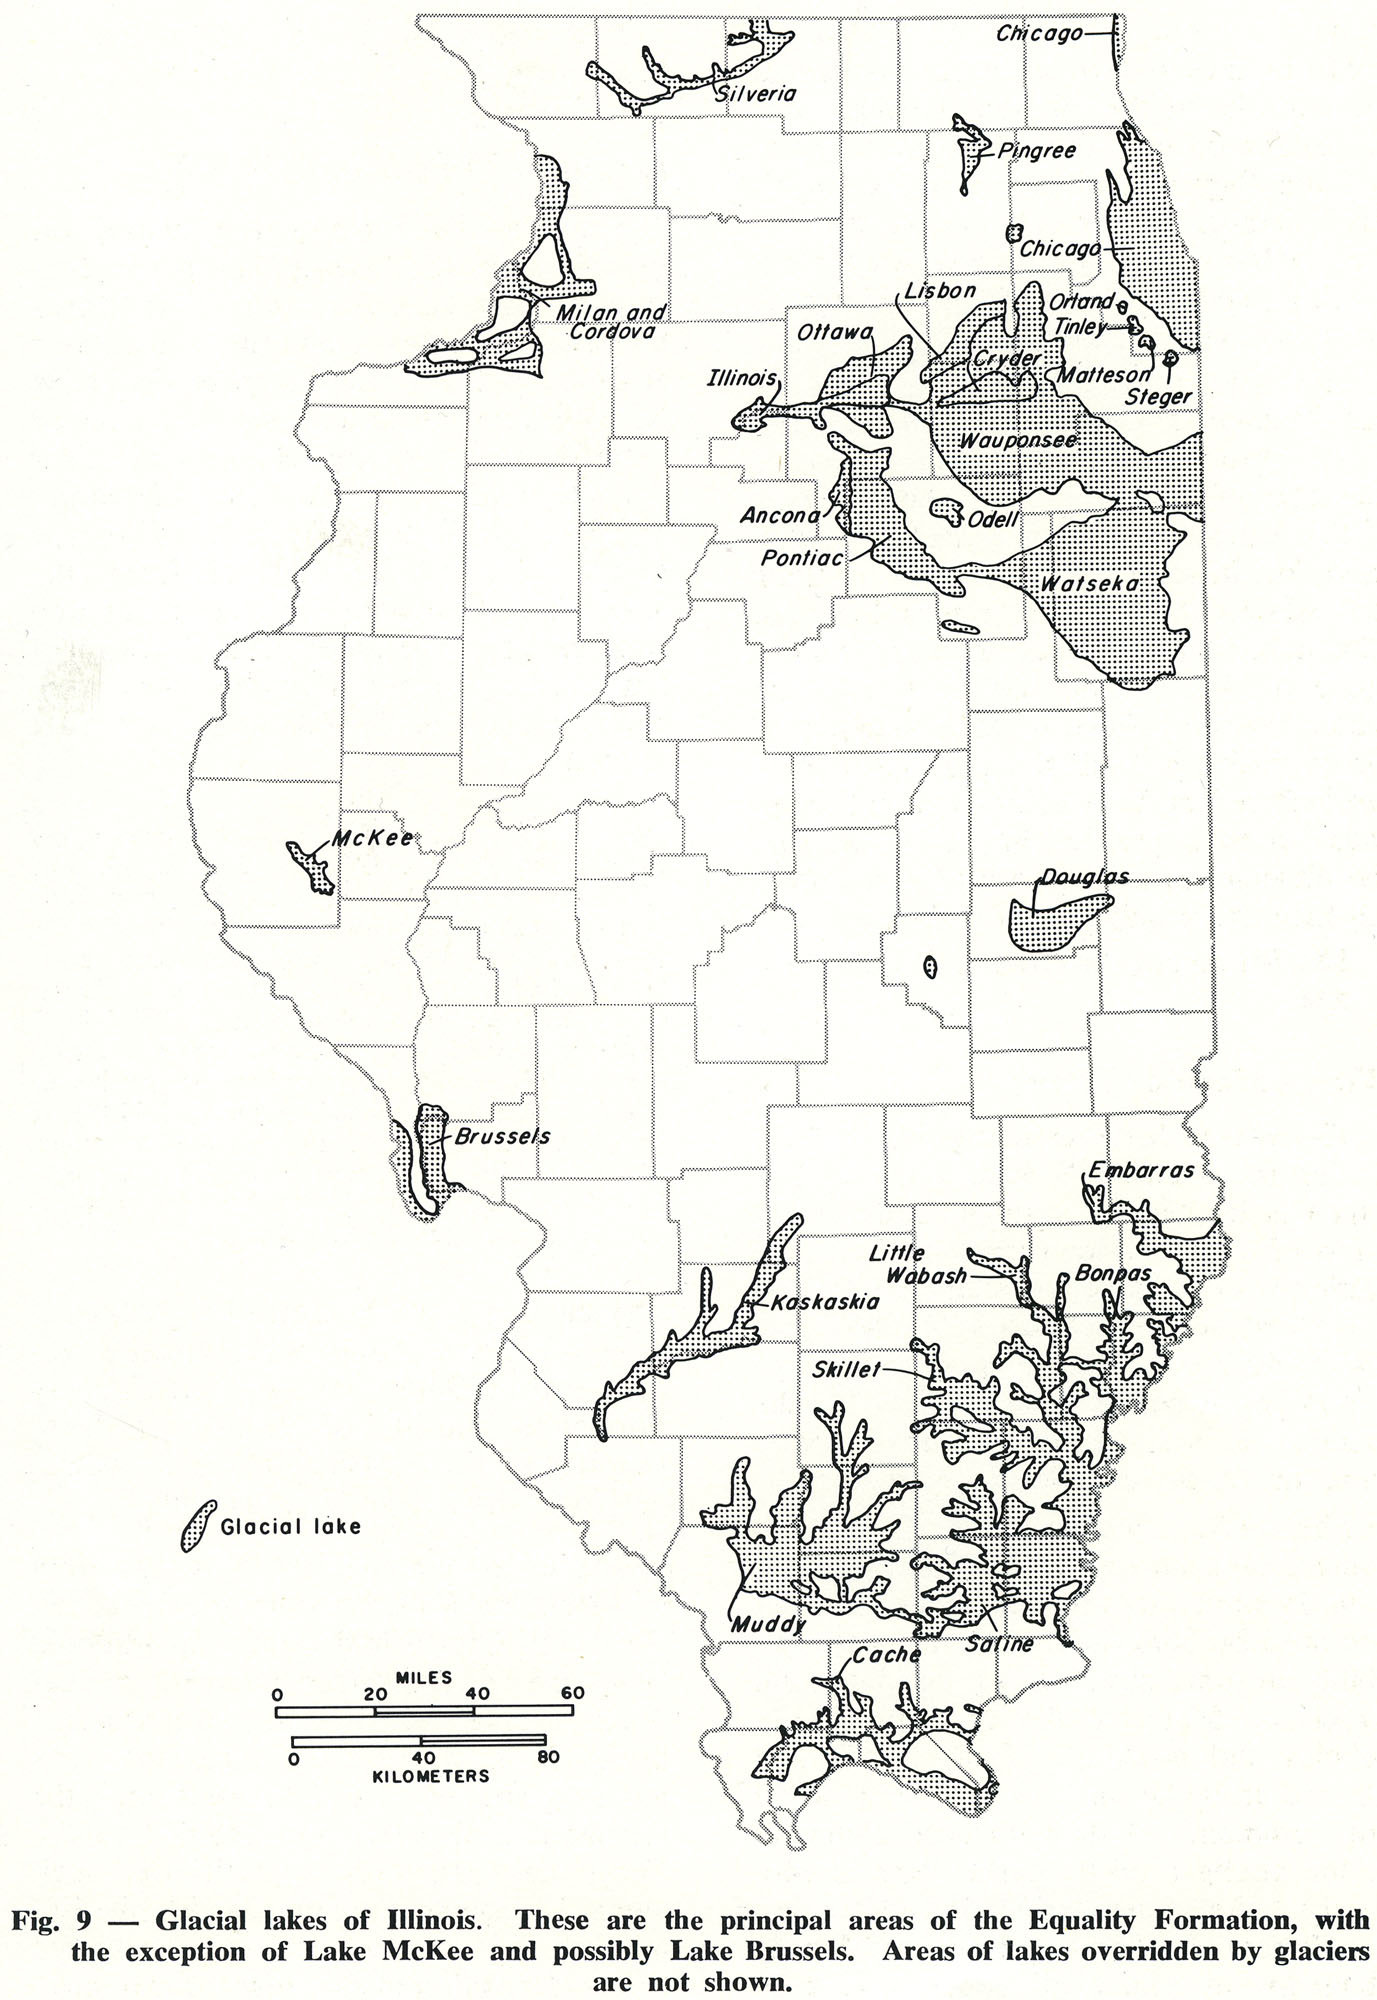
438 KB | Fig. 9 -- Glacial lakes of Illinois. These are the principal areas of the Equality Formation, with the exception of Lake McKee and possibly Lake Brussels. Areas of lakes overridden by glaciers are not shown. | 1 |
| 15:46, 19 April 2016 | 104-Figure 1 1.jpg (file) |  |
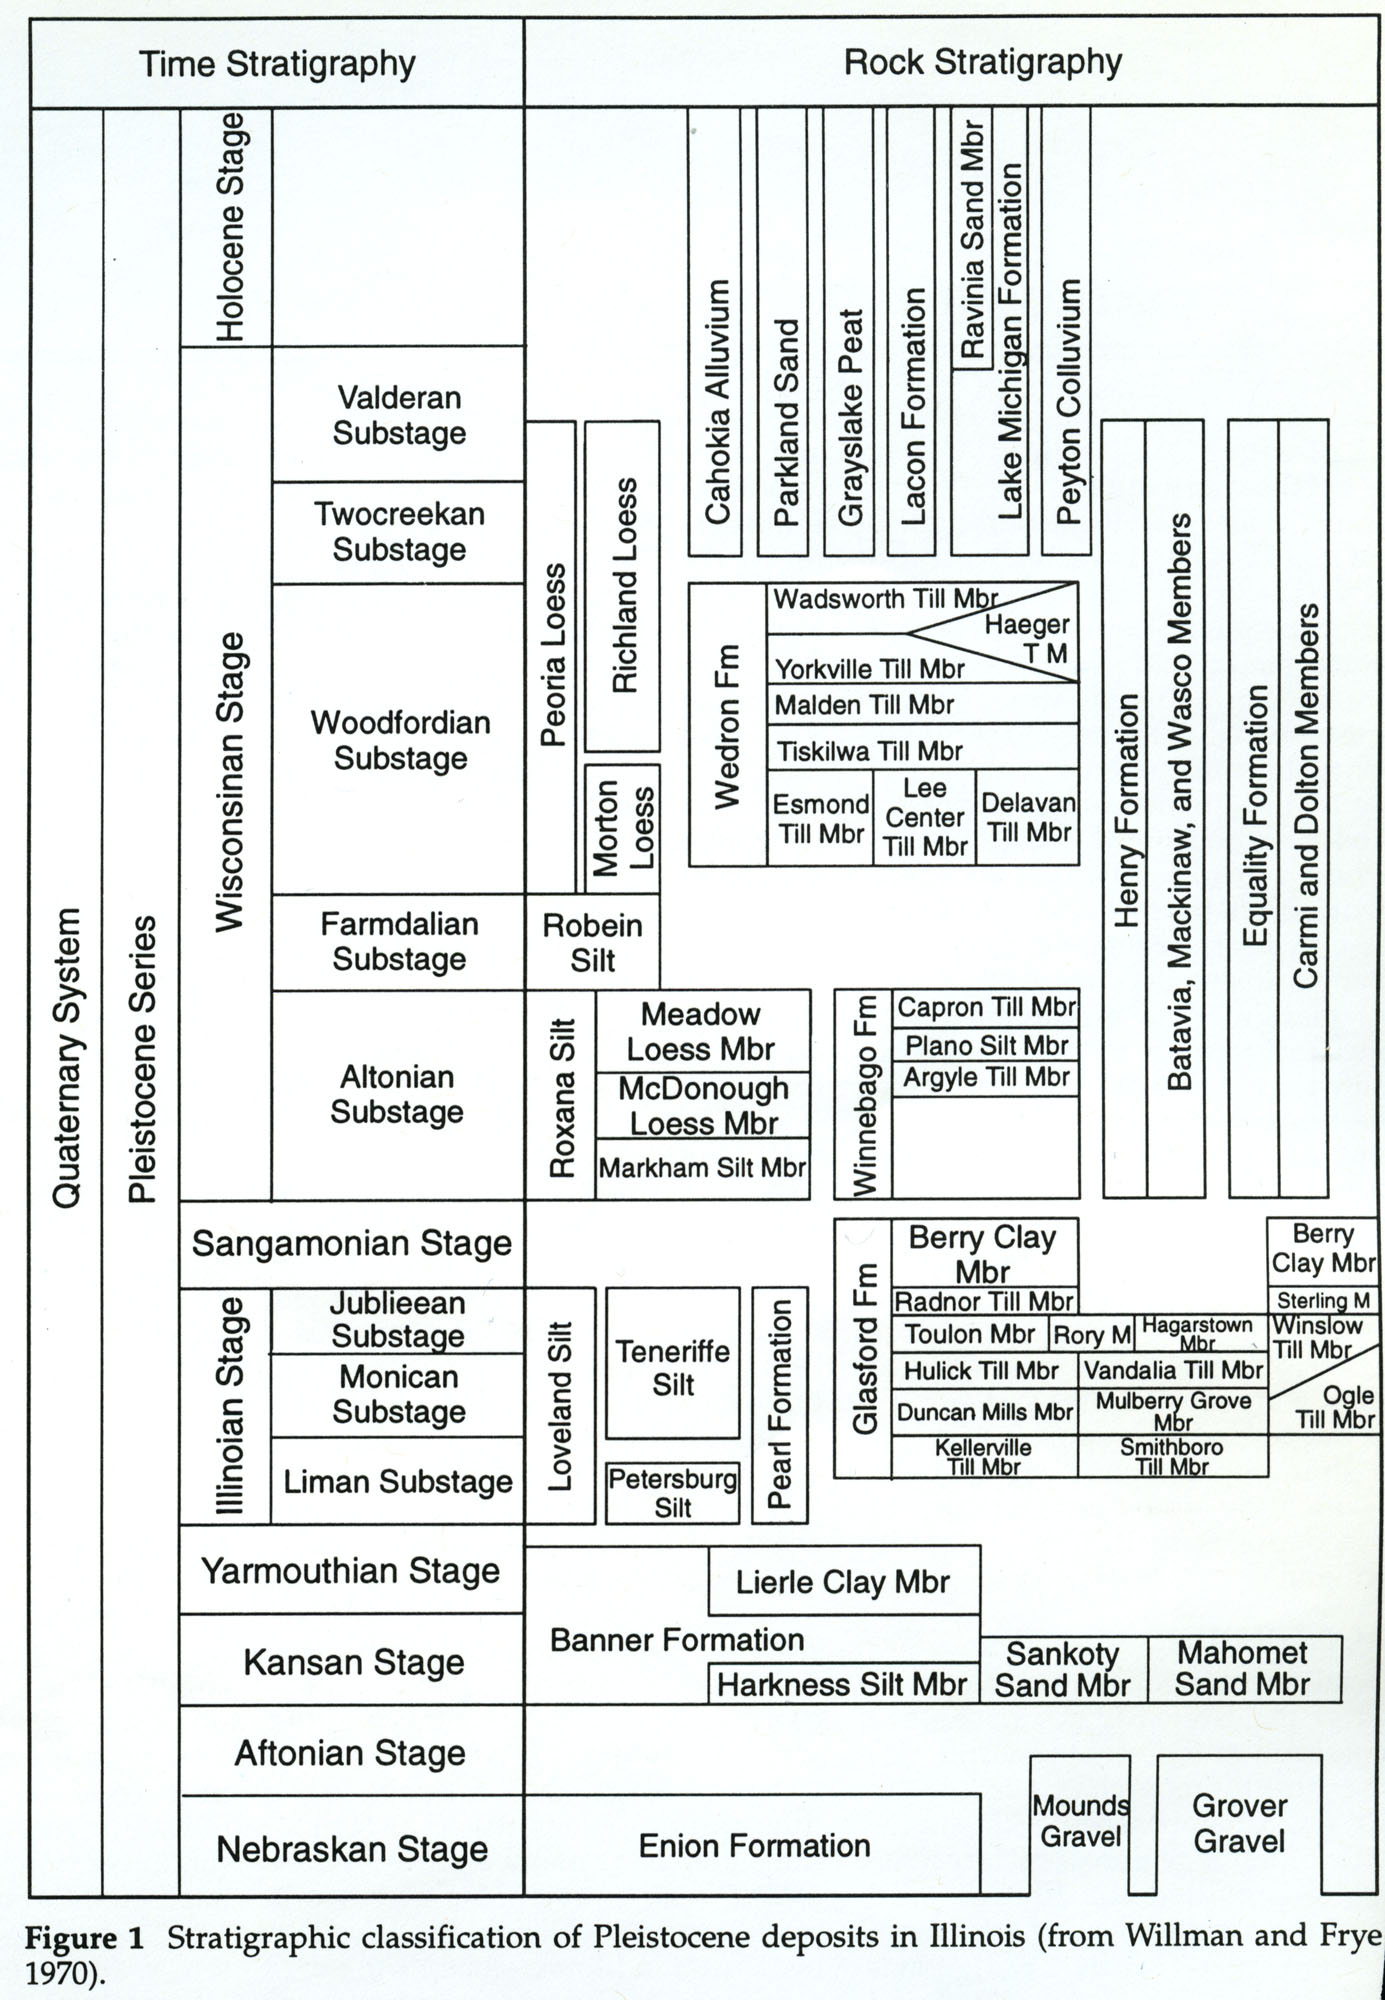
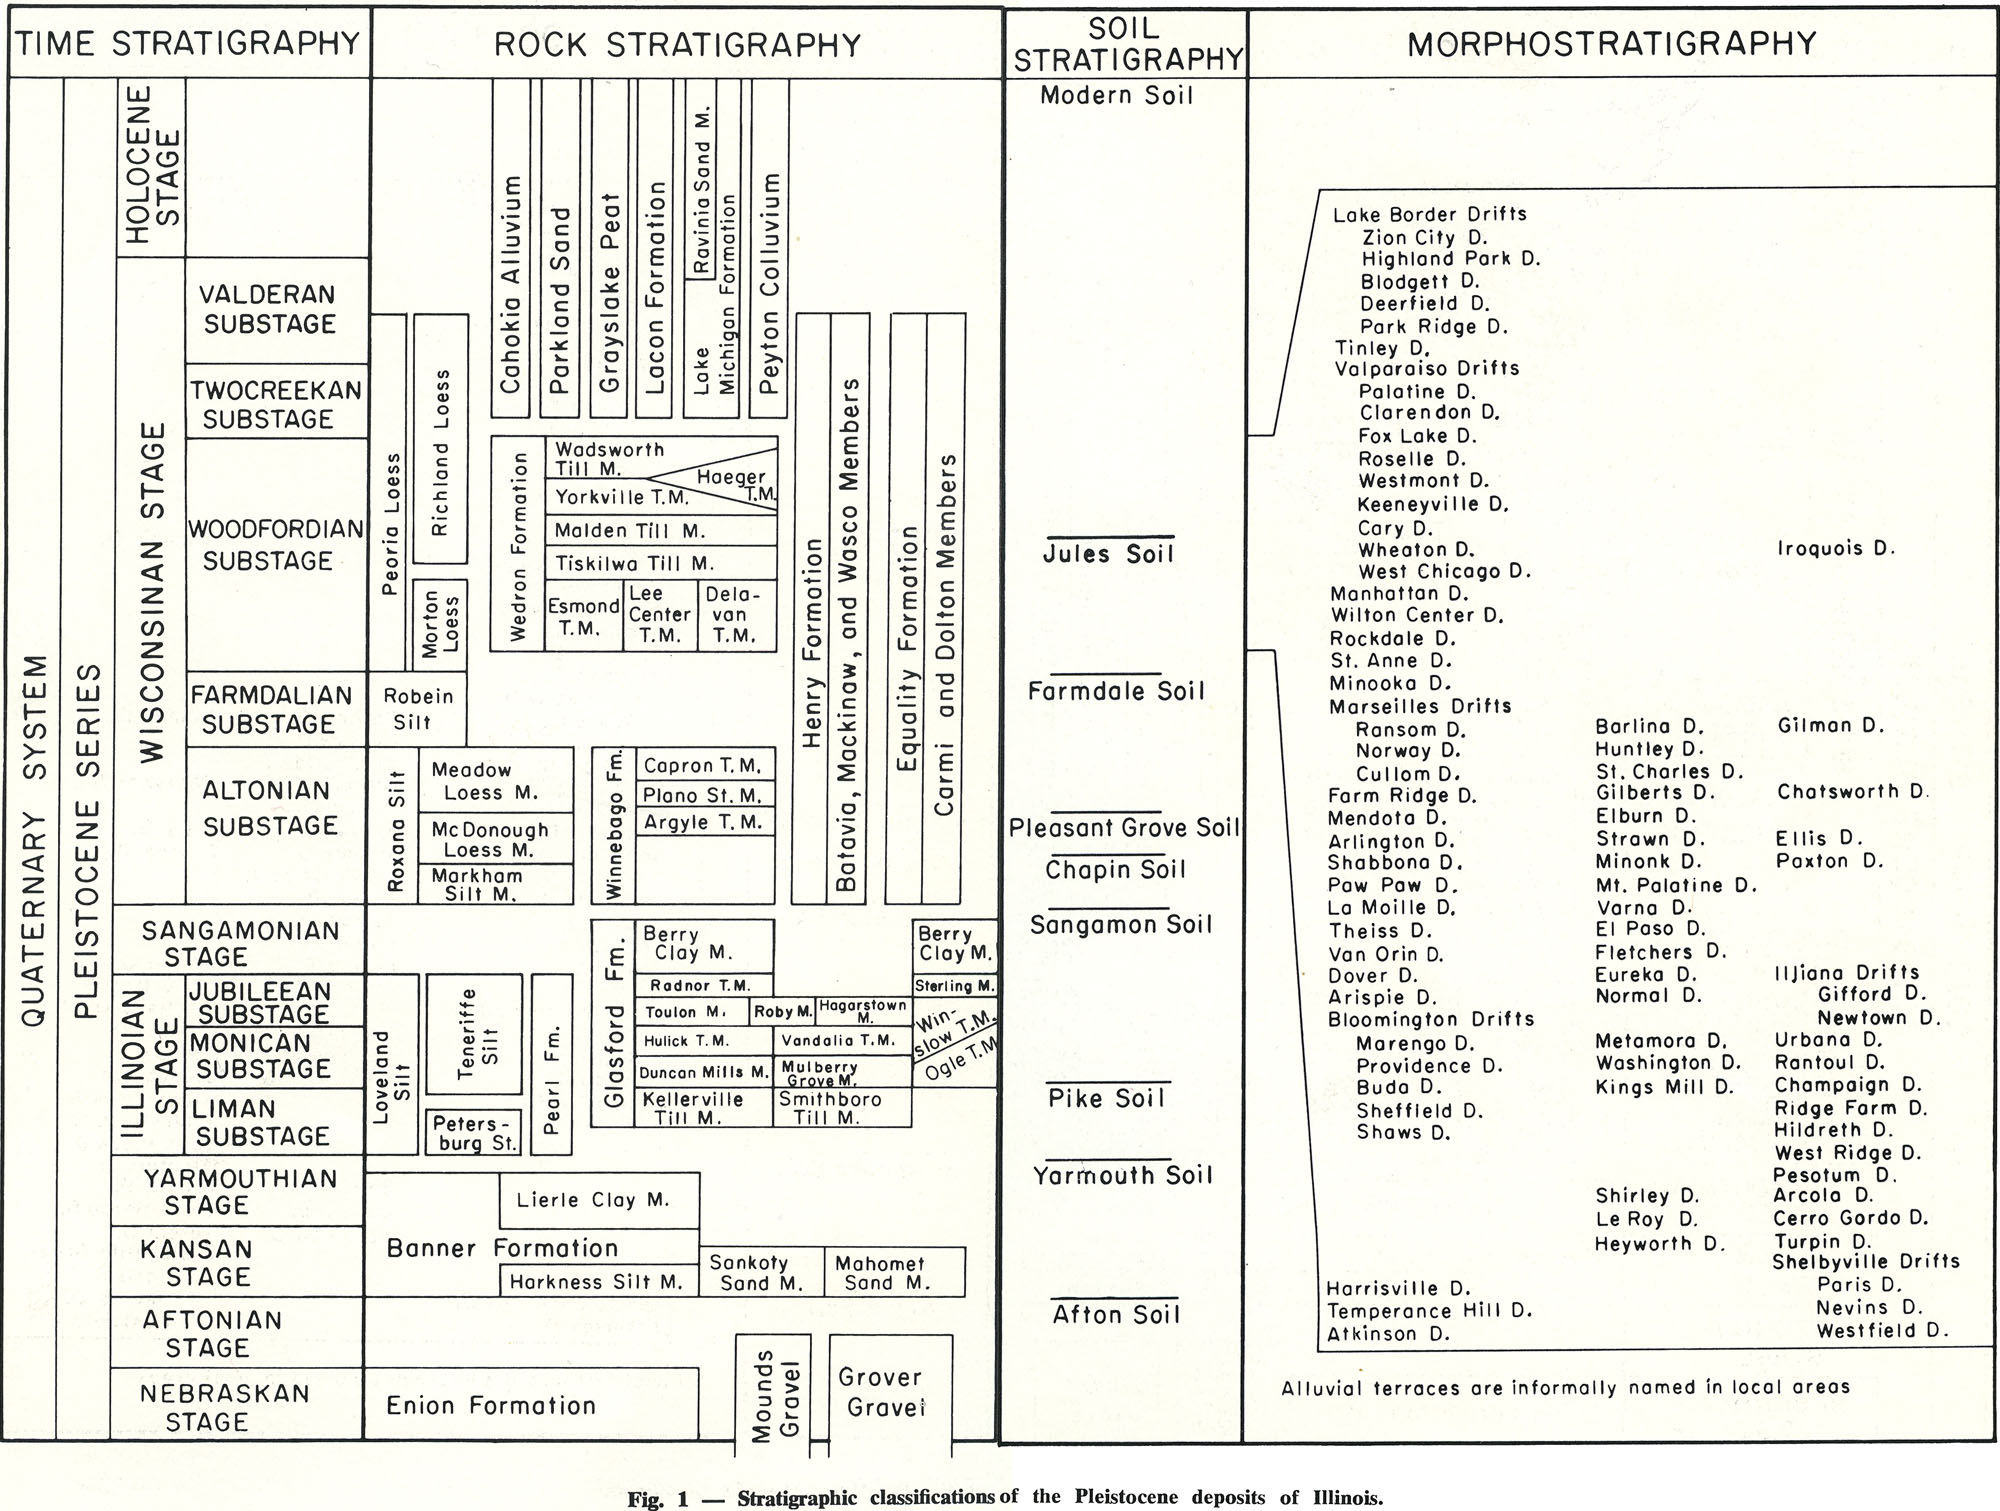
445 KB | Figure 1 -- Stratigraphic classification of Pleistocene deposits in Illinois (from Willman and Frye 1970). | 1 |
| 17:13, 18 April 2016 | 94-tb 5-e.jpg (file) |  |
449 KB | Table 5 -- Continued. | 1 |
| 16:59, 18 April 2016 | 94-tb 4.jpg (file) |  |
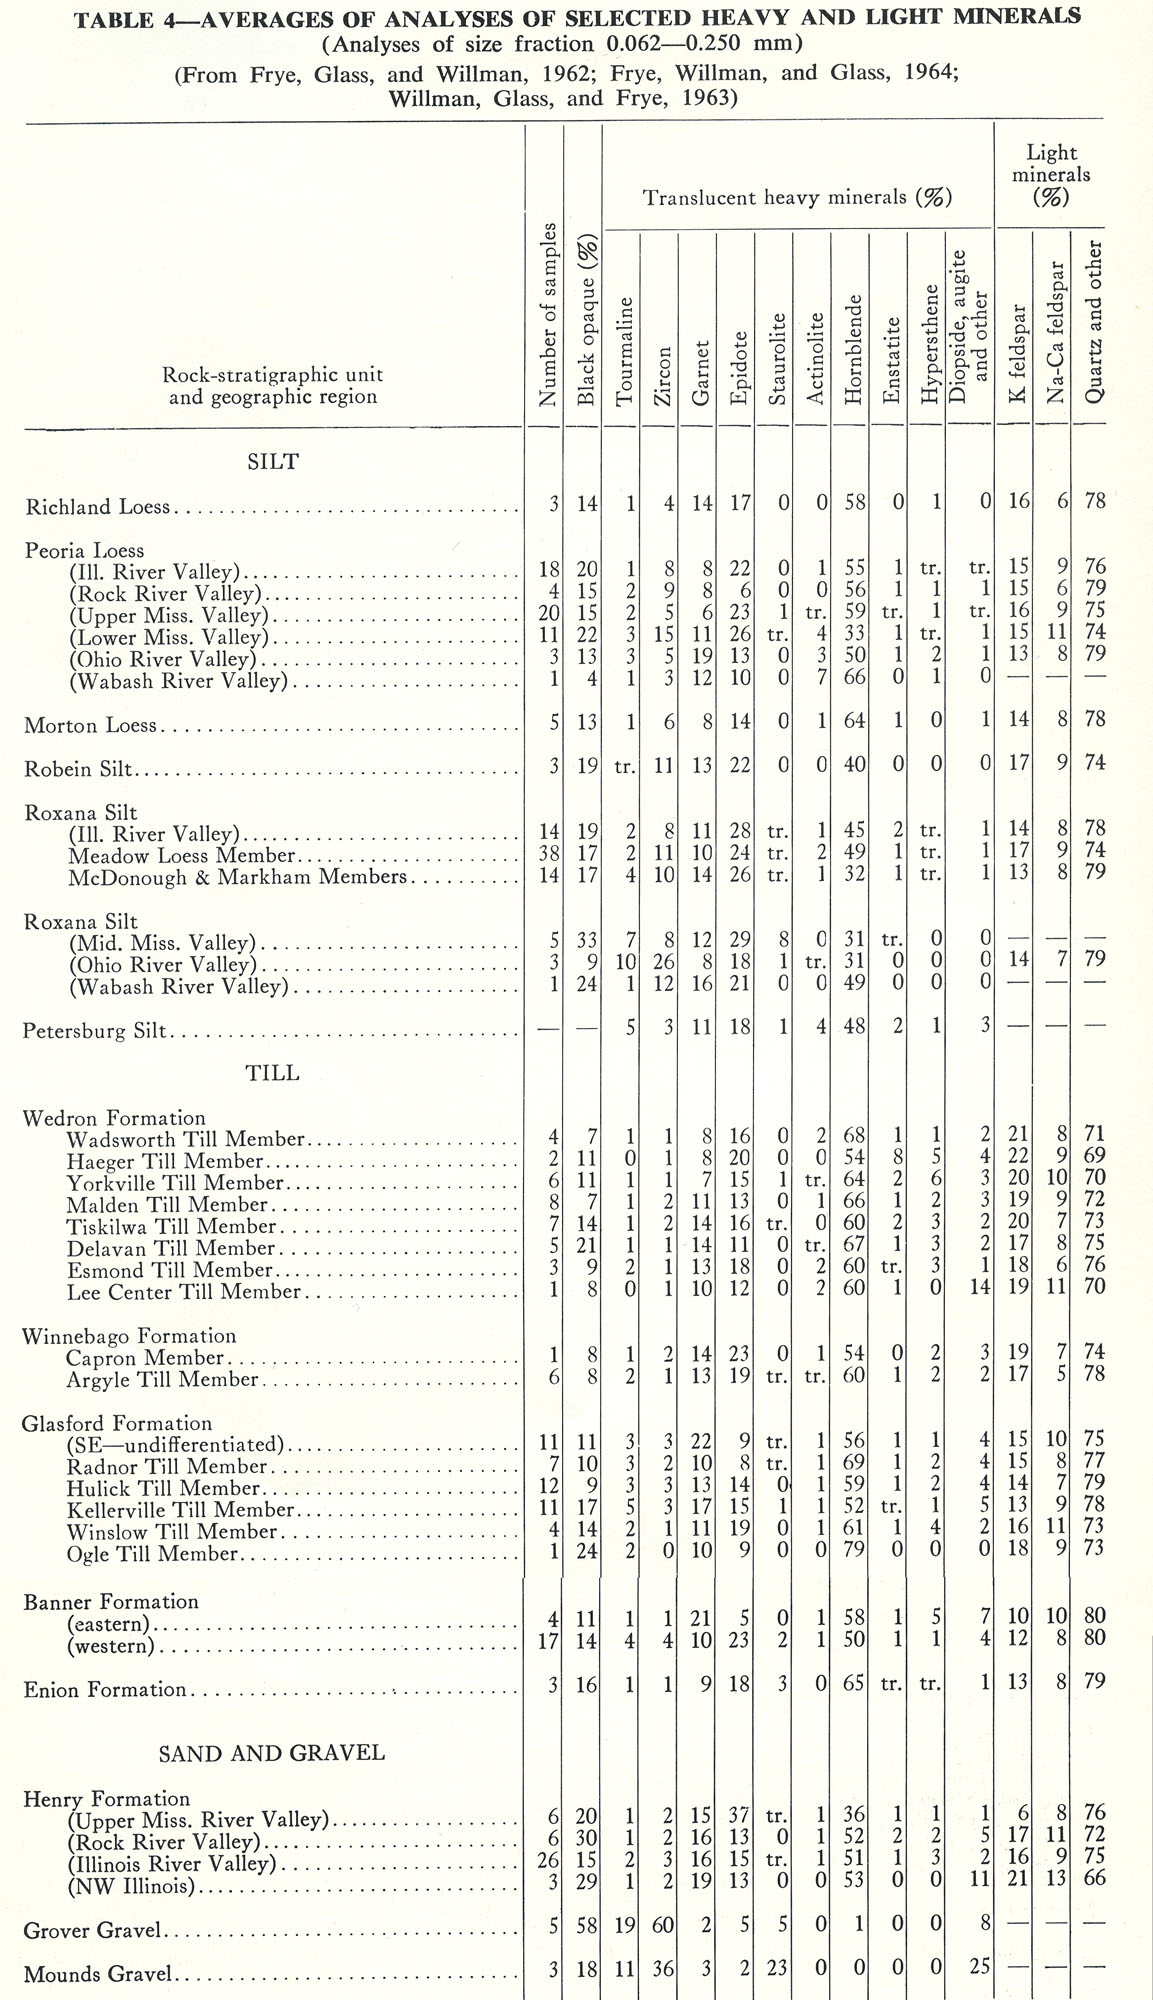
452 KB | Table 4 -- Averages of Analyses of Selected Heavy and Light Minerals (Analyses of size fraction 0.062-0.250 mm). (From Frye, Glass, and Willman, 1962; Frye, Willman, and Glass, 1964; Willman, Glass, and Frye, 1963) | 1 |
| 15:41, 1 April 2016 | Figure P-15.jpg (file) |  |
457 KB | Fig. P-15 -- Thickness of the Bond Formation (based on map by K. E. Clegg). | 1 |
| 15:52, 19 April 2016 | 104-Figure 3.jpg (file) |  |
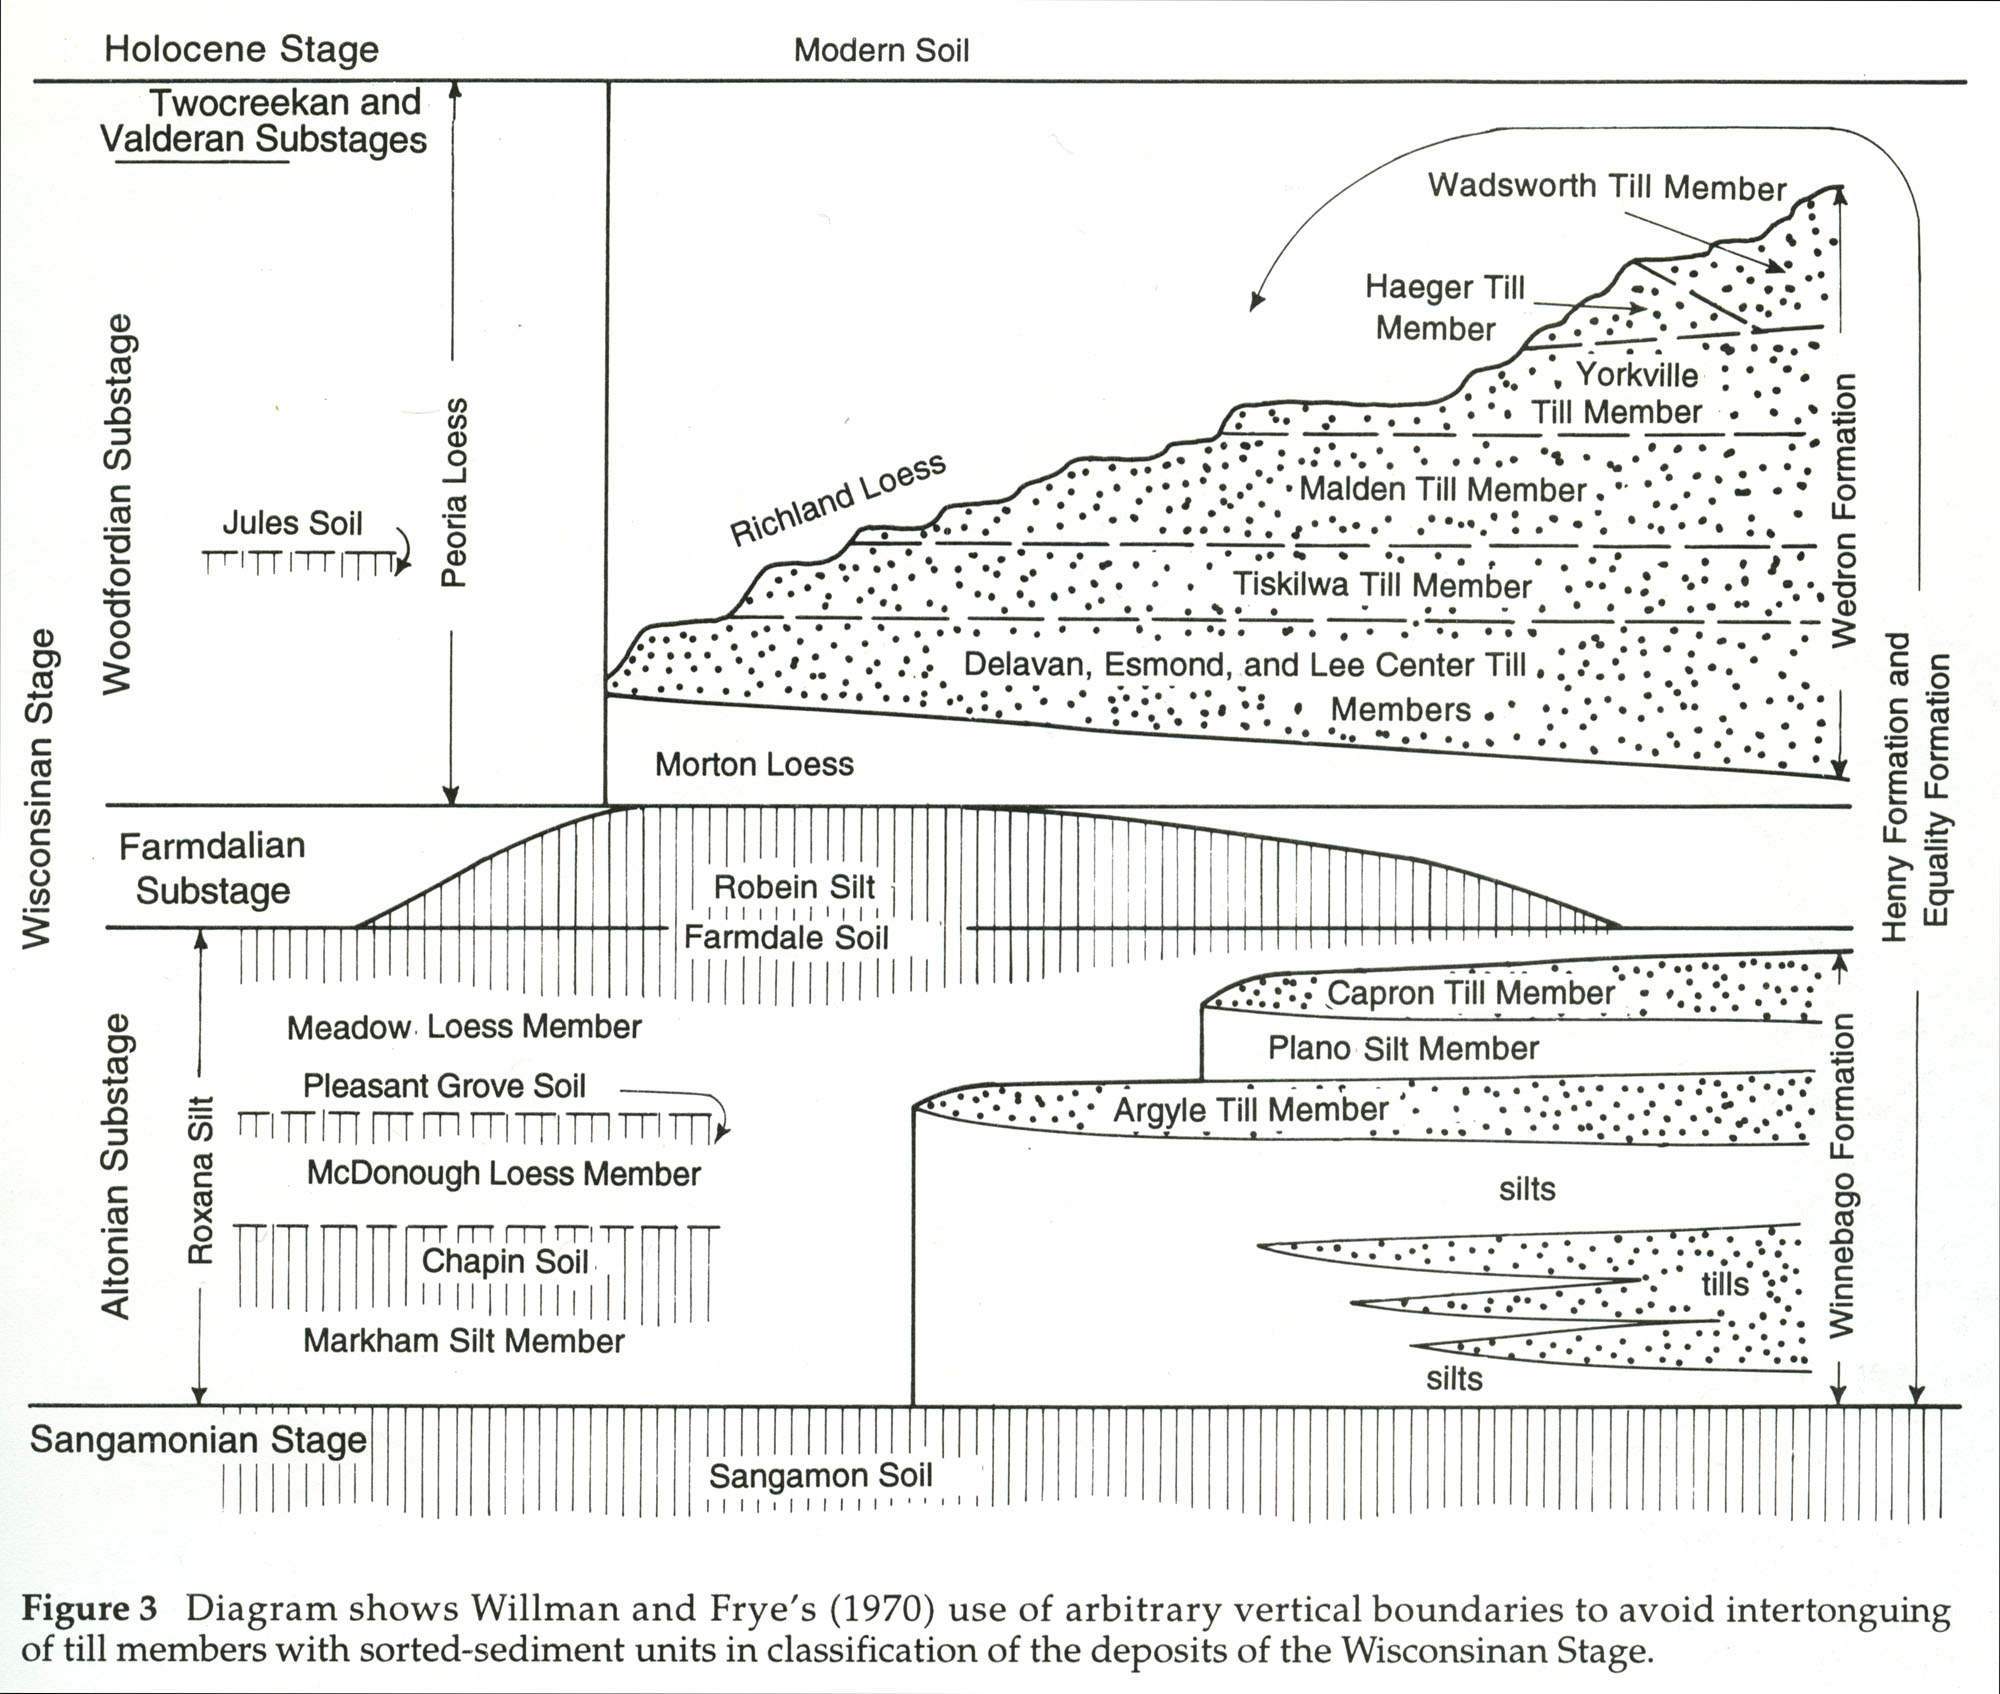
459 KB | Figure 3 -- Diagram shows Willman and Frye's (1970) use of arbitrary vertical boundaries to avoid intertonguing of till members with sorted-sediment units in classification of the deposits of the Wisconsinan Stage. | 1 |
| 16:10, 19 April 2016 | 104-Figure 4b.jpg (file) |  |
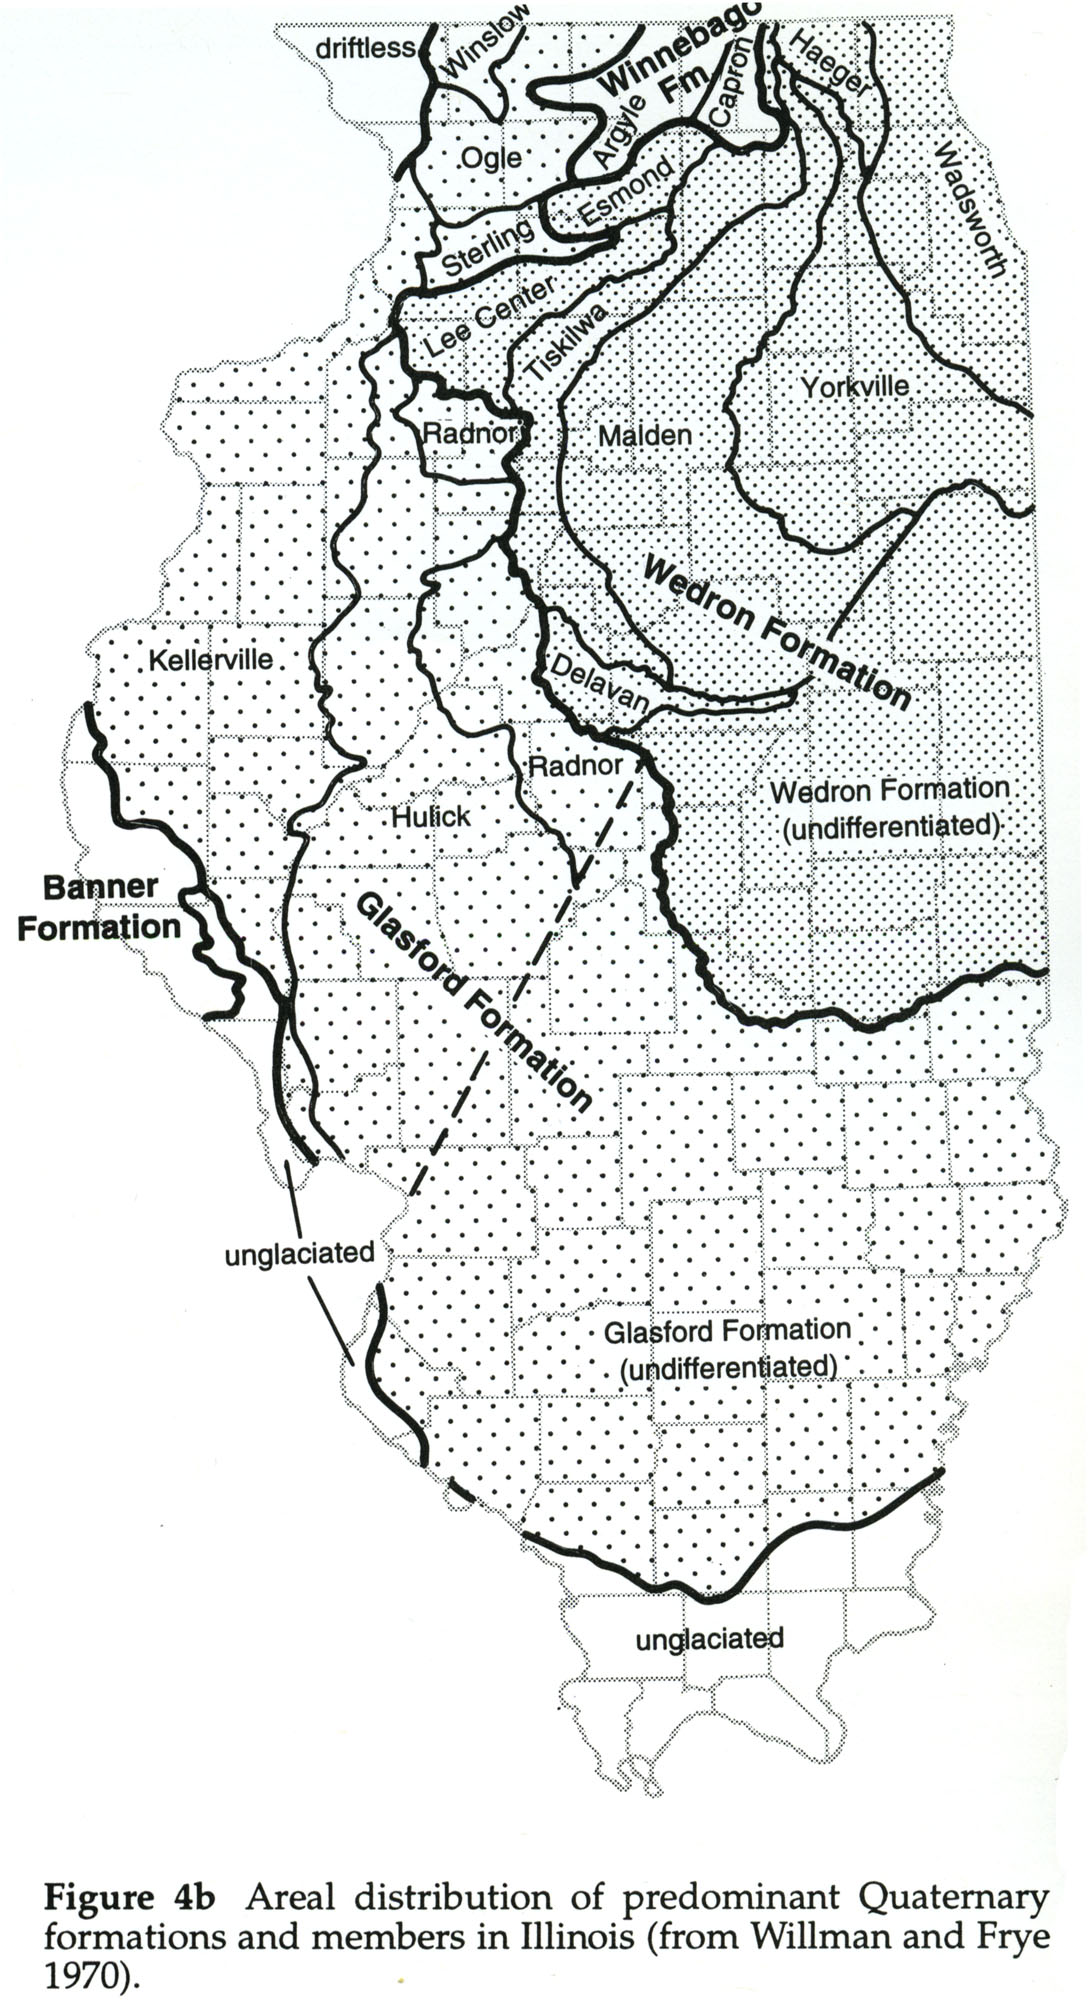
464 KB | Figure 4b -- Areal distribution of predominant Quaternary formations and members in Illinois (from Willman and Frye 1970). | 1 |
| 16:22, 19 April 2016 | 104-Figure 8.jpg (file) |  |
475 KB | Lobe boundaries. | 1 |
| 15:38, 1 April 2016 | Figure P-10.jpg (file) |  |
507 KB | Fig. P-10 -- Combined thickness of the Caseyville, Abbott, and Spoon Formations (after Walness, 1955) | 1 |
| 16:55, 18 April 2016 | 94-tb 2.jpg (file) |  |
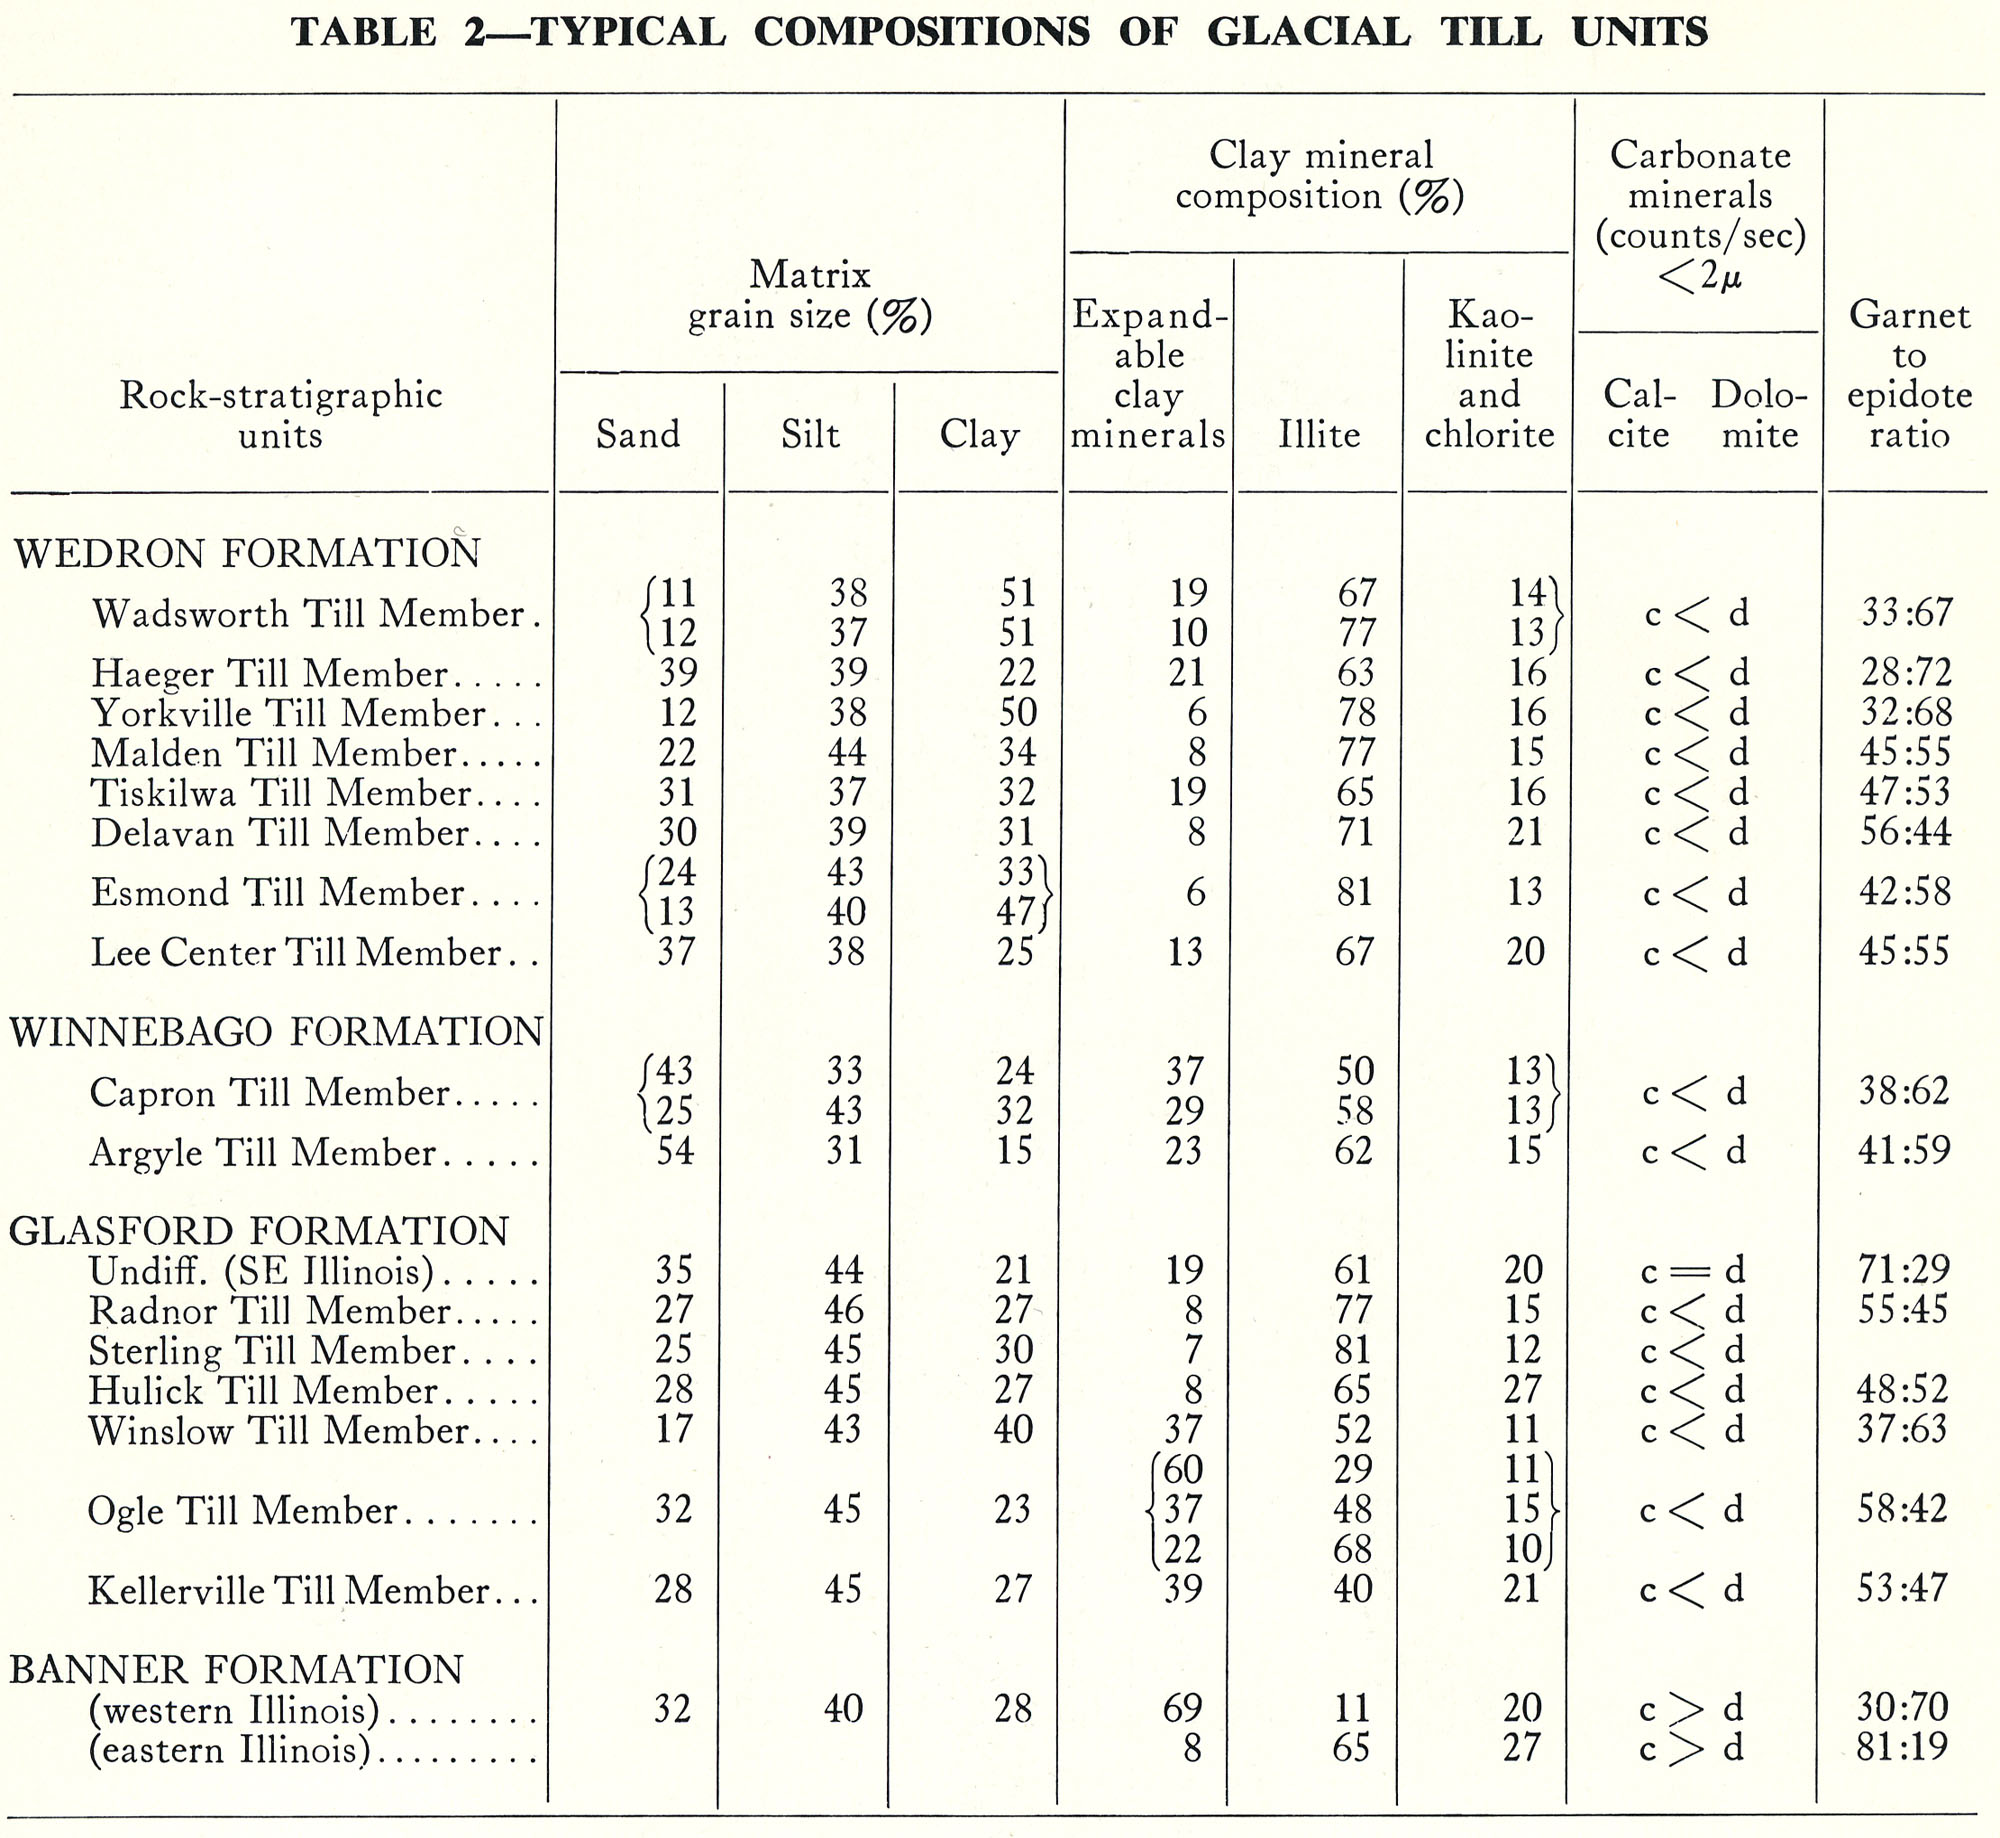
508 KB | Table 2 -- Typical Compositions of Glacial Till Units. | 1 |
| 16:57, 18 April 2016 | 94-tb 3.jpg (file) |  |
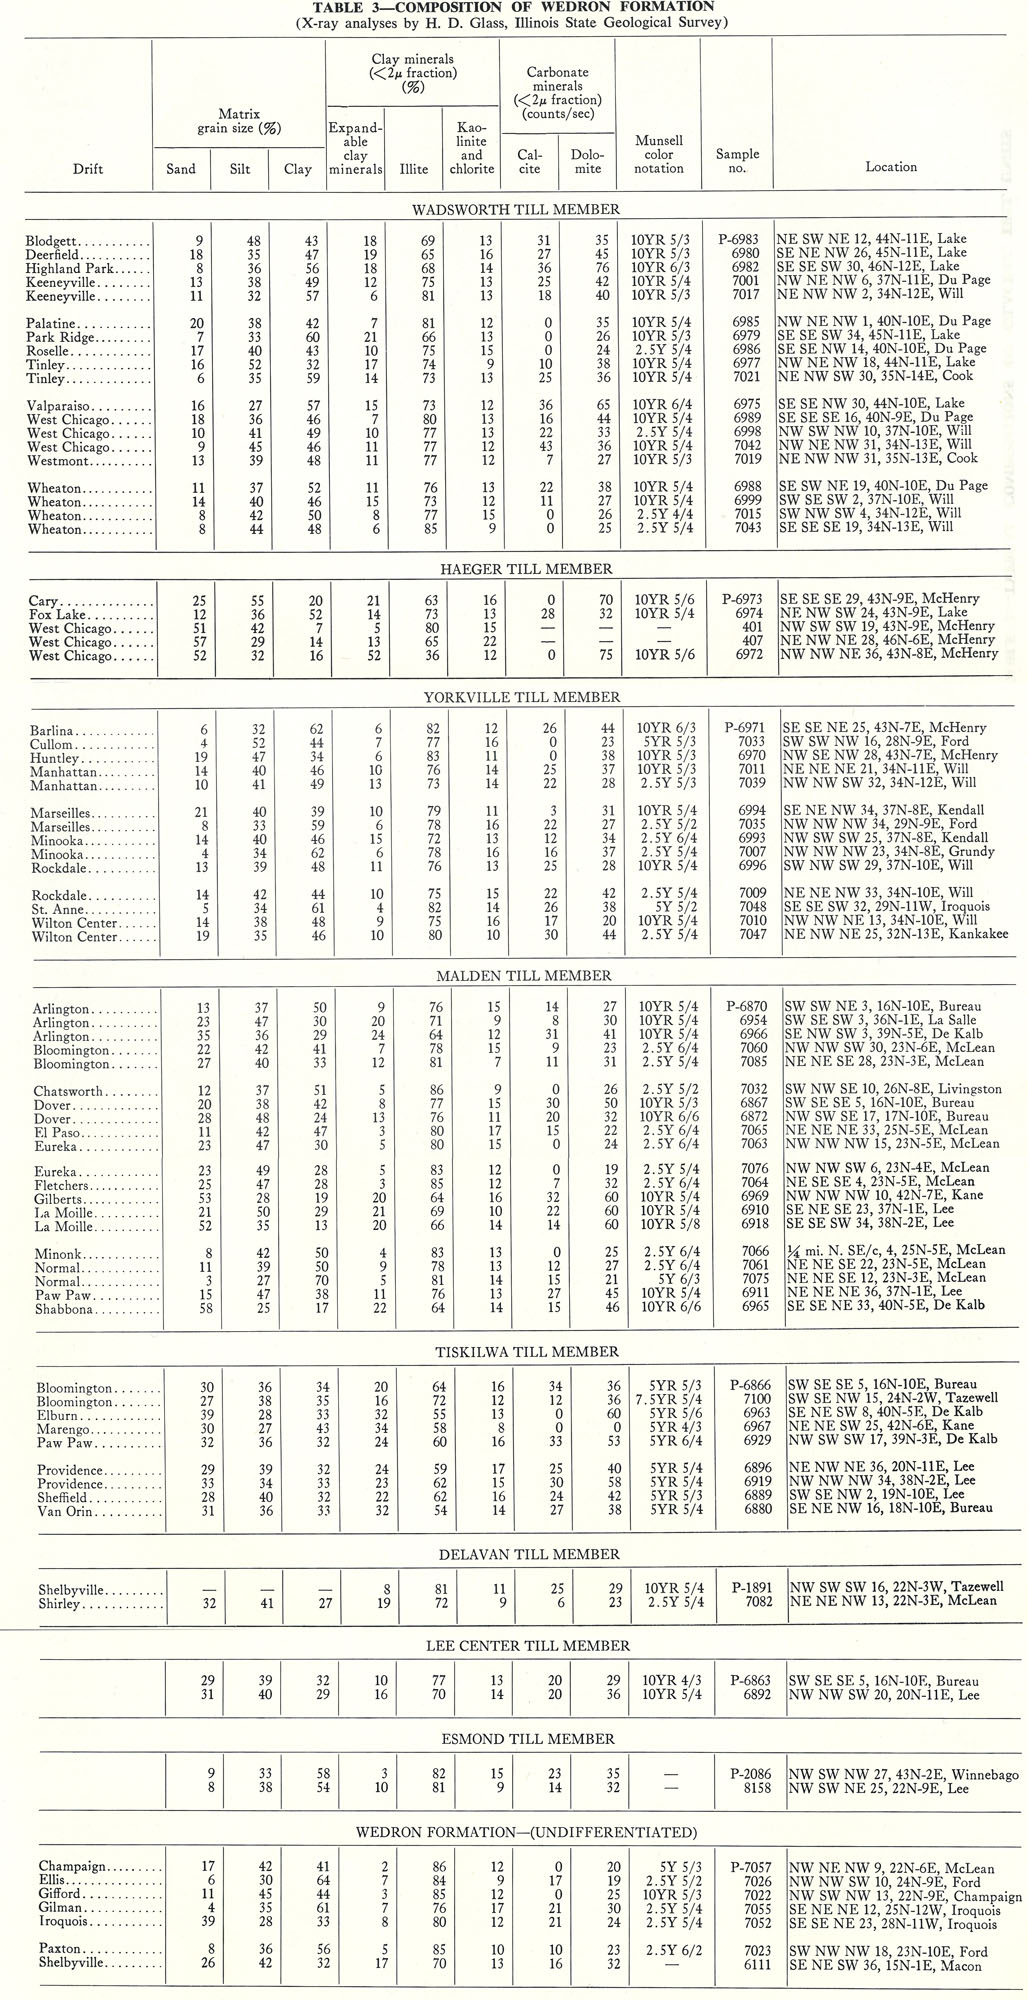
516 KB | Table 3 -- Composition of Wedron Formation (X-ray analyses by H. D. Glass, Illinois State Geological Survey). | 1 |
| 17:27, 18 April 2016 | 94-tb 7-g.jpg (file) |  |
525 KB | 1 | |
| 17:21, 18 April 2016 | 94-tb 6-k.jpg (file) |  |
533 KB | 1 | |
| 15:39, 1 April 2016 | Figure P-14.jpg (file) |  |
535 KB | Fig. P-14 -- Thickness of the Modesto Formation (based on map by K. E. Clegg). | 1 |
| 16:31, 19 April 2016 | 104-Figure 10.jpg (file) |  |
536 KB | Figure 10 -- Geochronological units, chronostratigraphic units and diachronic units in the Lake Michigan Lobe in a transect from south of Peoria, Illinois, to north of the Straits of Mackinac in Michigan (geochronologic and chronostratigraphic units ar... | 1 |
| 17:59, 13 April 2016 | 94-Fig 1.jpg (file) |  |
538 KB | Fig. 1 -- Stratigraphic classification of the Pleistocene deposits of Illinois. | 1 |
| 17:15, 18 April 2016 | 94-tb 6-a.jpg (file) |  |
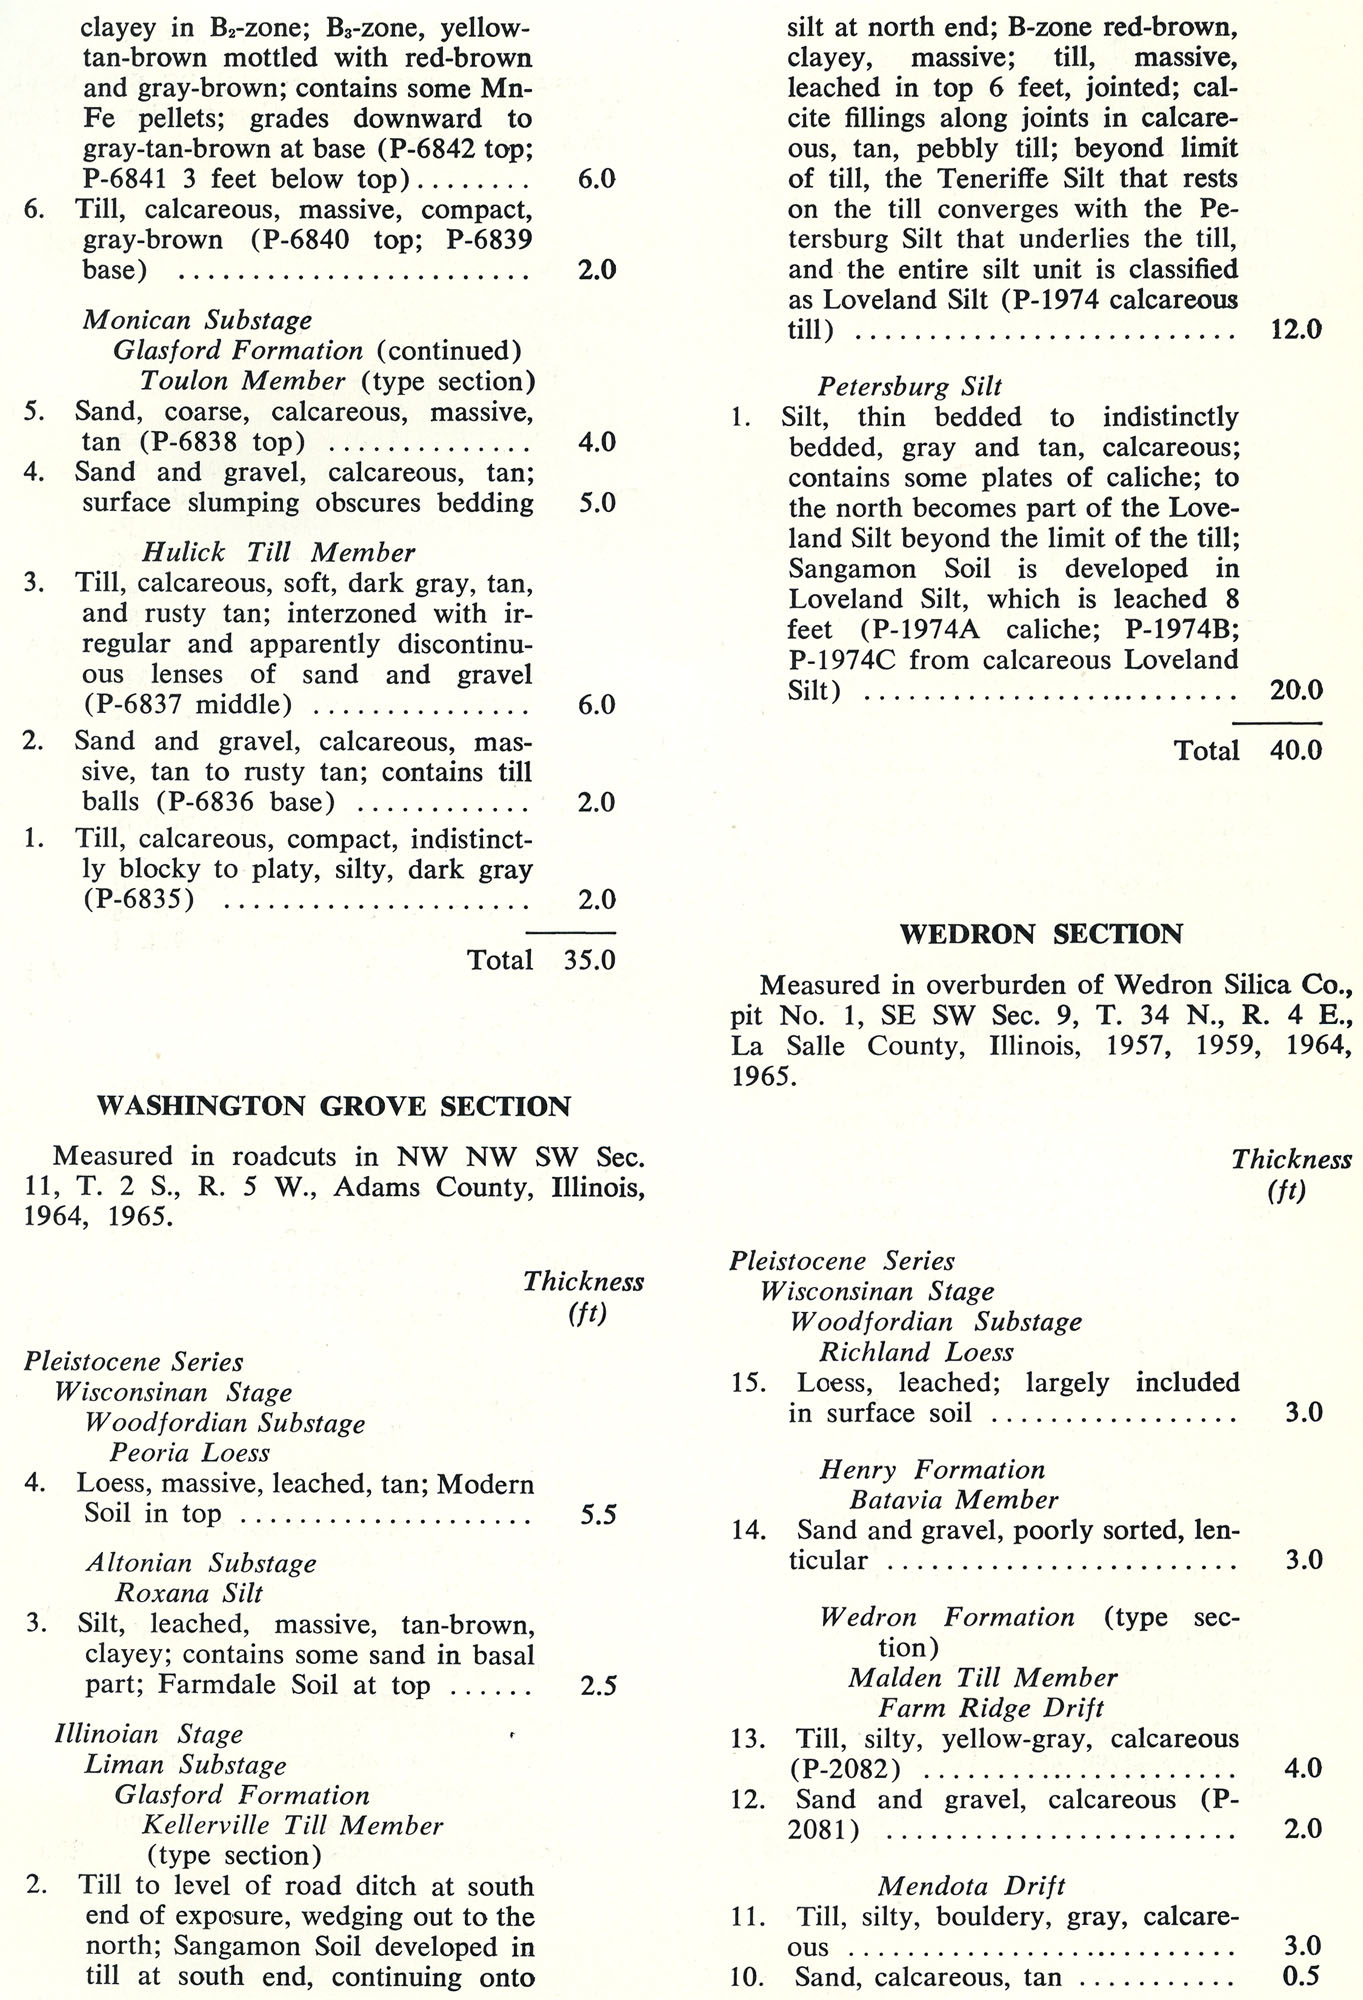
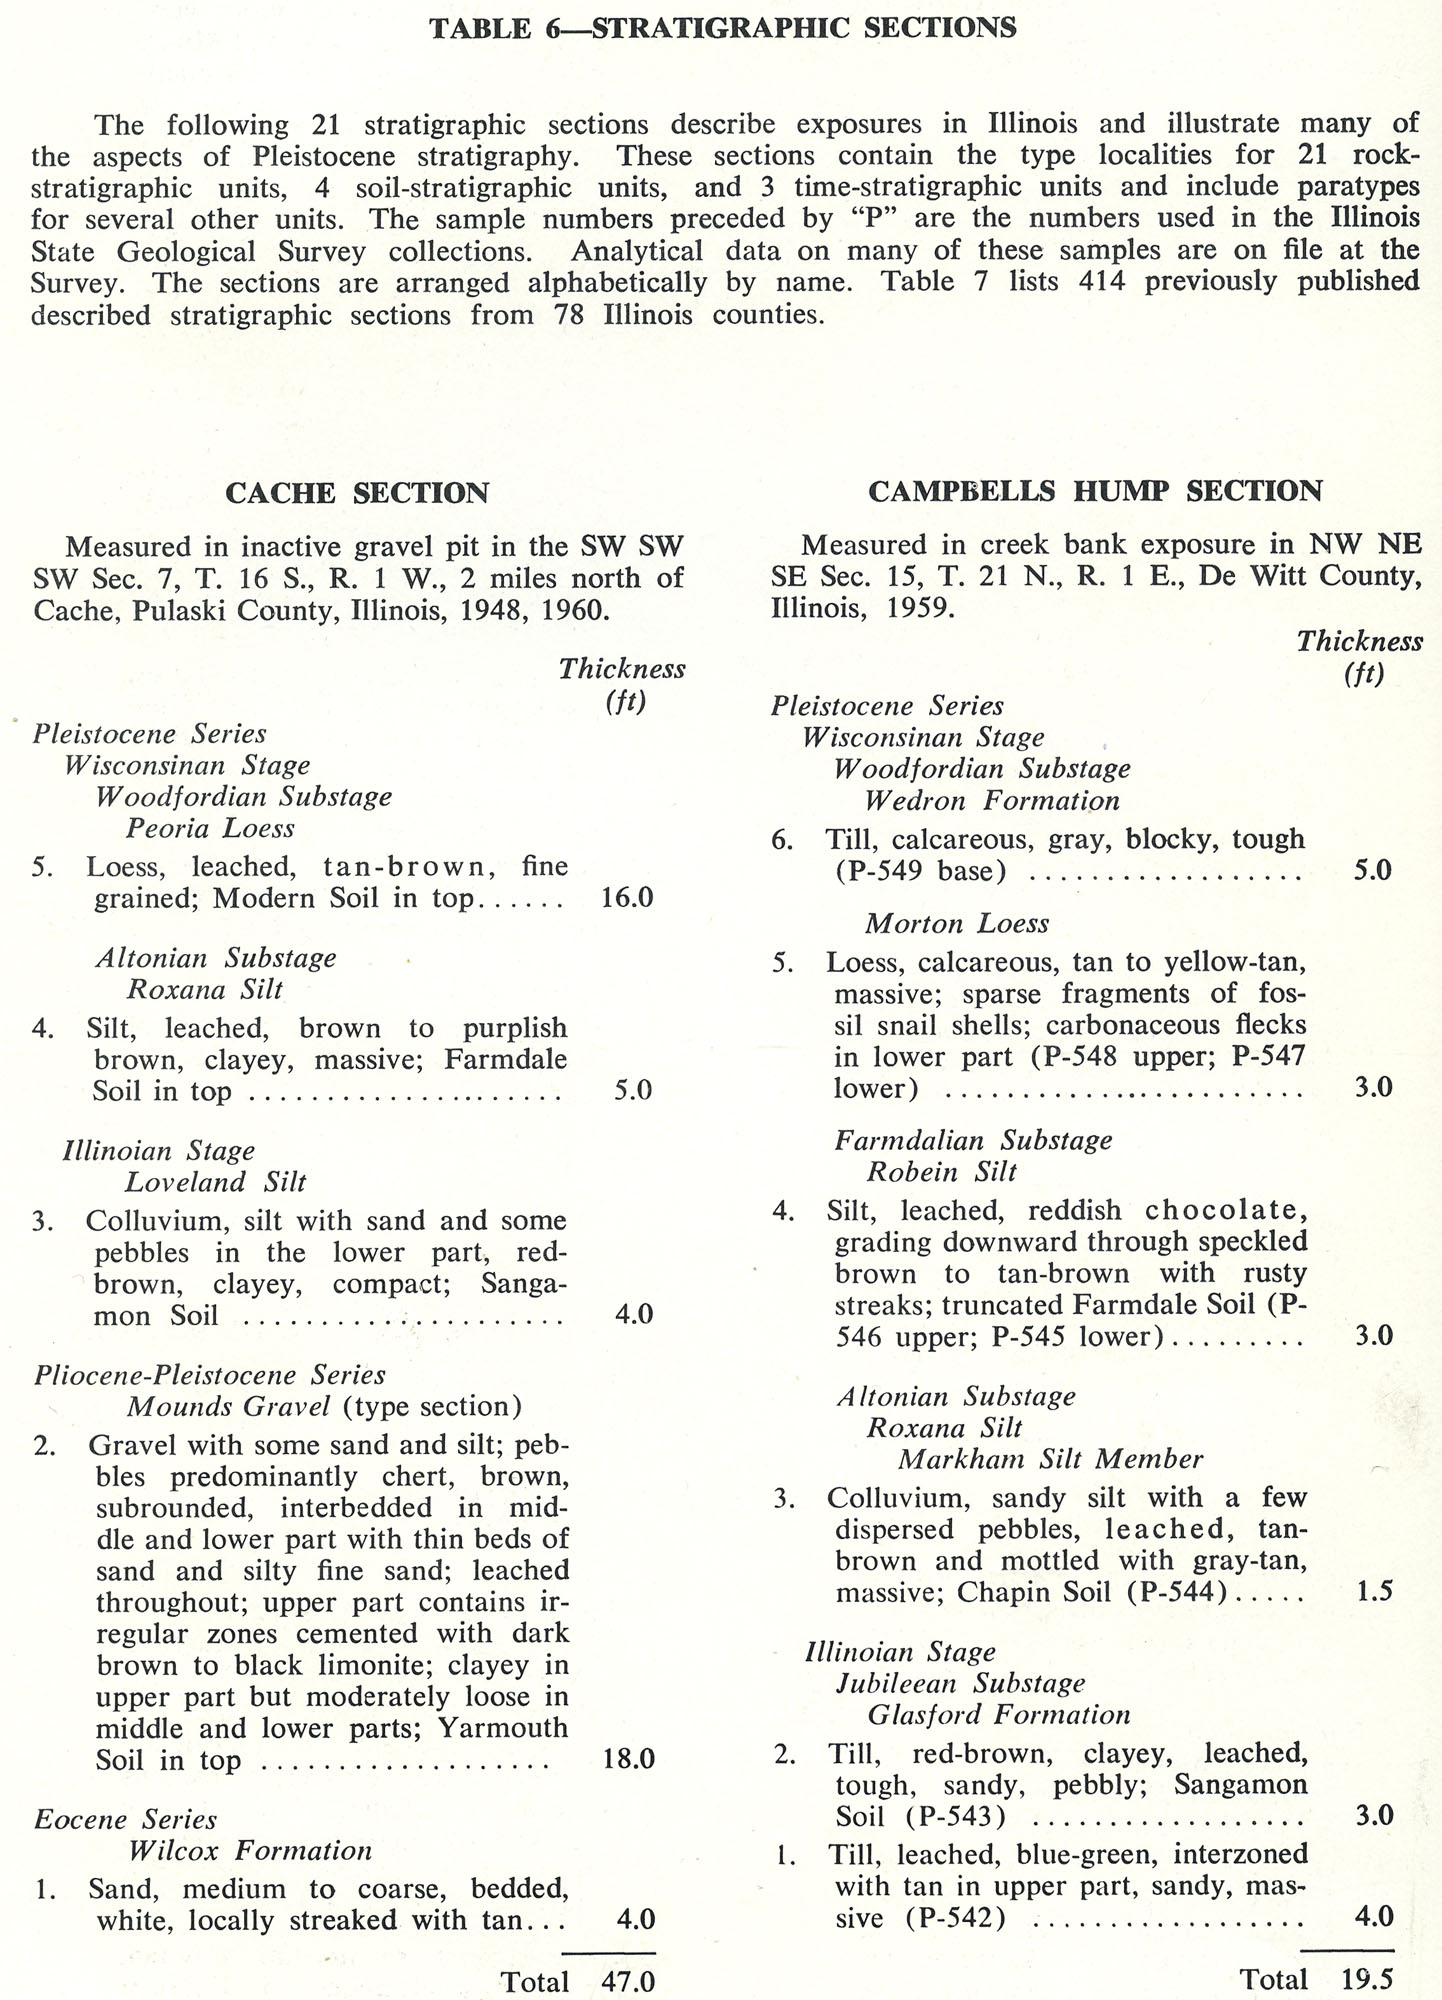
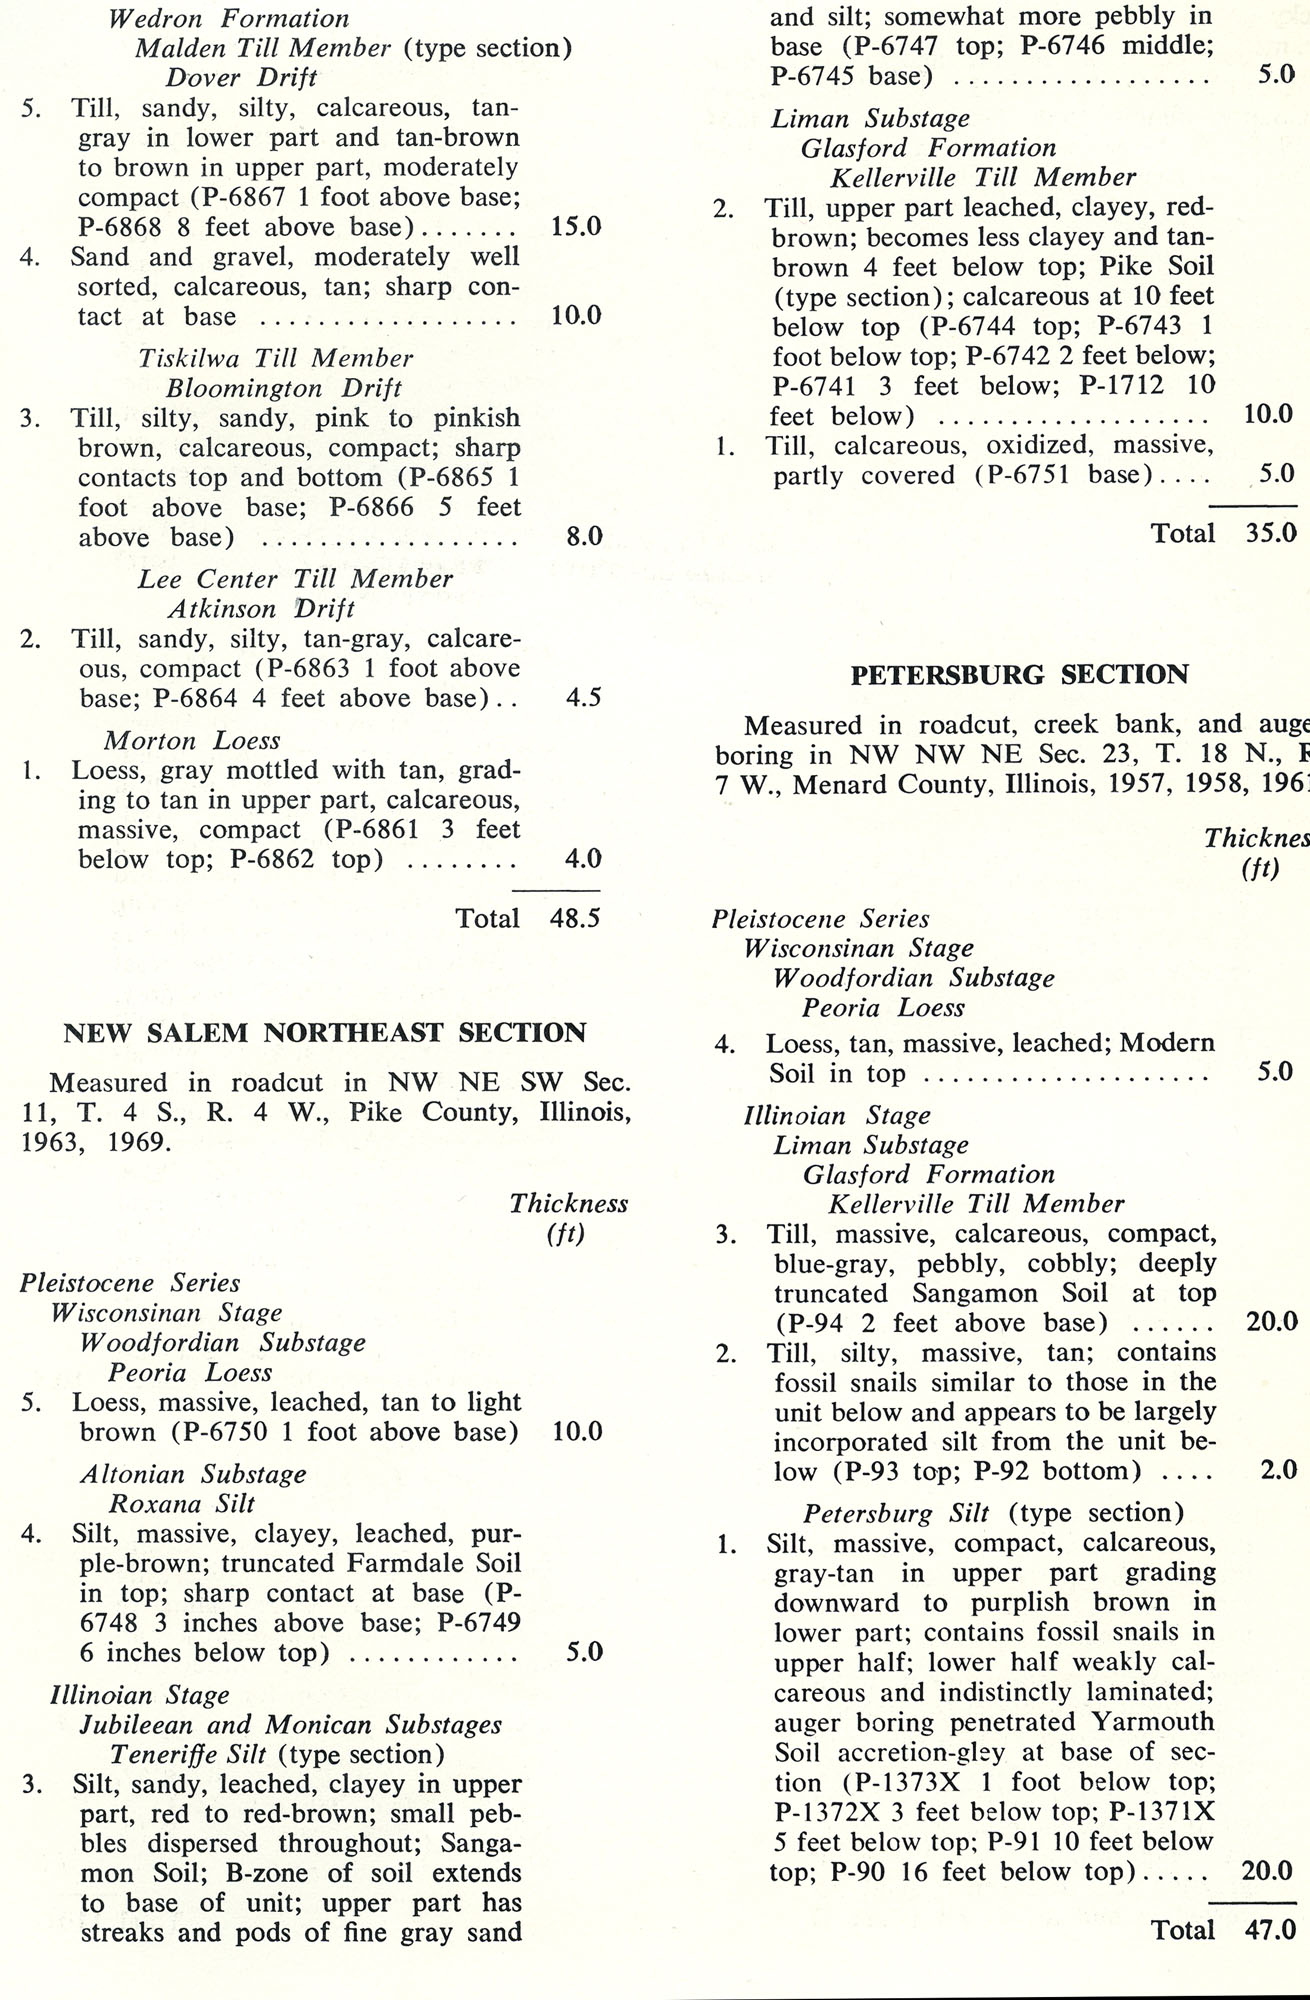
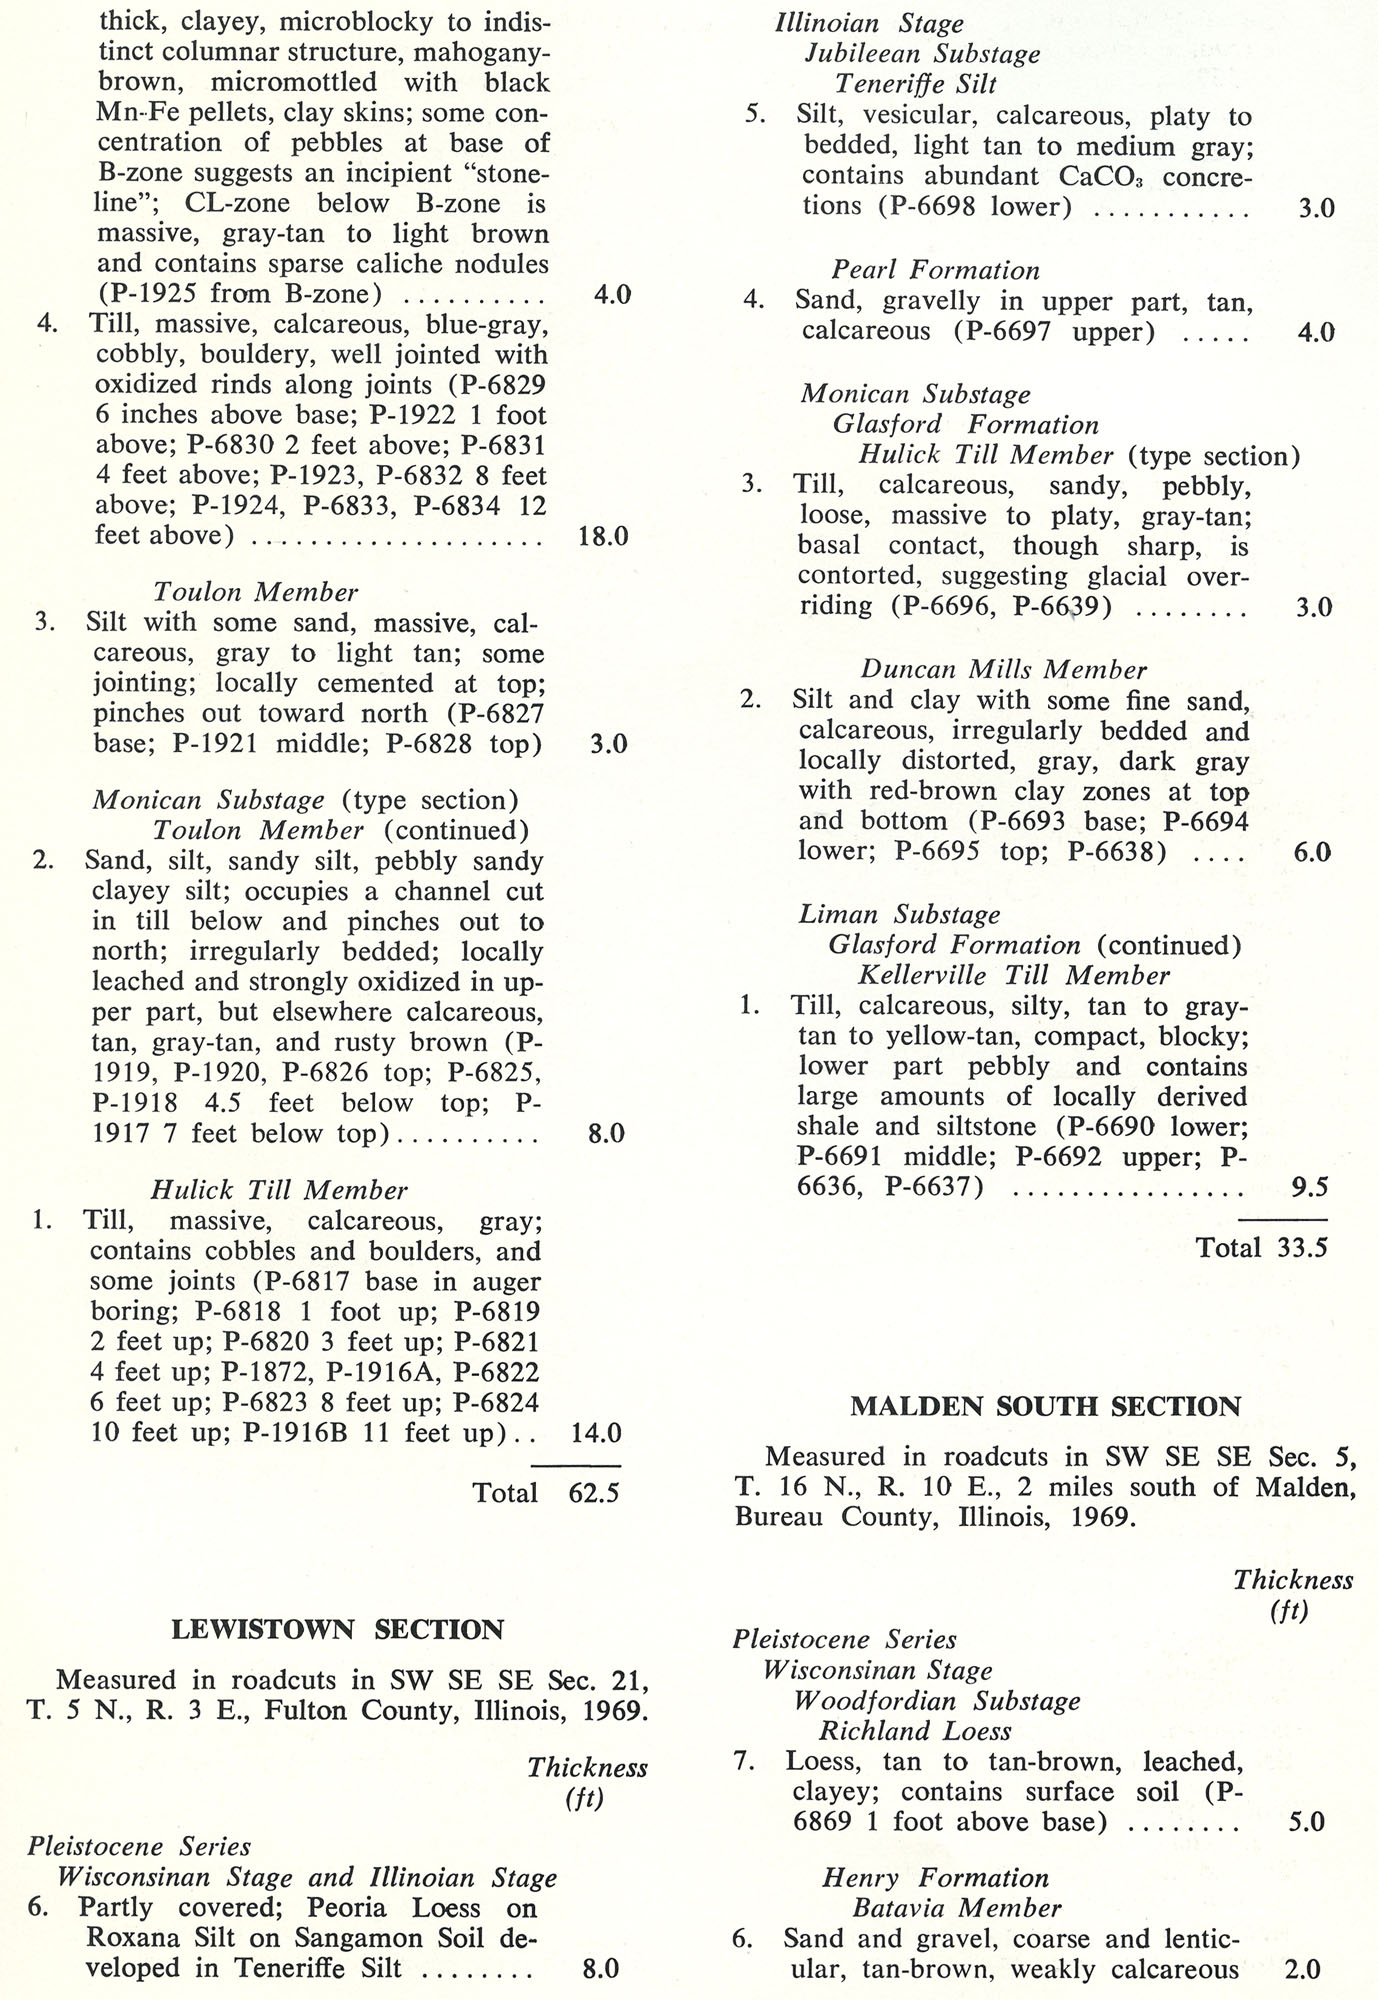
546 KB | Table 6 -- Stratigraphic Sections | 1 |
| 17:17, 18 April 2016 | 94-tb 6-e.jpg (file) |  |
555 KB | 1 | |
| 17:19, 18 April 2016 | 94-tb 6-g.jpg (file) |  |
555 KB | 1 | |
| 17:18, 18 April 2016 | 94-tb 6-f.jpg (file) |  |
560 KB | 1 | |
| 17:16, 18 April 2016 | 94-tb 6-b.jpg (file) |  |
561 KB | 1 |