File list
Jump to navigation
Jump to search
This special page shows all uploaded files.
| Date | Name | Thumbnail | Size | User | Description | Versions |
|---|---|---|---|---|---|---|
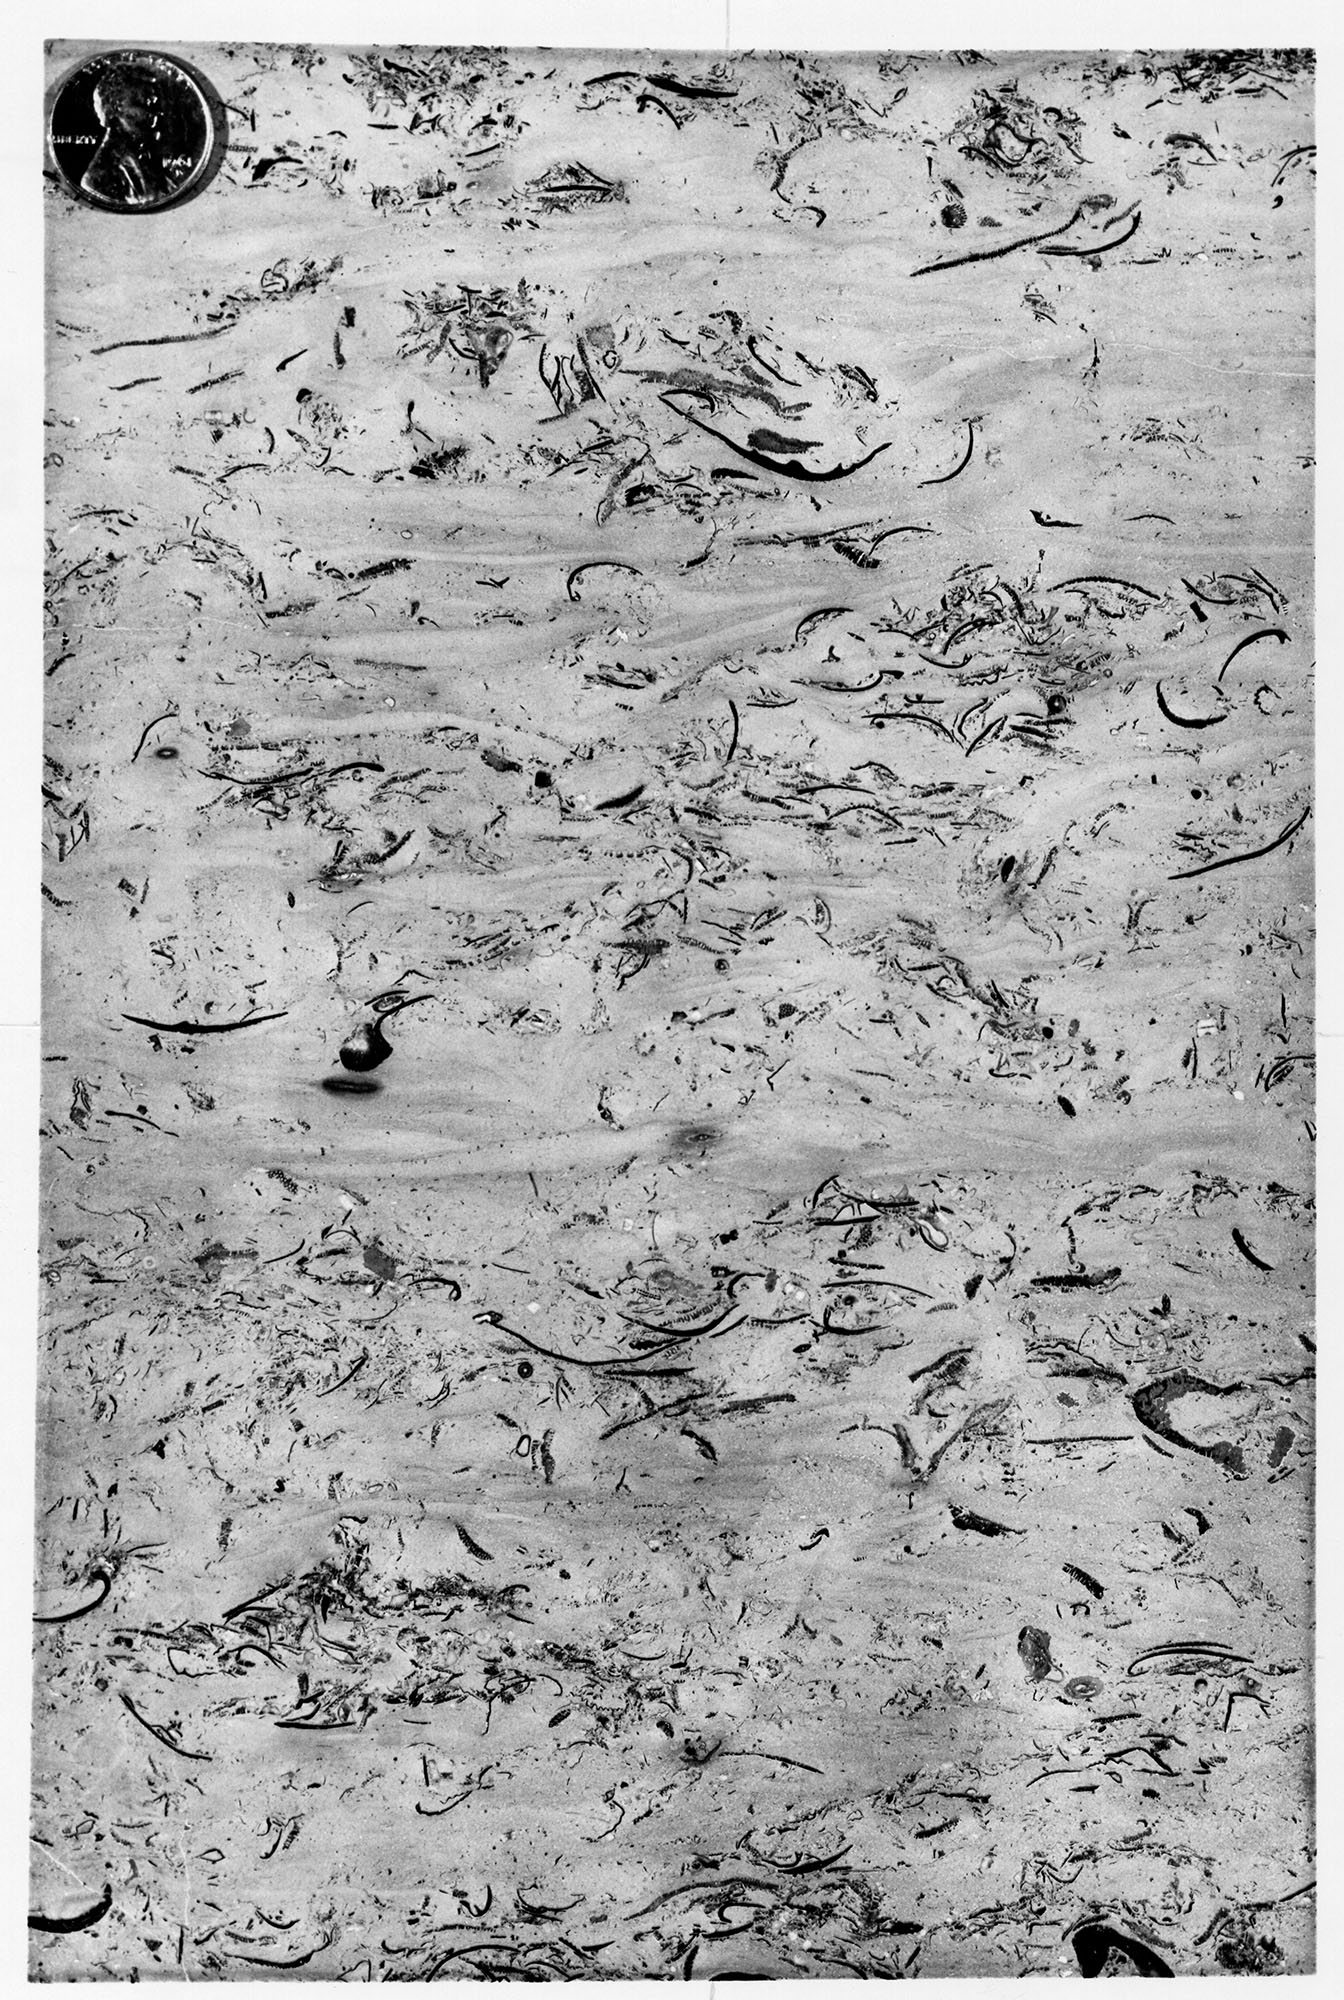
| 18:31, 4 April 2016 | Figure D-3D.jpg (file) |  |
732 KB | Alan.Myers | Fig. D-3D -- Fine-grained, fossiliferous limestone characteristic of Cedar Valley Limestone in the Rock Island area, Rock Island County (x1). | 1 |
| 18:29, 4 April 2016 | Figure D-3C.jpg (file) |  |
601 KB | Alan.Myers | Fig. D-3C -- Cedar Valley (CV) and Wapsipinicon (W) Limestone in Collinson Stone Company Quarry, 1 mile southeast of Milan, Rock Island County. The Rock face is about 70 feet high. | 2 |
| 18:22, 4 April 2016 | Figure D-3B.jpg (file) |  |
690 KB | Alan.Myers | Fig. D-3B -- Bailey Limestone in Pine Hills (Mississippi River bluffs), 5 miles north of Wolf Lake, Union County. | 1 |
| 18:21, 4 April 2016 | Figure D-3A.jpg (file) |  |
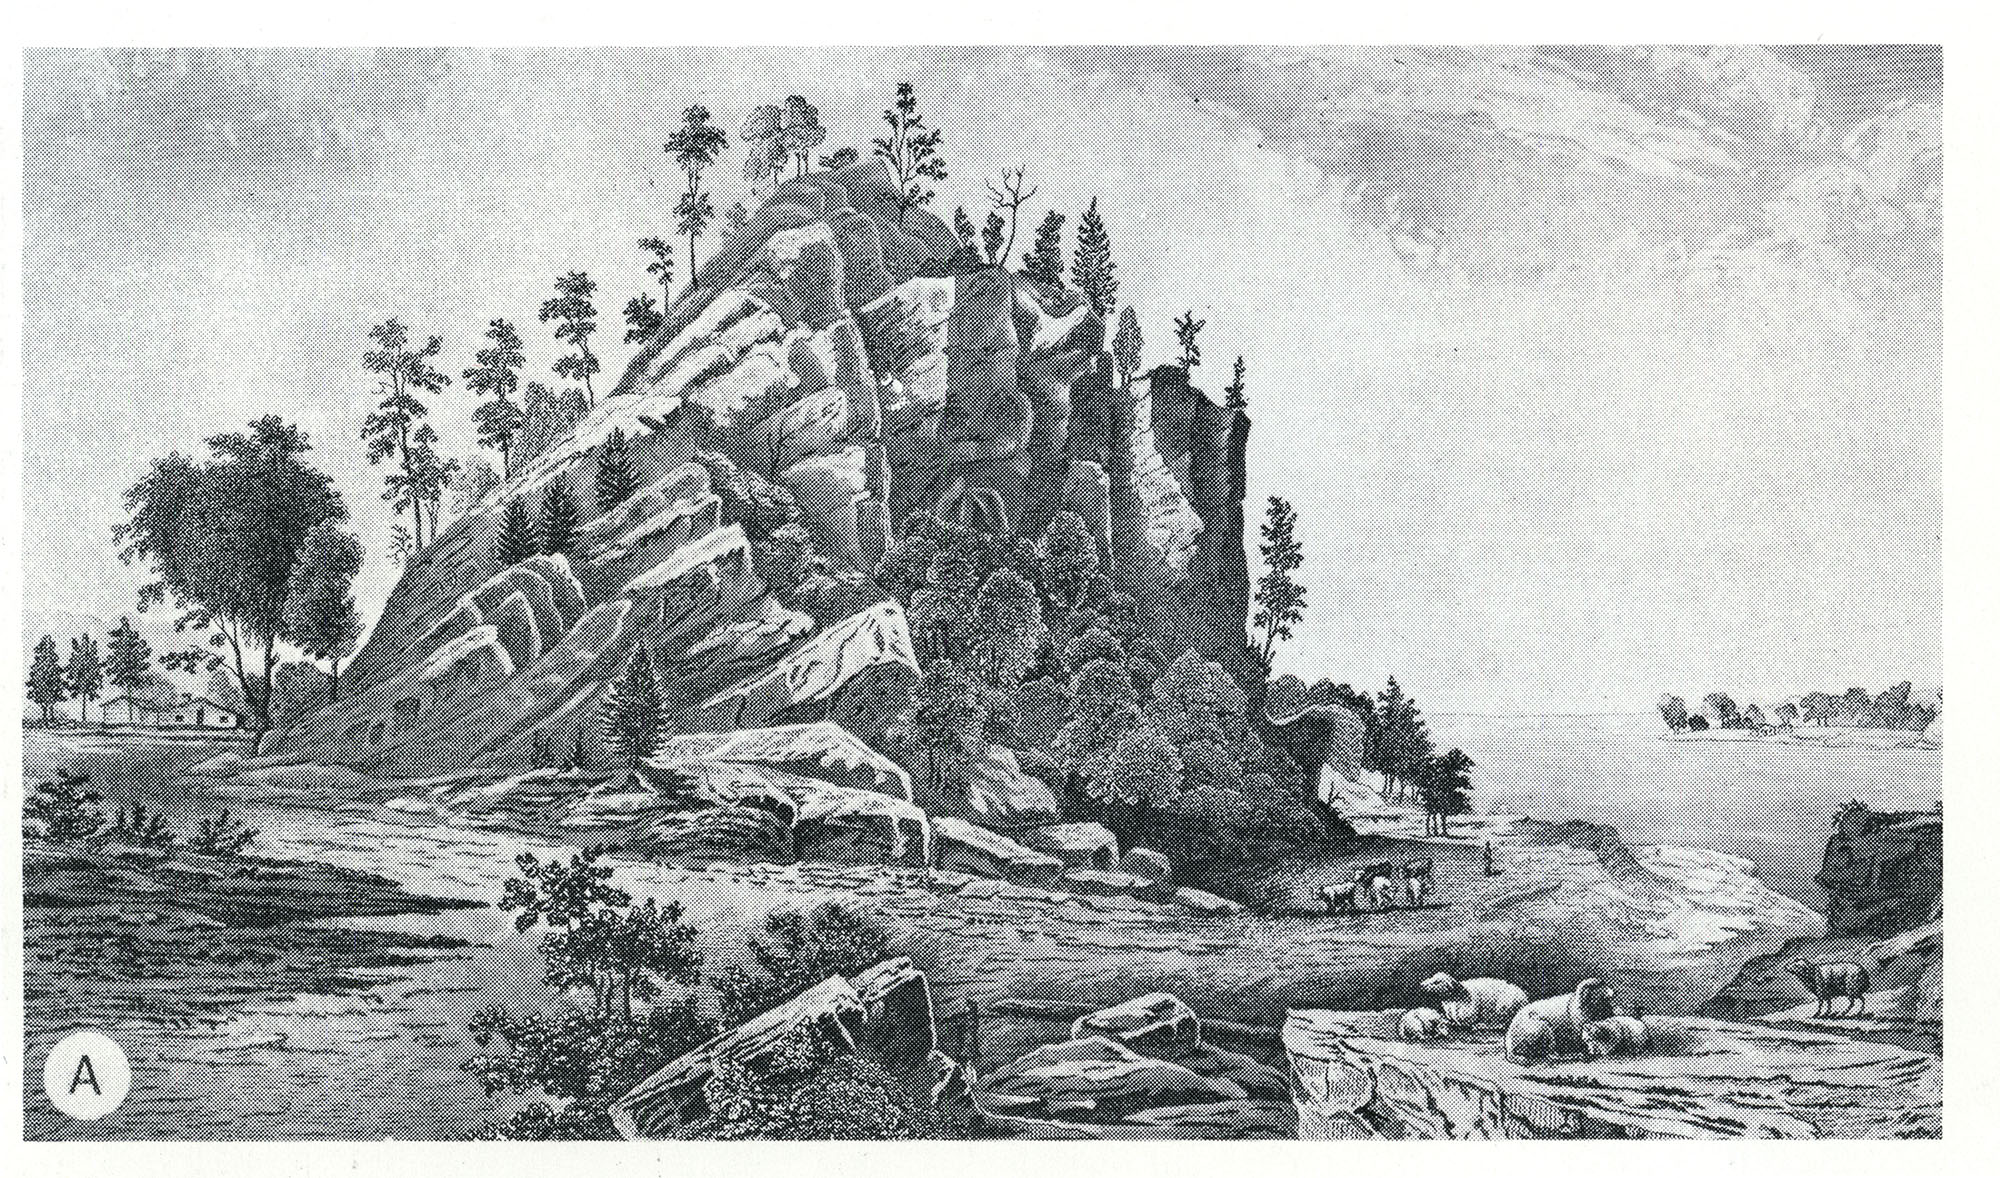
1.04 MB | Alan.Myers | Fig. D-3A -- Middle Devonian Limestone (Lingle and Grand Tower) in ridge ("the Backbone") along the Mississippi River north of Grand Tower, Jackson County (from Worthen, 1868, opp. p. 61). | 1 |
| 18:18, 4 April 2016 | Figure C-1D.jpg (file) |  |
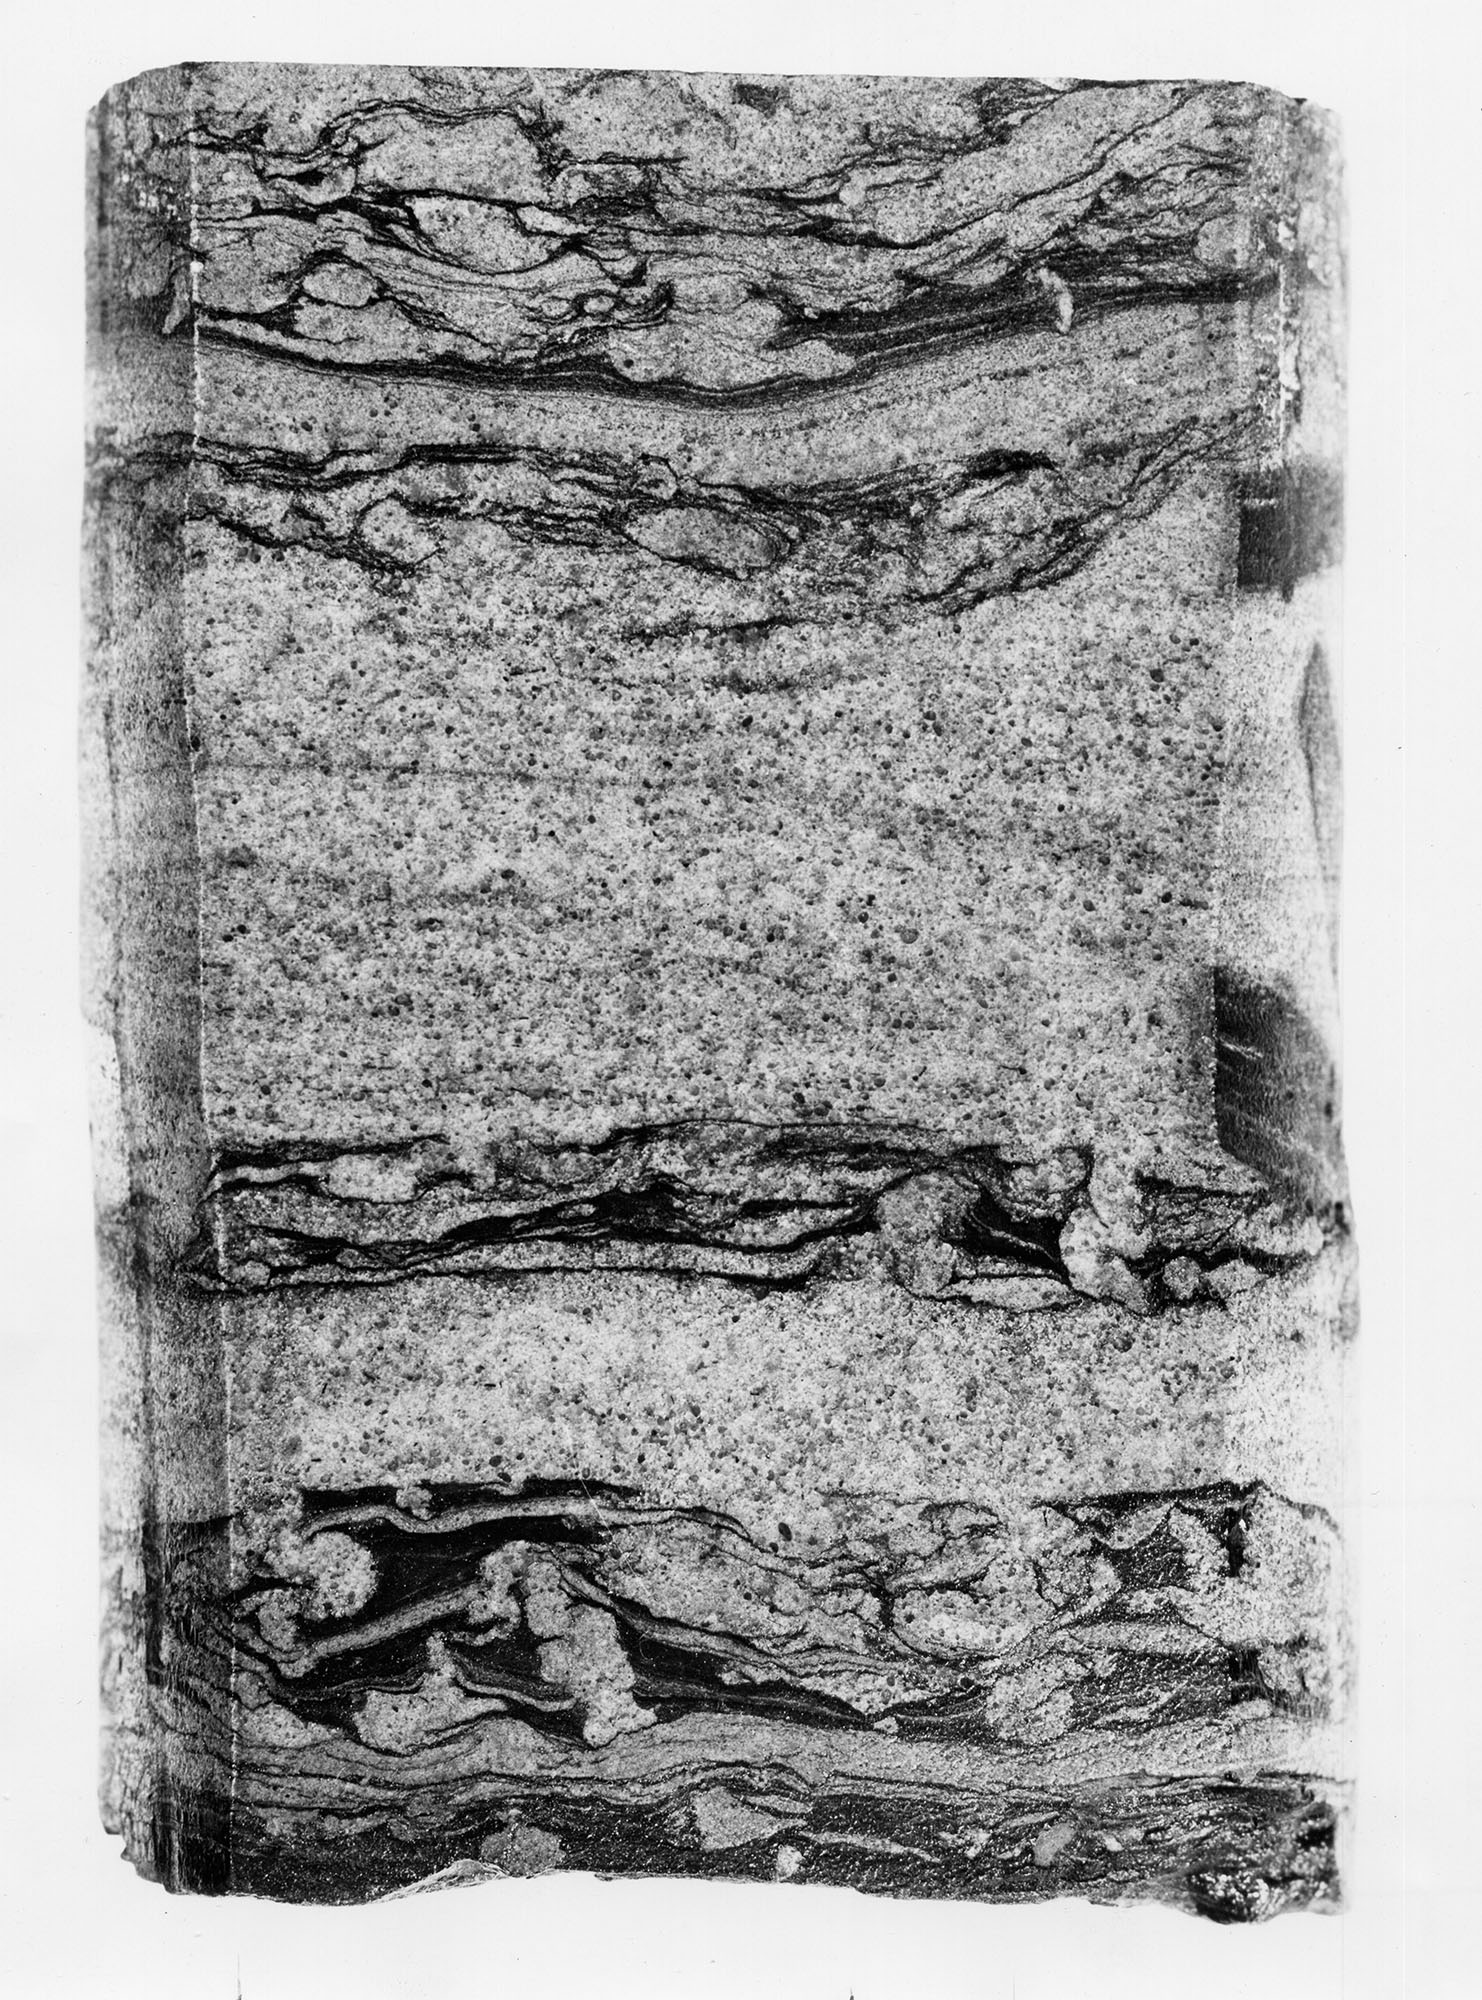
776 KB | Alan.Myers | Fig. C-1D -- Core of Ironton Sandstone showing flat-pebble conglomerate; from boring in Champaign county (x2). | 1 |
| 18:17, 4 April 2016 | Figure C-1C.jpg (file) |  |
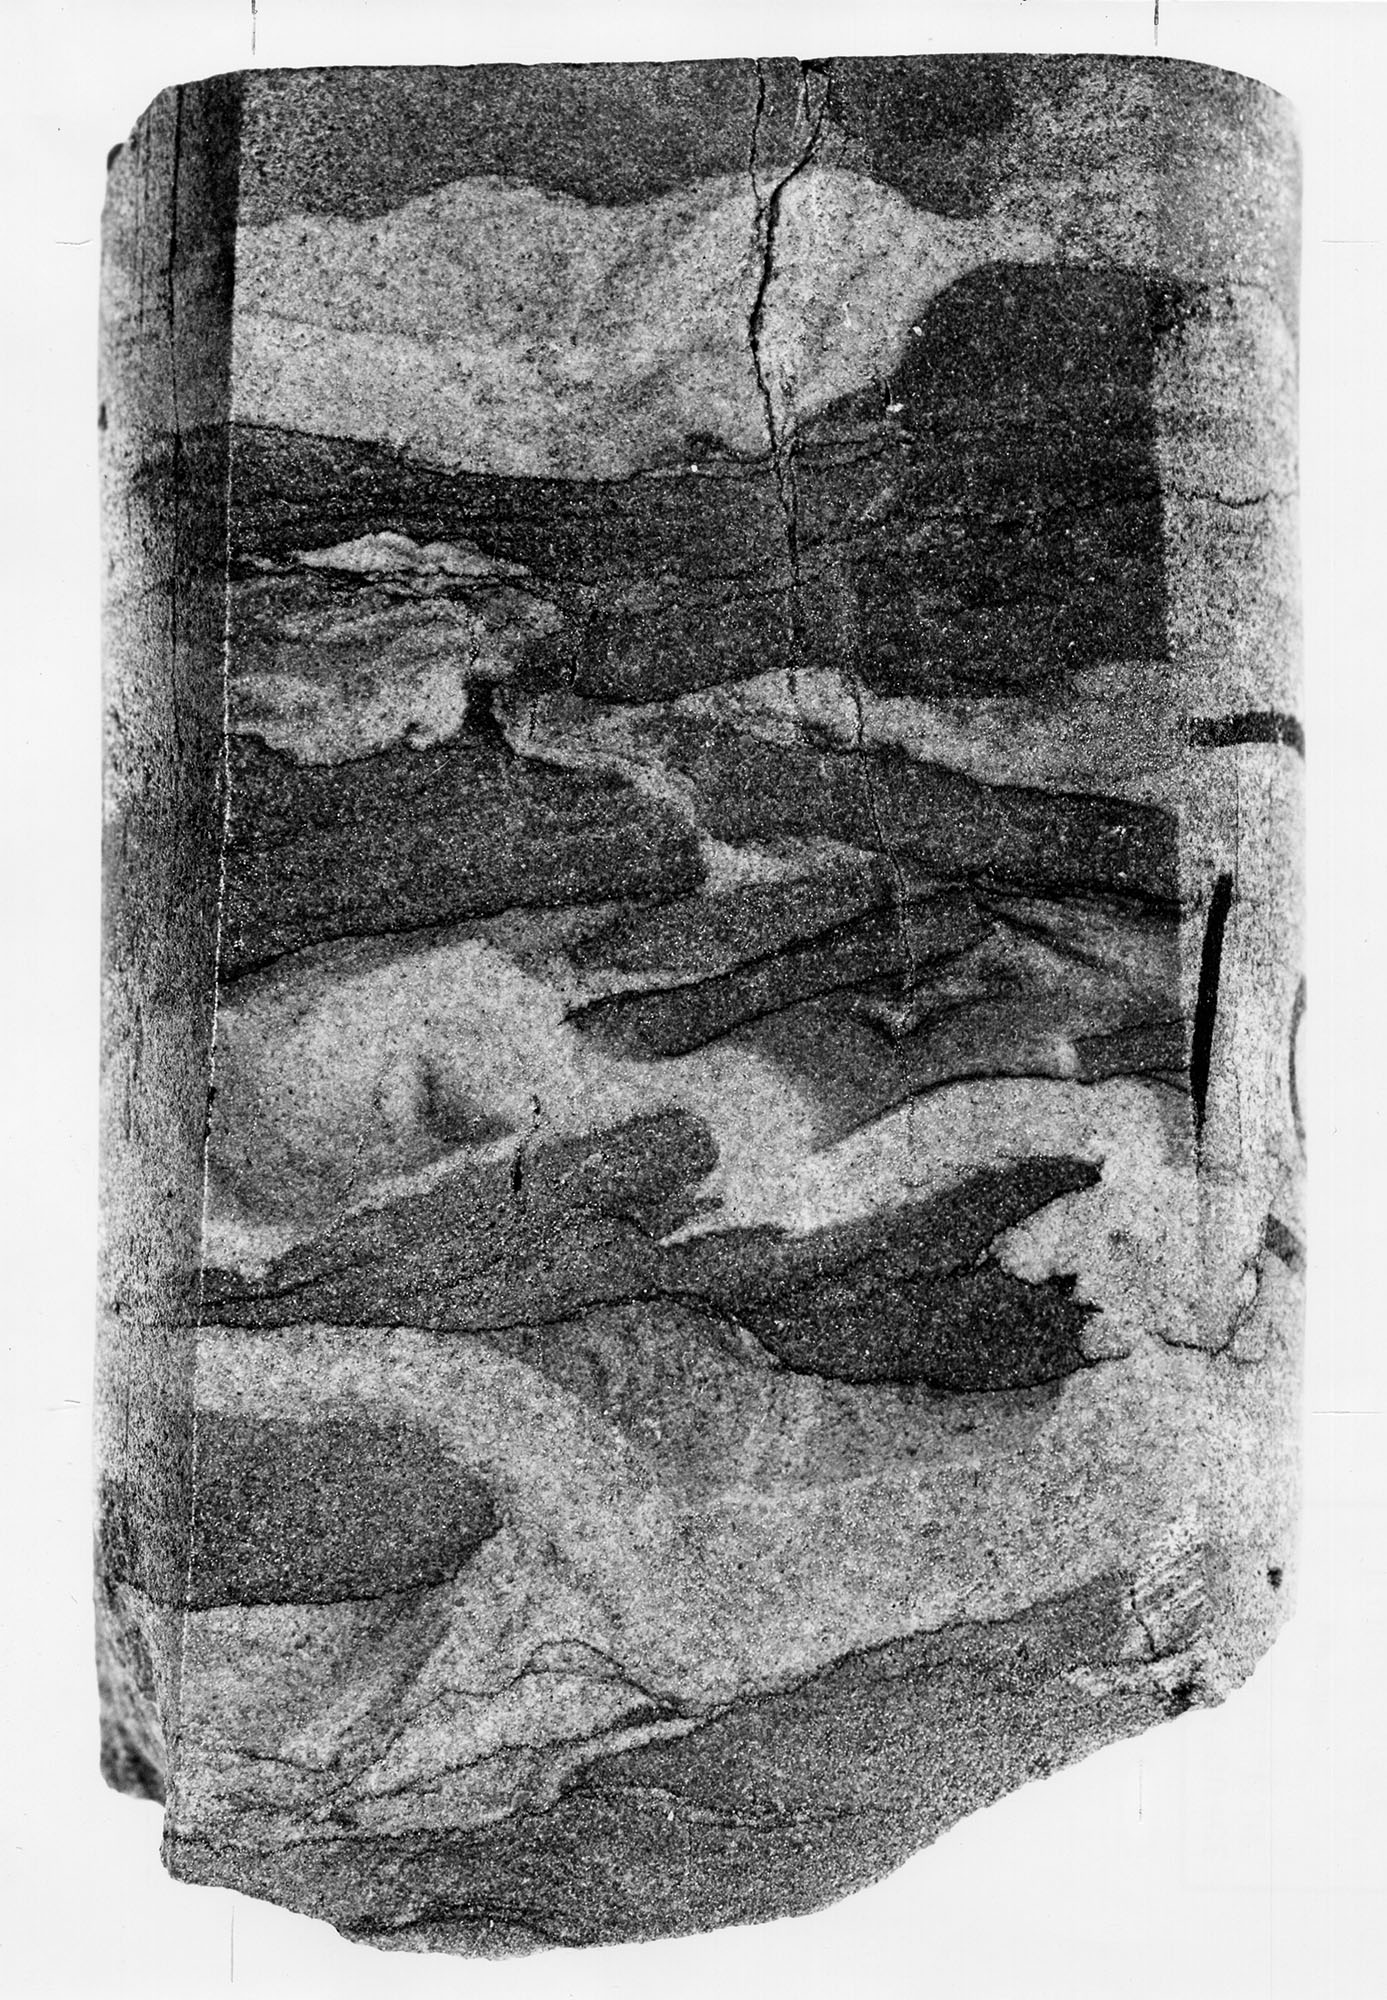
788 KB | Alan.Myers | Fig. C-1C -- Core of Eau Clair Formation showing penecontemporaneous deformation of shale beds in shaly sanstone; from a boring in Champaign County (x2). | 1 |
| 18:15, 4 April 2016 | Figure C-1B.jpg (file) |  |
1.18 MB | Alan.Myers | Fig. C-1B -- Cambrian-Ordovician unconformity showing well bedded Oneota Dolomite overlying massive Potosi Dolomite in a quarry in Lee County, 6 miles south of Rochelle, Ogle County (Willman and Templeton, 1951, p. 113). | 1 |
| 18:12, 4 April 2016 | Figure C-1A.jpg (file) |  |
1,023 KB | Alan.Myers | Fig. C1-A -- Massive Potosi Dolomite in a quarry 4 miles northwest of Ashton, Ogle County. | 1 |
| 18:09, 4 April 2016 | Table 3.jpg (file) |  |
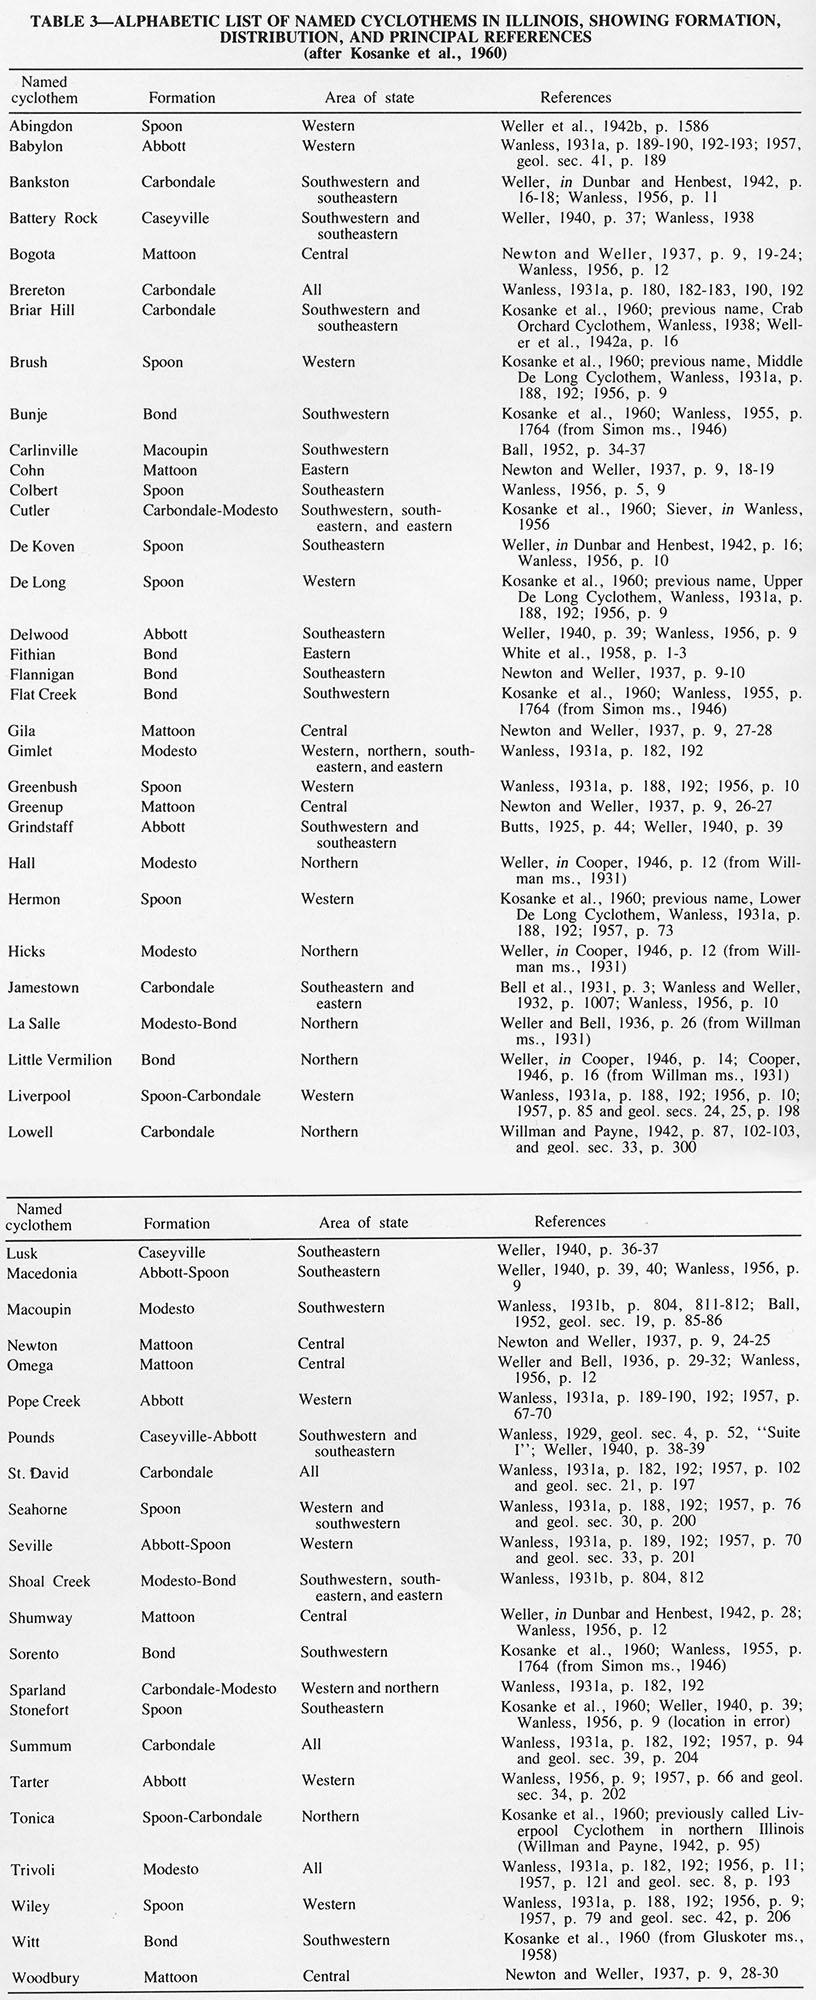
371 KB | Alan.Myers | Table 3 -- Alphabetic list of named cyclothems in Illinois, showing formation, distribution, and principal references (after Kosanke et al., 1960). | 1 |
| 18:07, 4 April 2016 | Table 2.jpg (file) |  |
236 KB | Alan.Myers | Table 2 -- Illinois Mineral Production in 1972 (Malhotra, 1974). | 1 |
| 18:06, 4 April 2016 | Table 1.jpg (file) |  |
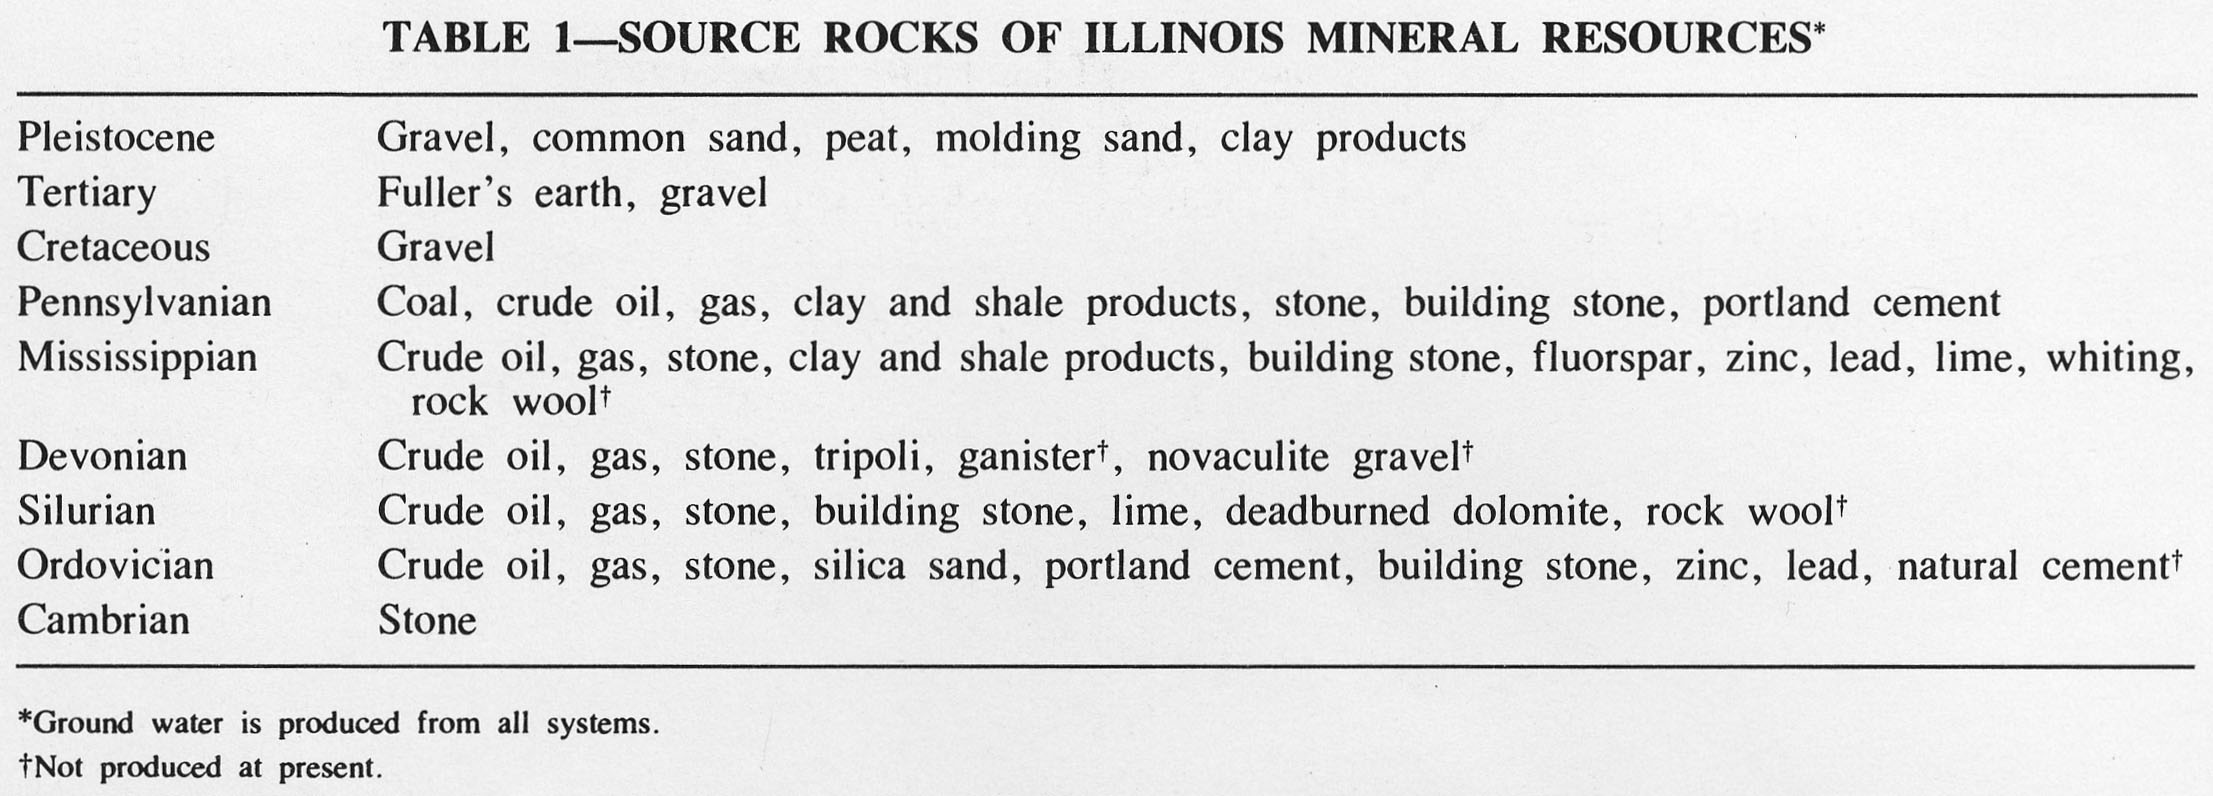
241 KB | Alan.Myers | Table 1 -- Source Rocks of Illinois Mineral Resources. | 1 |
| 18:05, 4 April 2016 | Figure T-2.jpg (file) |  |
233 KB | Alan.Myers | Fig. T-2 -- Classification of the Tertiary System. | 1 |
| 18:04, 4 April 2016 | Figure T-1.jpg (file) |  |
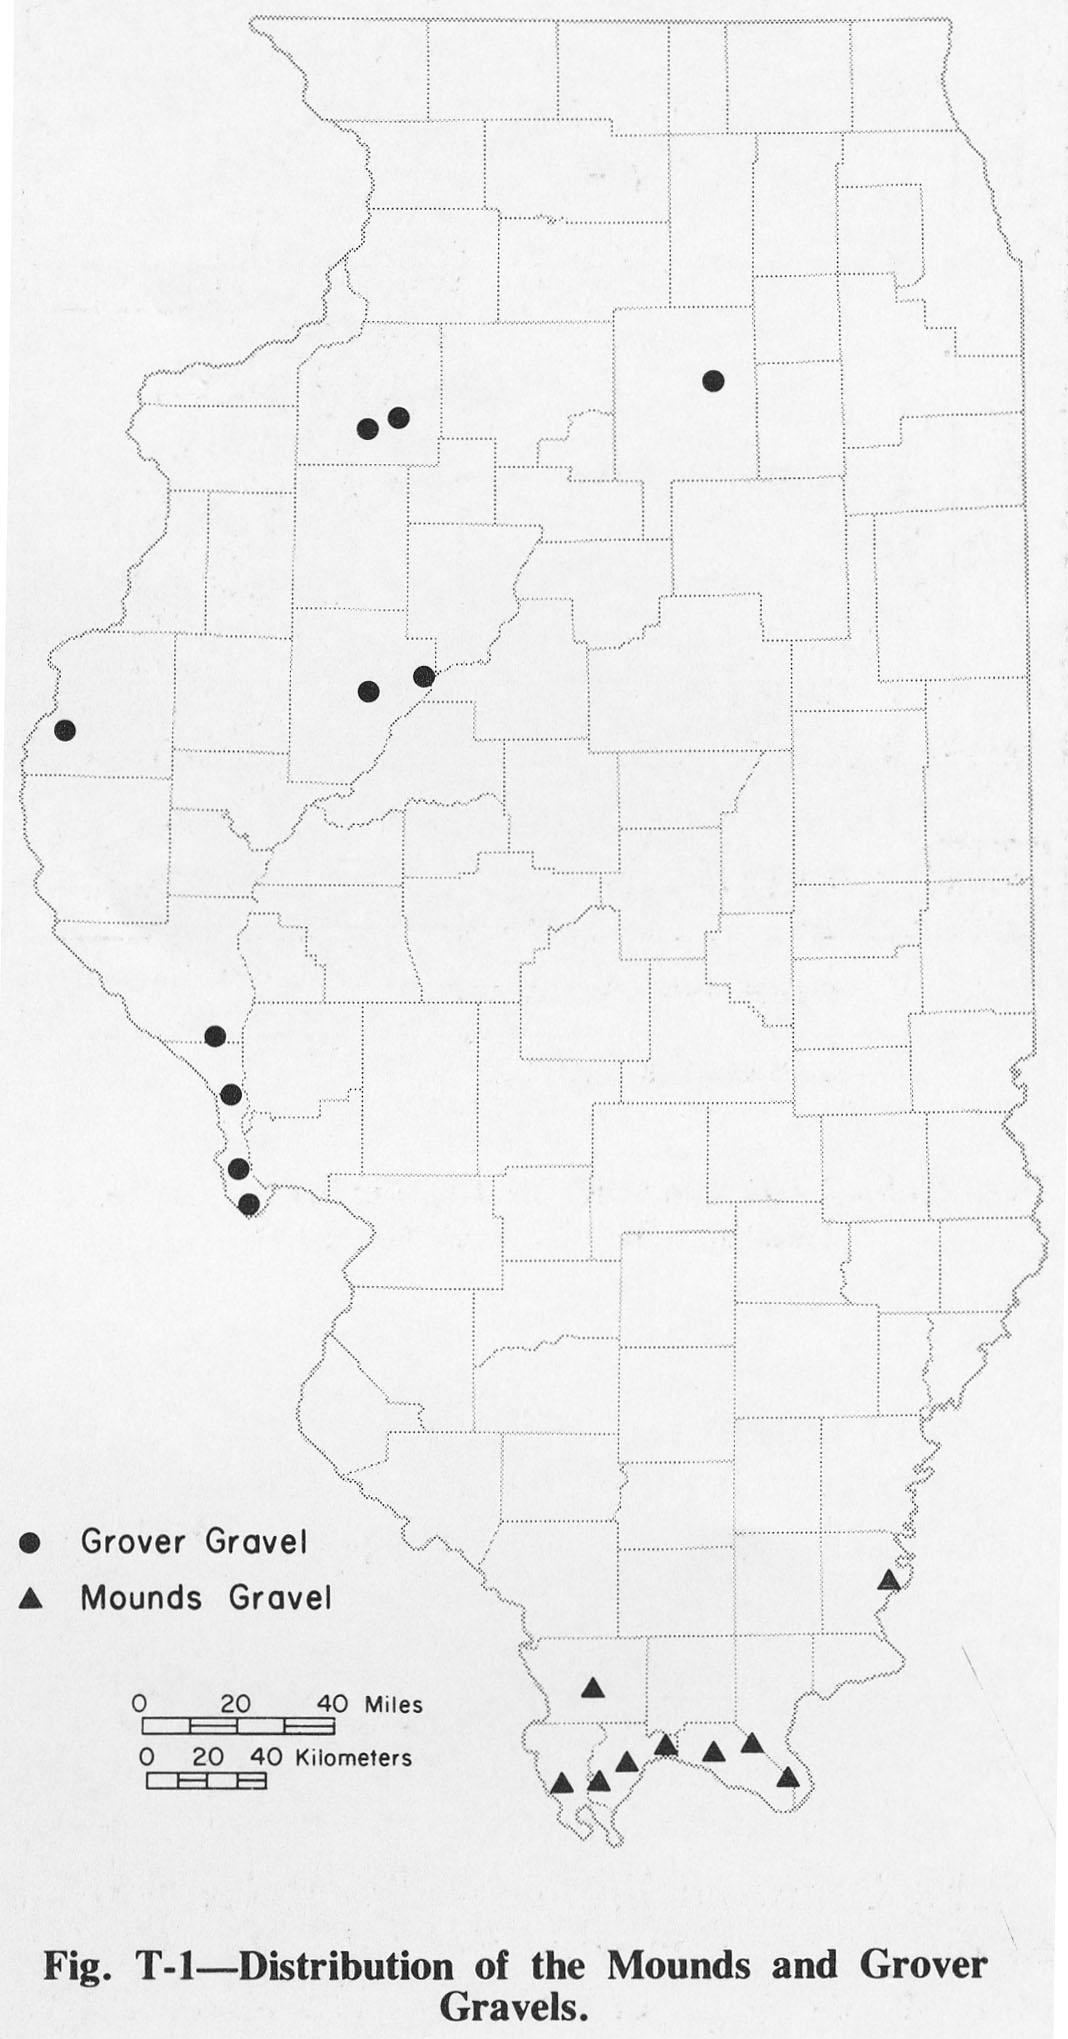
209 KB | Alan.Myers | Fig. T-1 -- Distribution of the Mounds and Grover Gravels. | 1 |
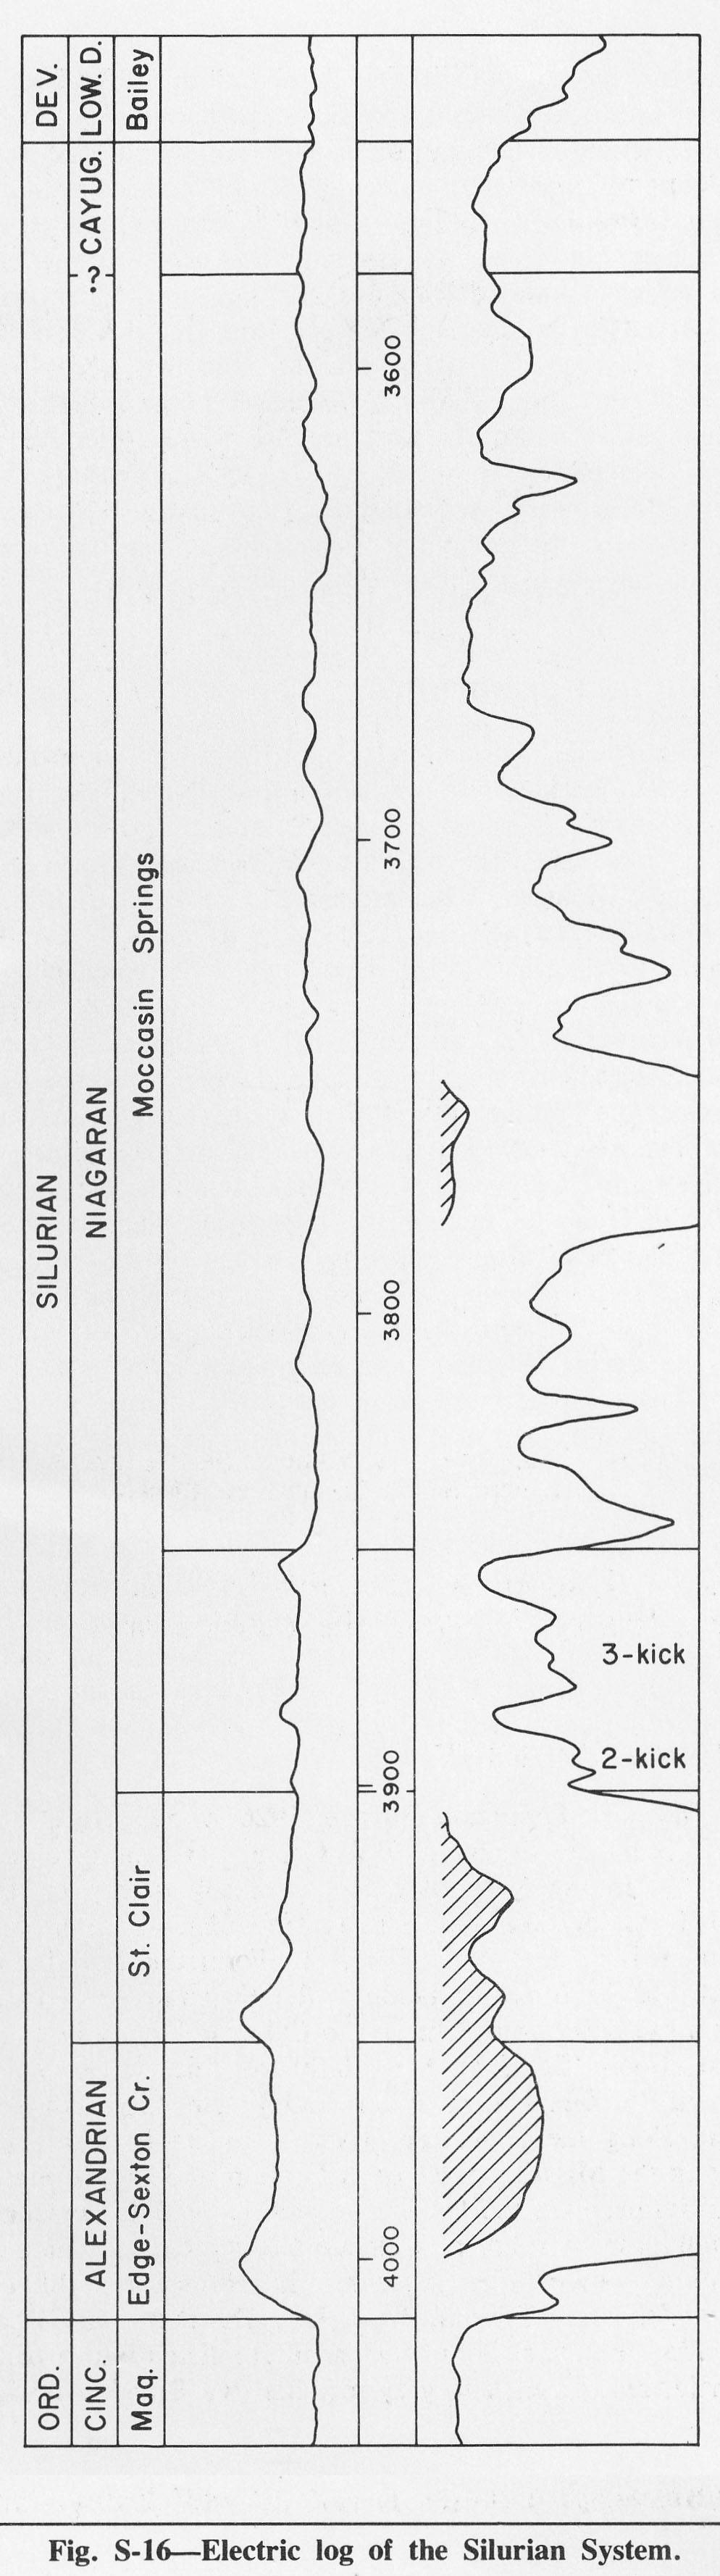
| 18:02, 4 April 2016 | Figure S-16.jpg (file) |  |
323 KB | Alan.Myers | Fig. S-16 -- Electric log of the Silurian System. | 1 |
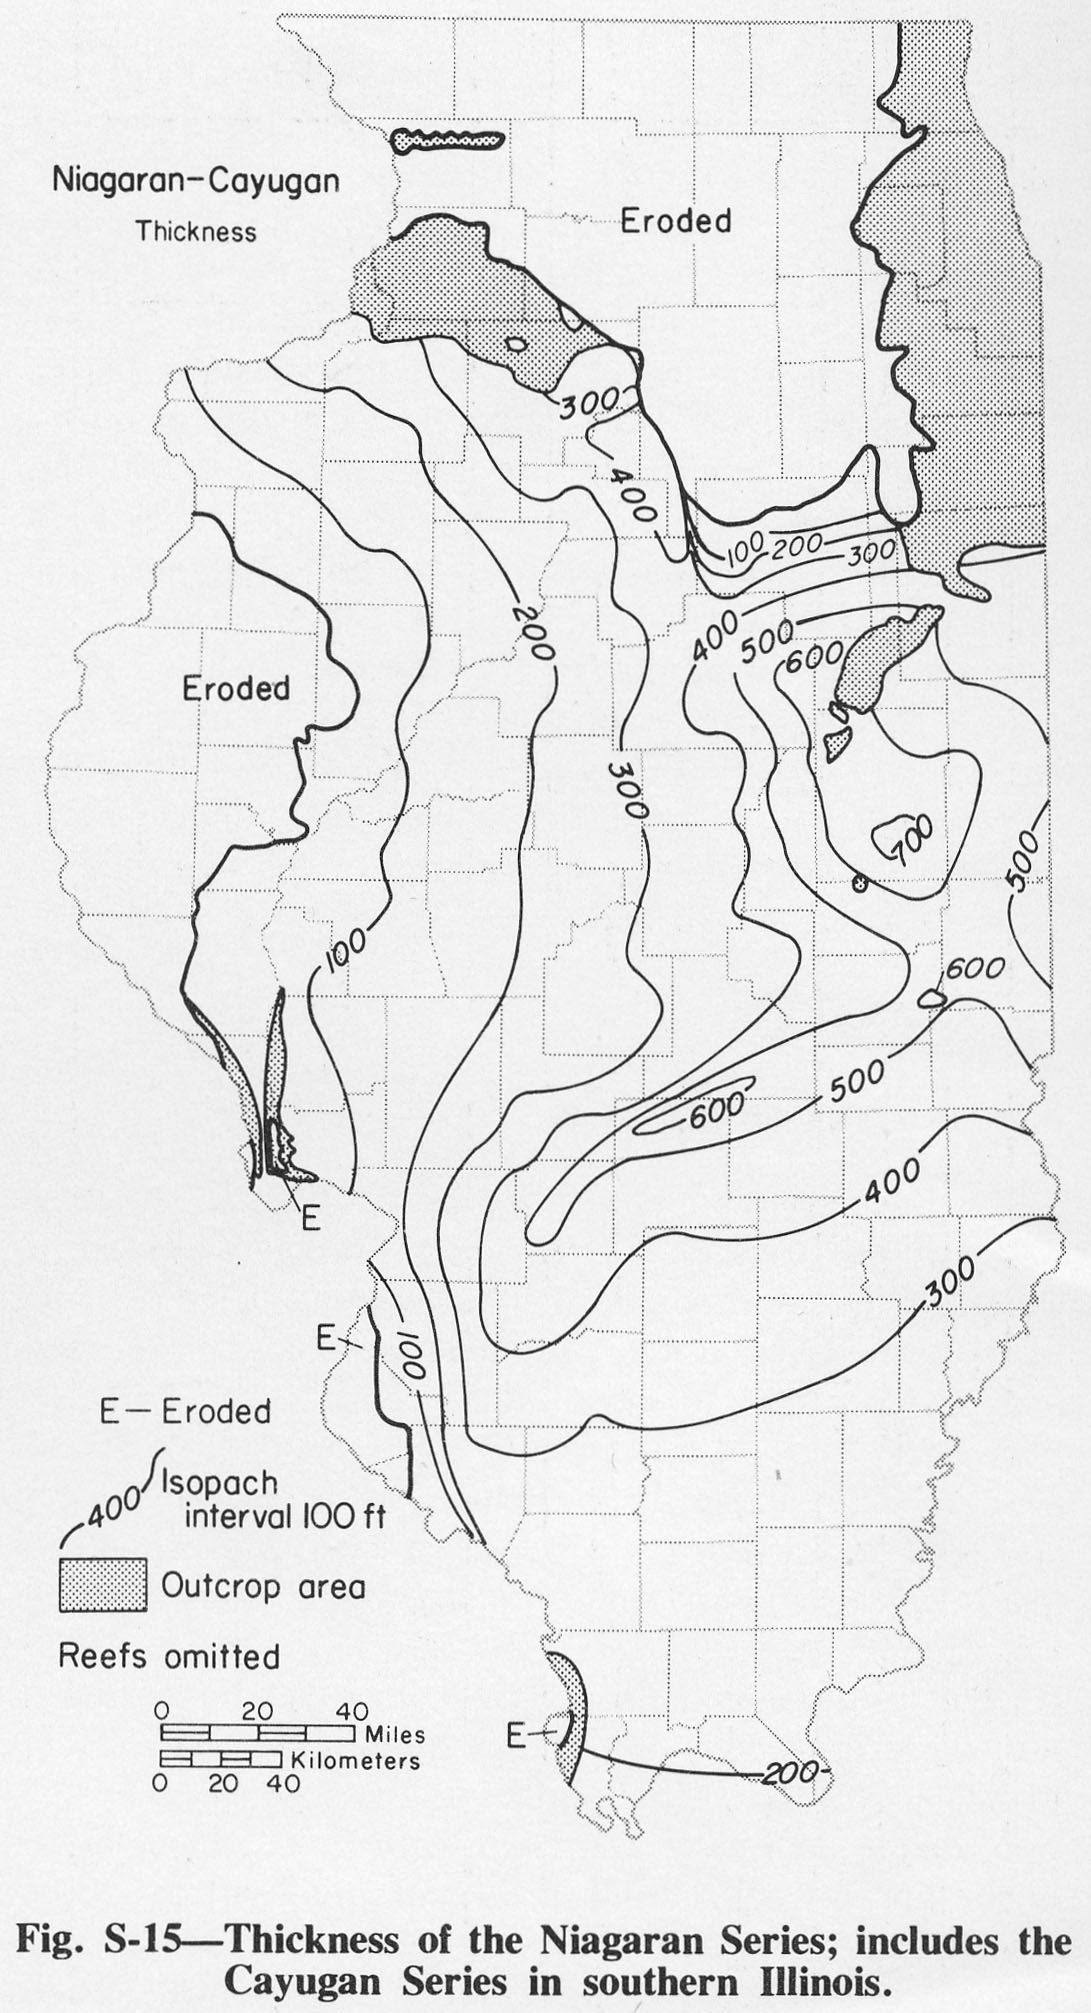
| 18:00, 4 April 2016 | Figure S-15.jpg (file) |  |
322 KB | Alan.Myers | Fig. S-15 -- Thickness of teh Niagaran Series; includes the Cayugan Series in southern Illinois. | 1 |
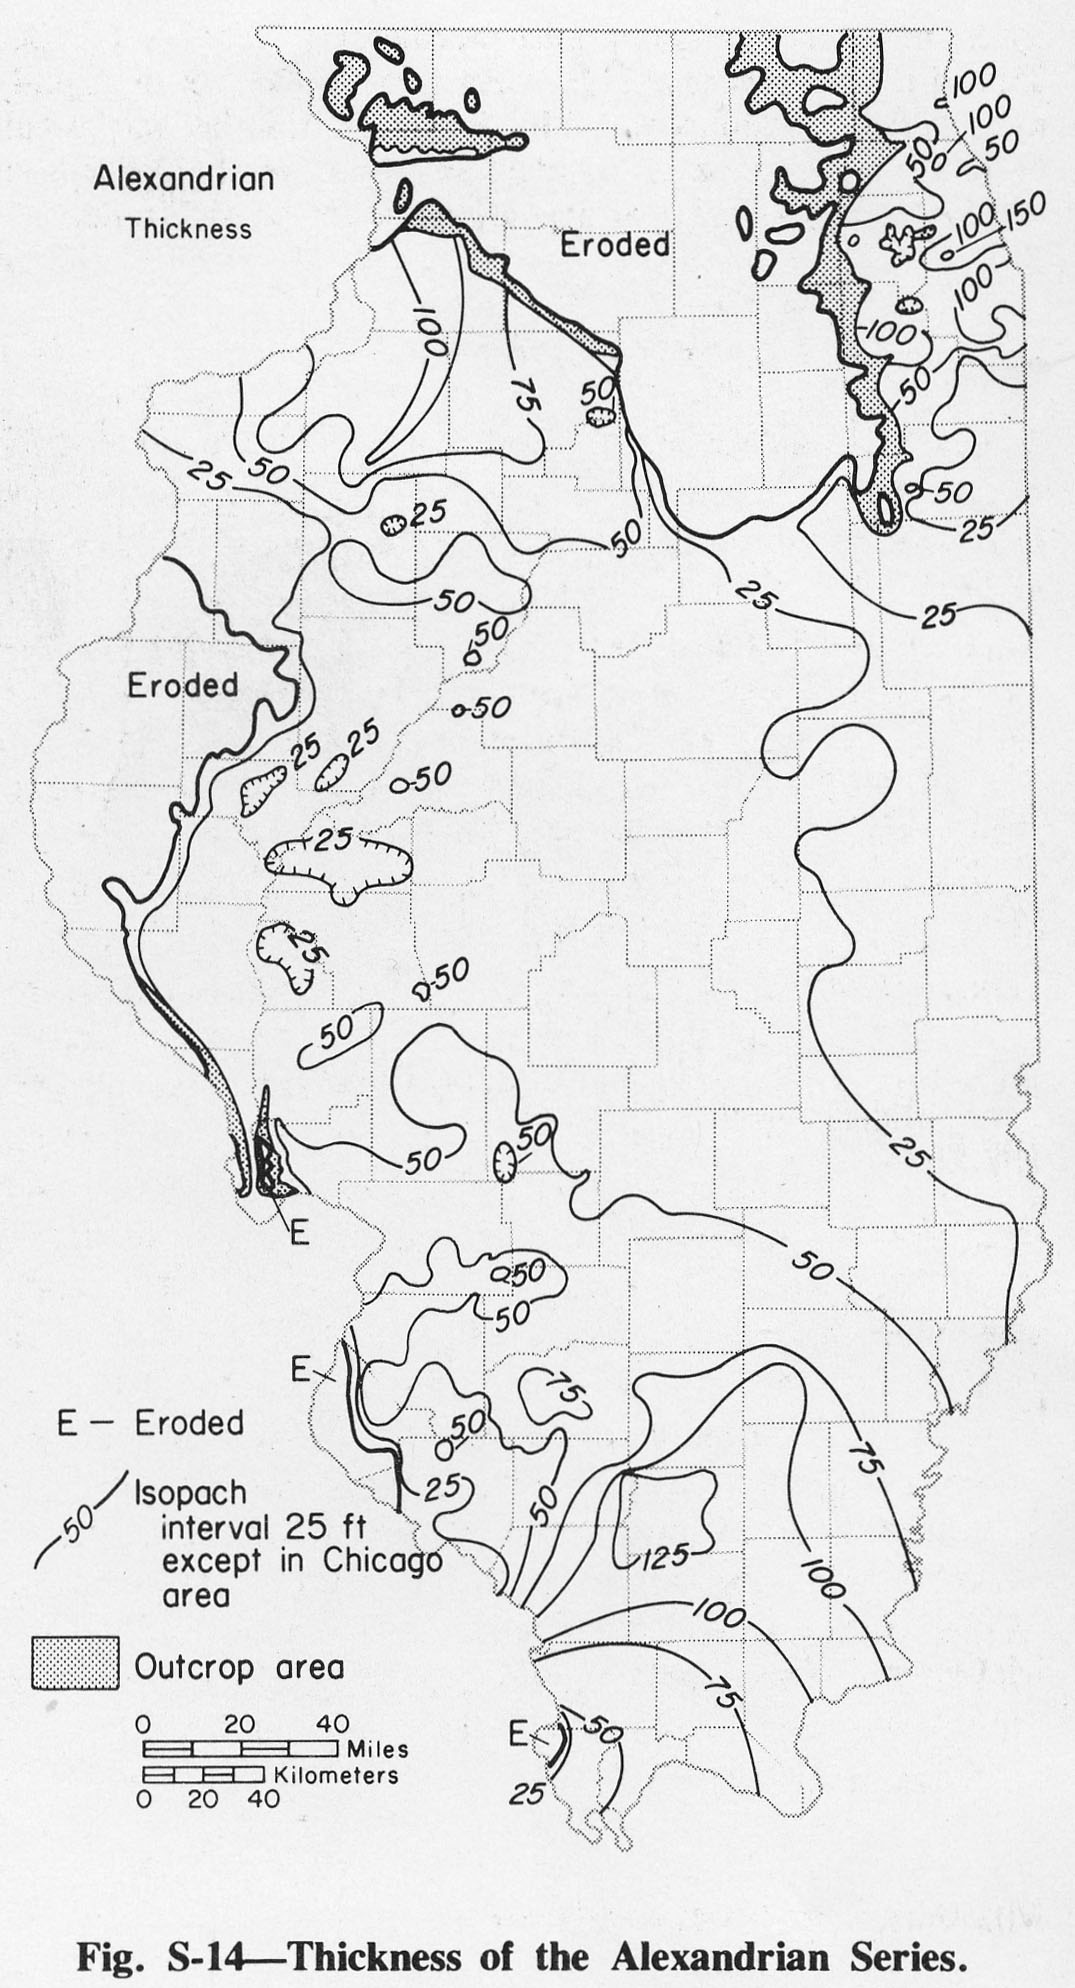
| 17:59, 4 April 2016 | Figure S-14.jpg (file) |  |
328 KB | Alan.Myers | Fig. S-14 -- Thickness of the Alexandrian Series. | 1 |
| 17:58, 4 April 2016 | Figure S-13.jpg (file) |  |
365 KB | Alan.Myers | Fig. S-13 -- Thickness of the Hunton Limestone Megagroup (modified from Bond et al., 1971). | 1 |
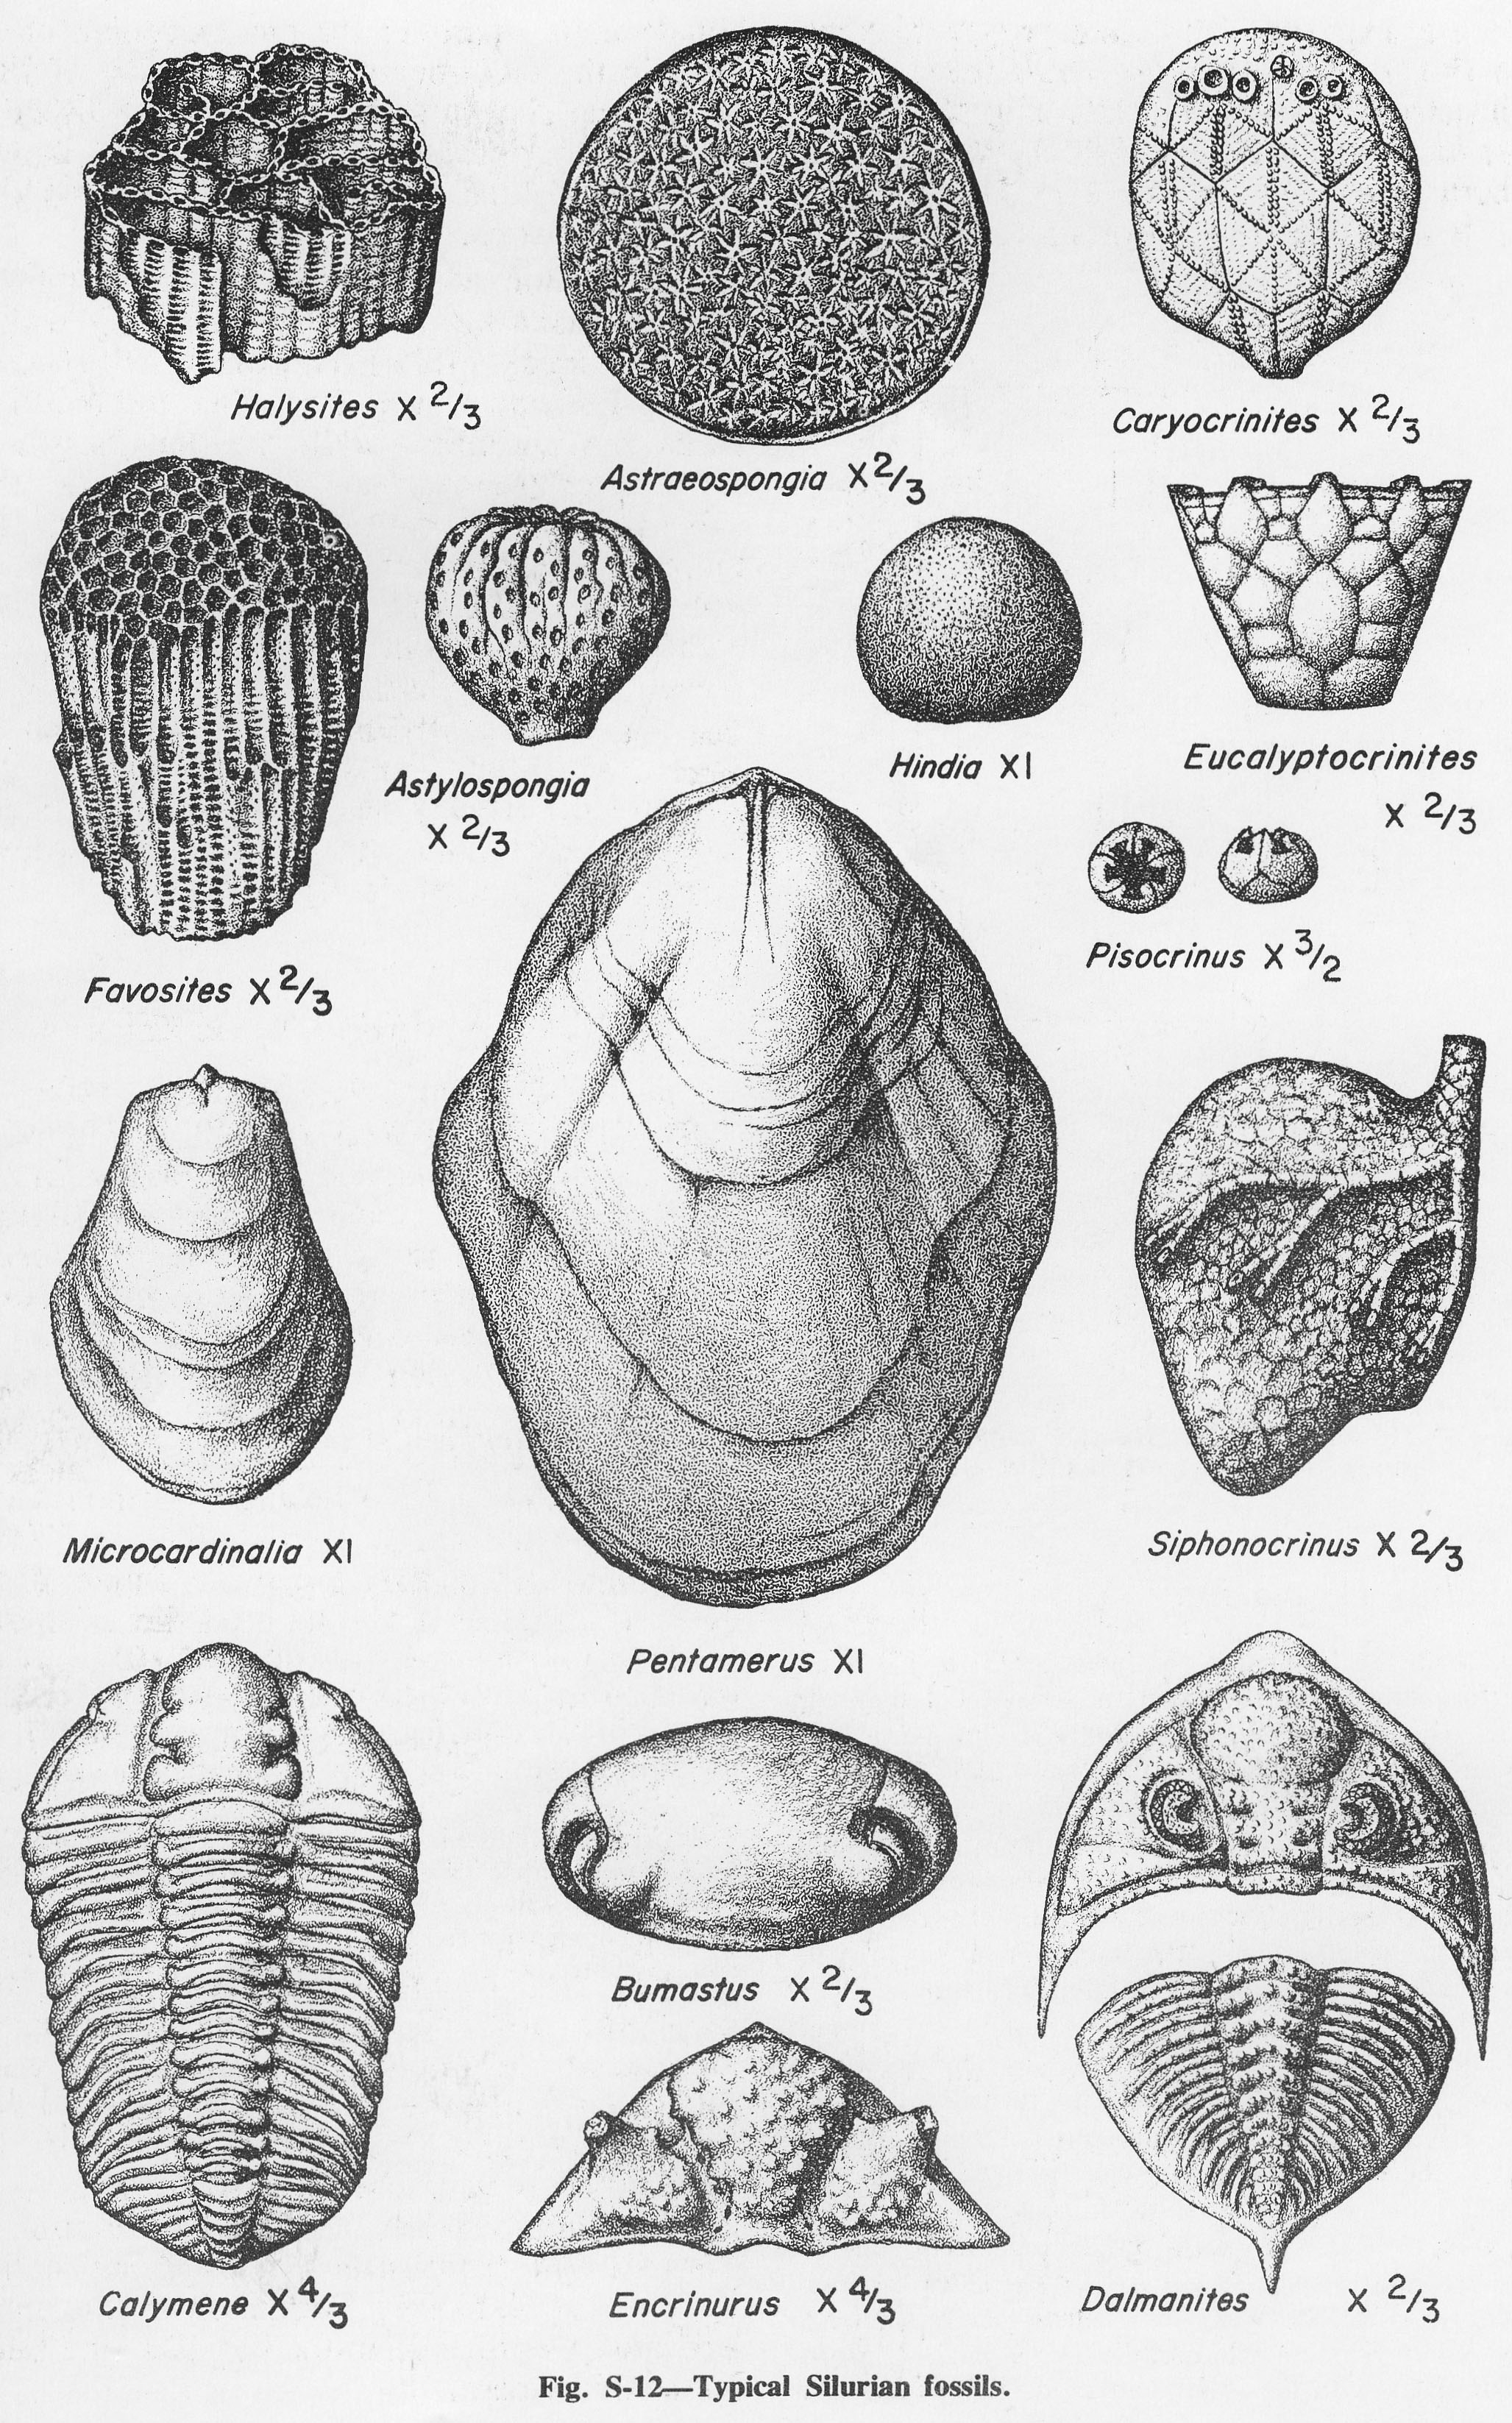
| 17:57, 4 April 2016 | Figure S-12.jpg (file) |  |
1.54 MB | Alan.Myers | Fig. S-12 -- Typical Silurian fossils. | 1 |
| 17:56, 4 April 2016 | Figure S-11.jpg (file) |  |
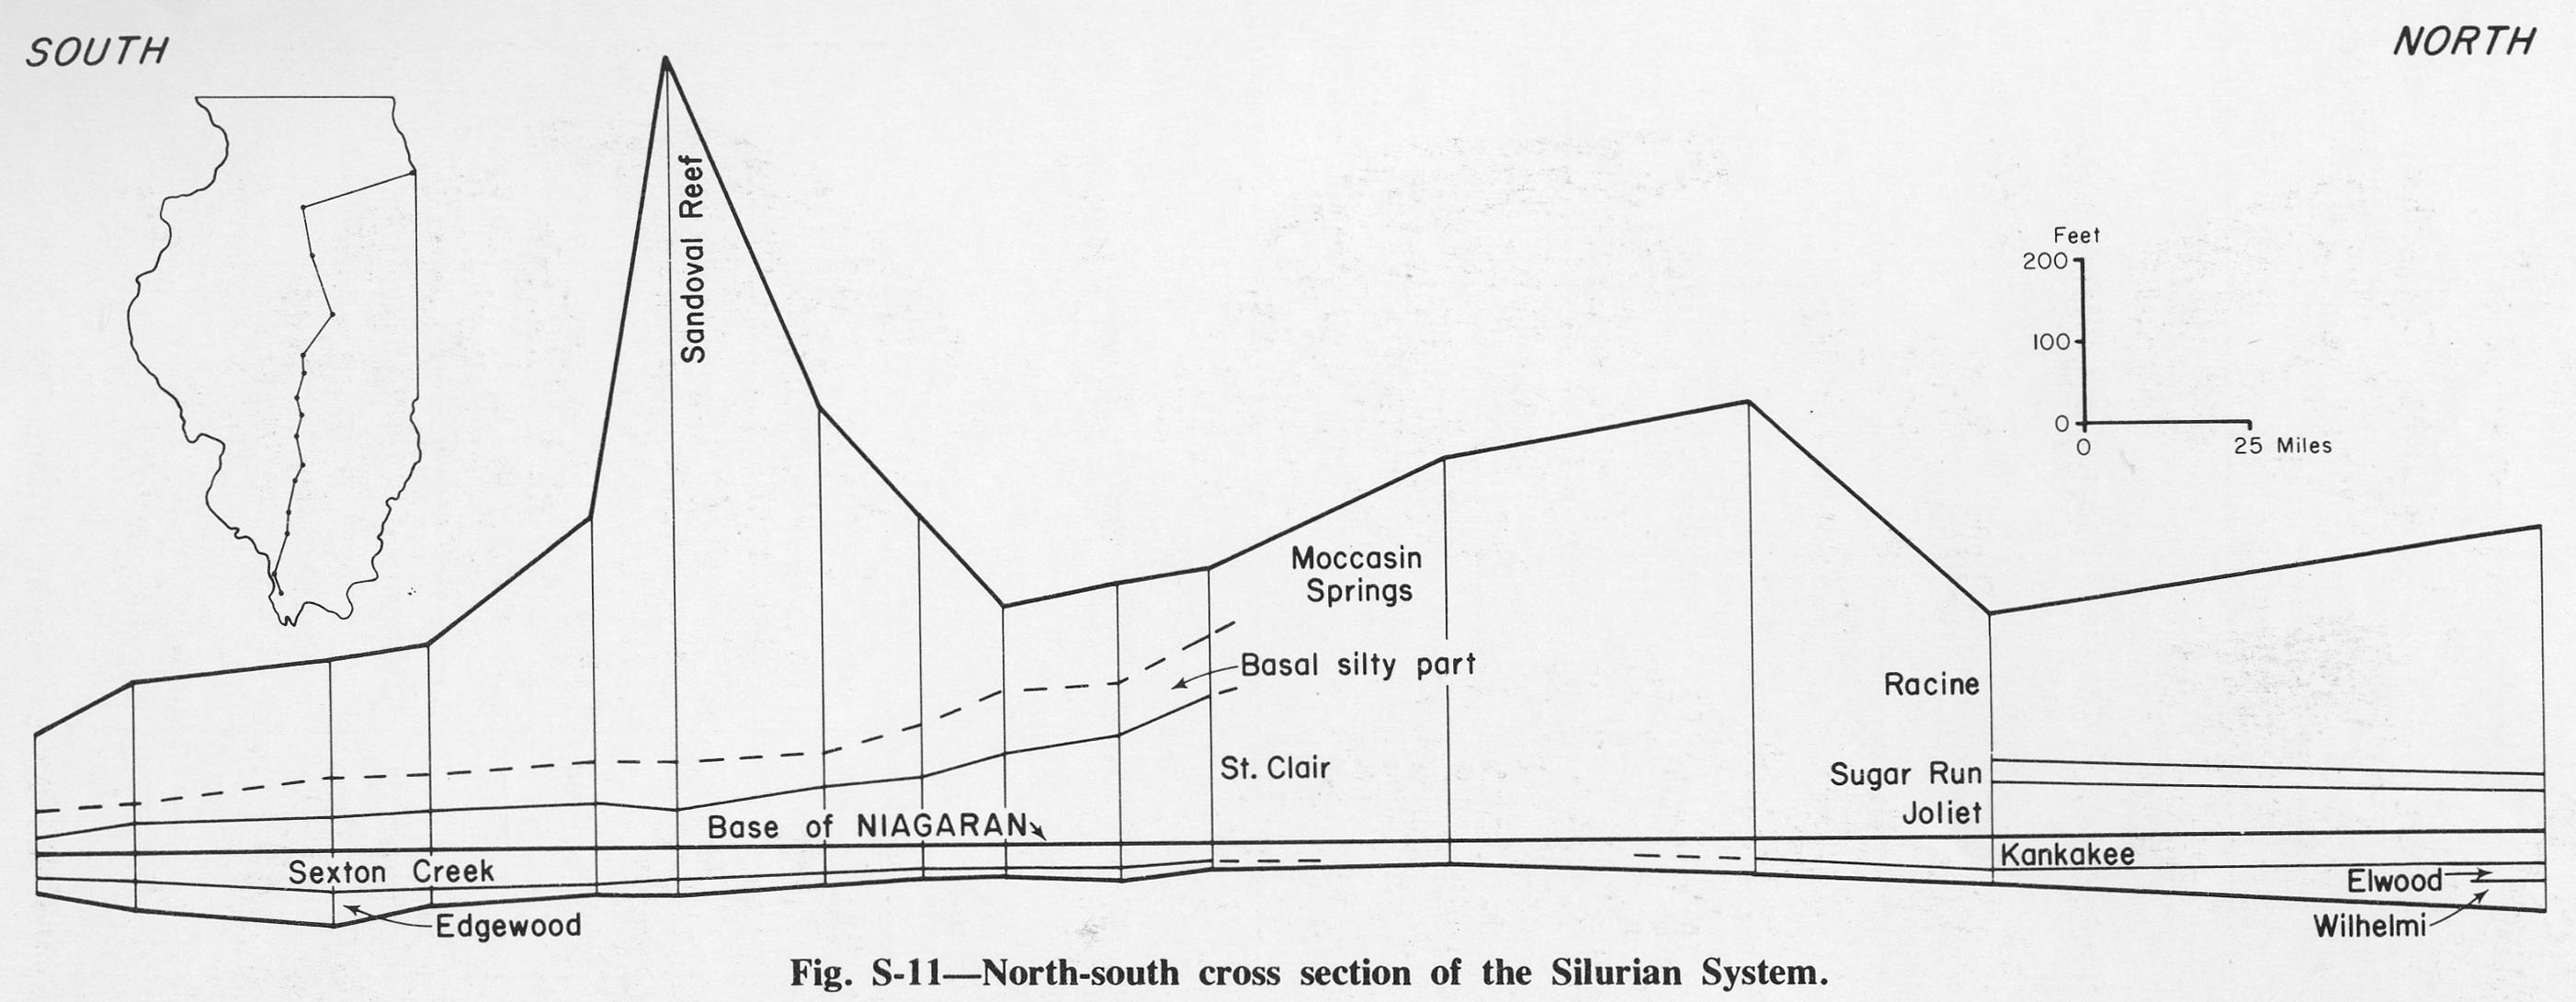
257 KB | Alan.Myers | Fig. S-11 -- North-south cross section of the Silurian System. | 1 |
| 17:56, 4 April 2016 | Figure S-10.jpg (file) |  |
326 KB | Alan.Myers | Fig. S-10 -- Development of the classification of the Silurian System in southern Illinois. | 1 |
| 17:55, 4 April 2016 | Figure S-9.jpg (file) |  |
269 KB | Alan.Myers | Fig. S-9 -- Development of the classification of the Silurian System in western Illinois. | 1 |
| 17:54, 4 April 2016 | Figure S-8.jpg (file) |  |
319 KB | Alan.Myers | Fig. S-8 -- Development of the classification of the Silurian System in northwestern Illinois. | 1 |
| 17:53, 4 April 2016 | Figure S-7.jpg (file) |  |
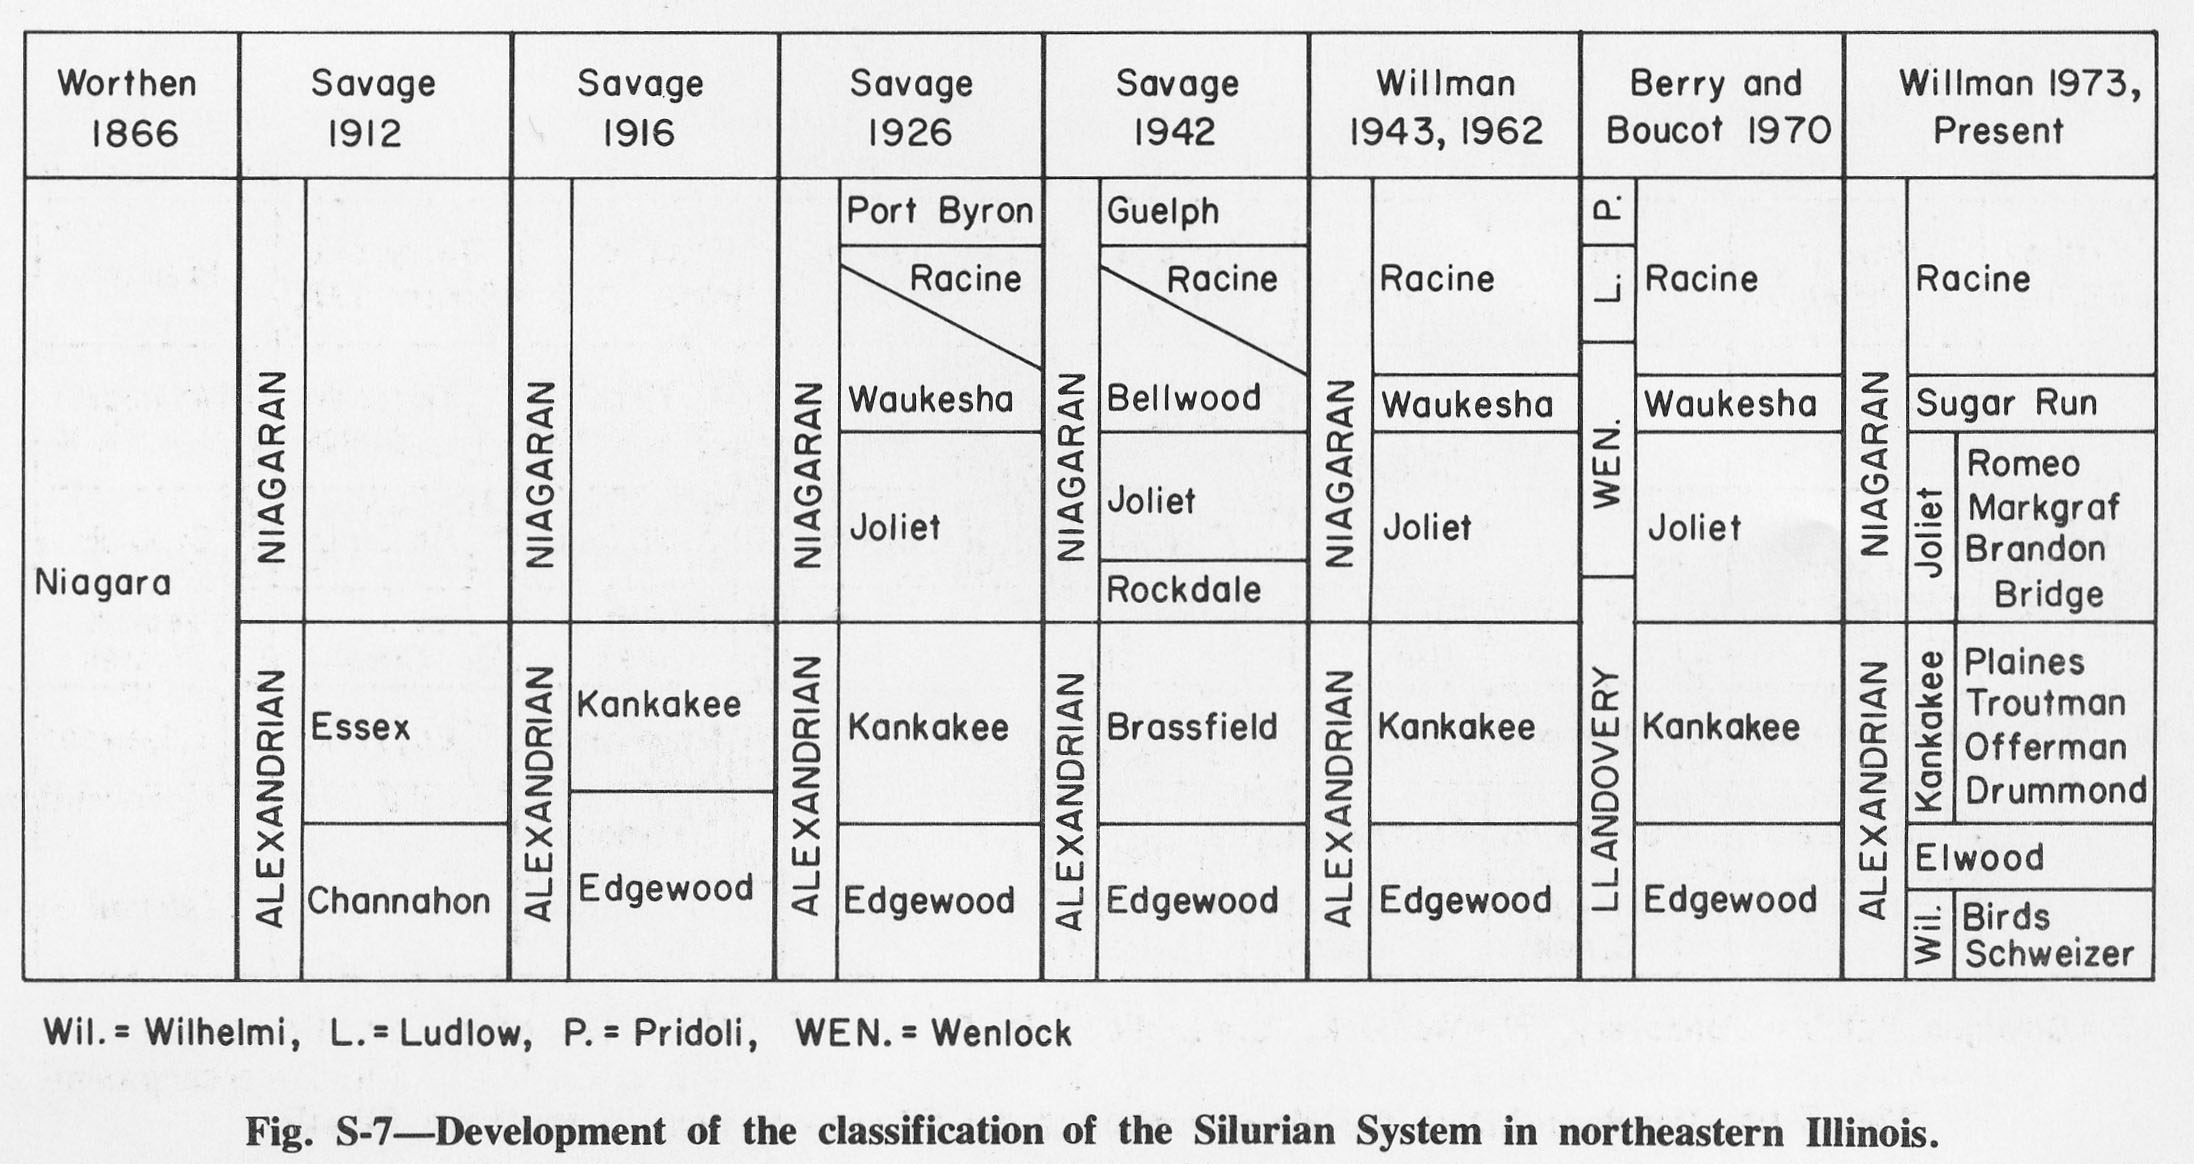
329 KB | Alan.Myers | Fig. S-7 -- Development of the classification of the Silurian System in northeastern Illinois. | 1 |
| 17:52, 4 April 2016 | Figure S-6.jpg (file) |  |
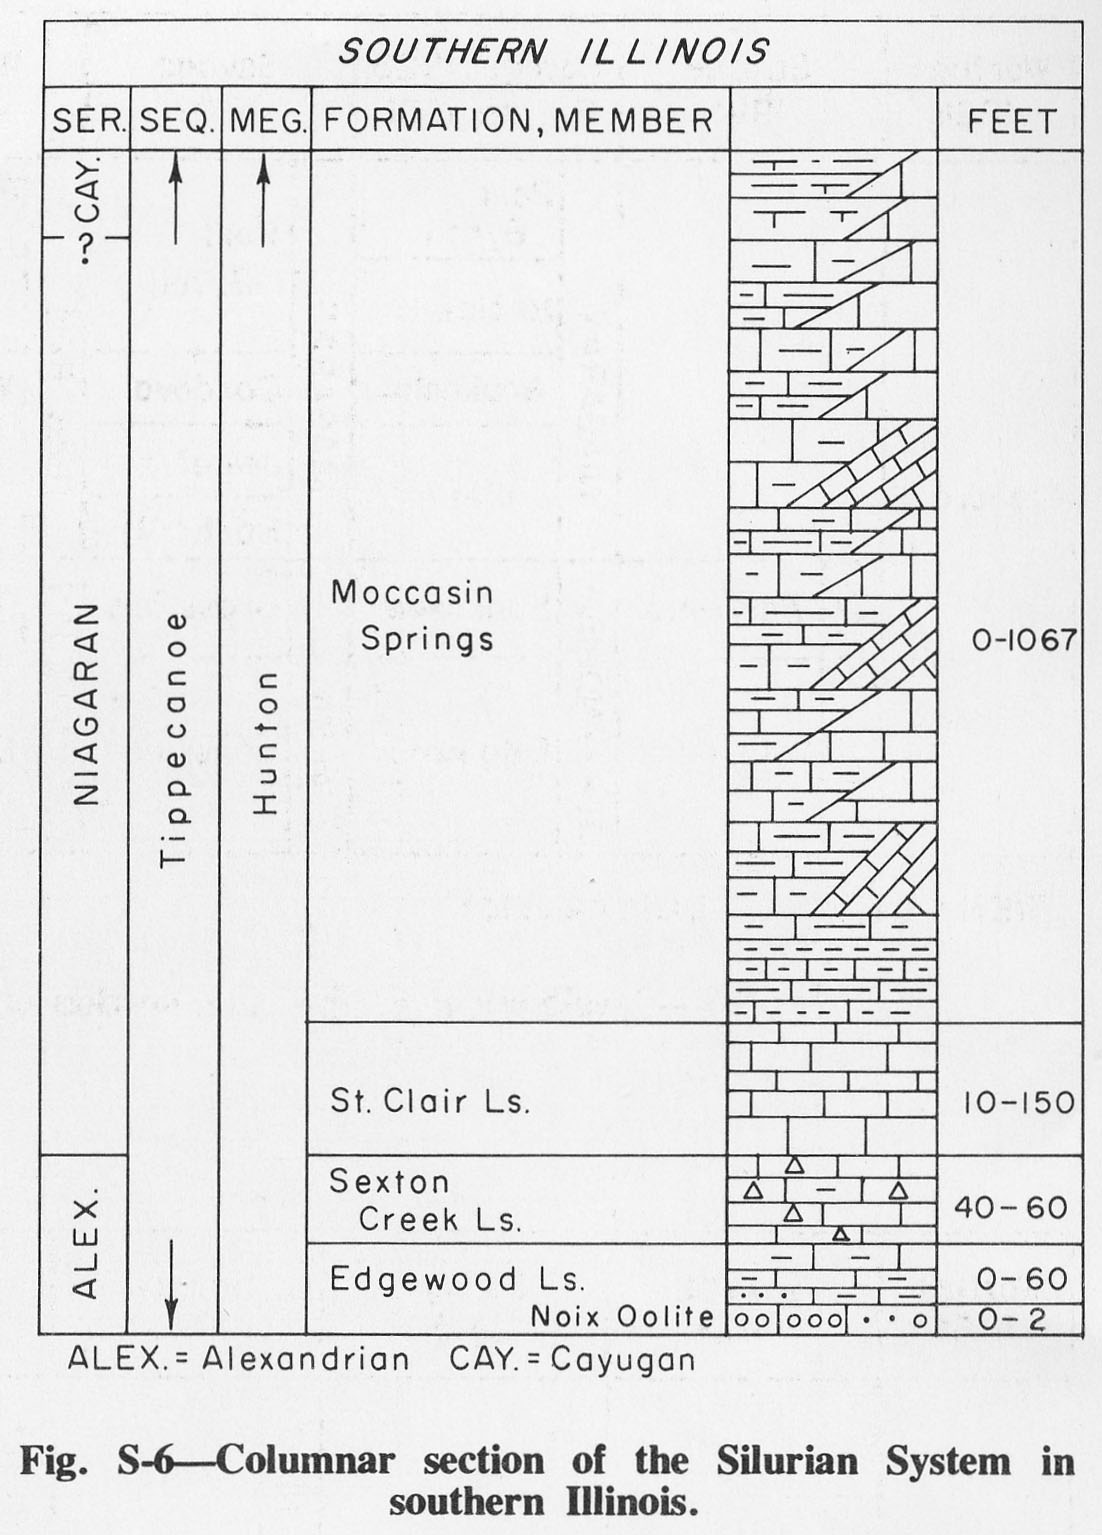
209 KB | Alan.Myers | Fig. S-6 -- Columnar section of Silurian System in southern Illinois. | 1 |
| 17:11, 4 April 2016 | Figure S-5.jpg (file) |  |
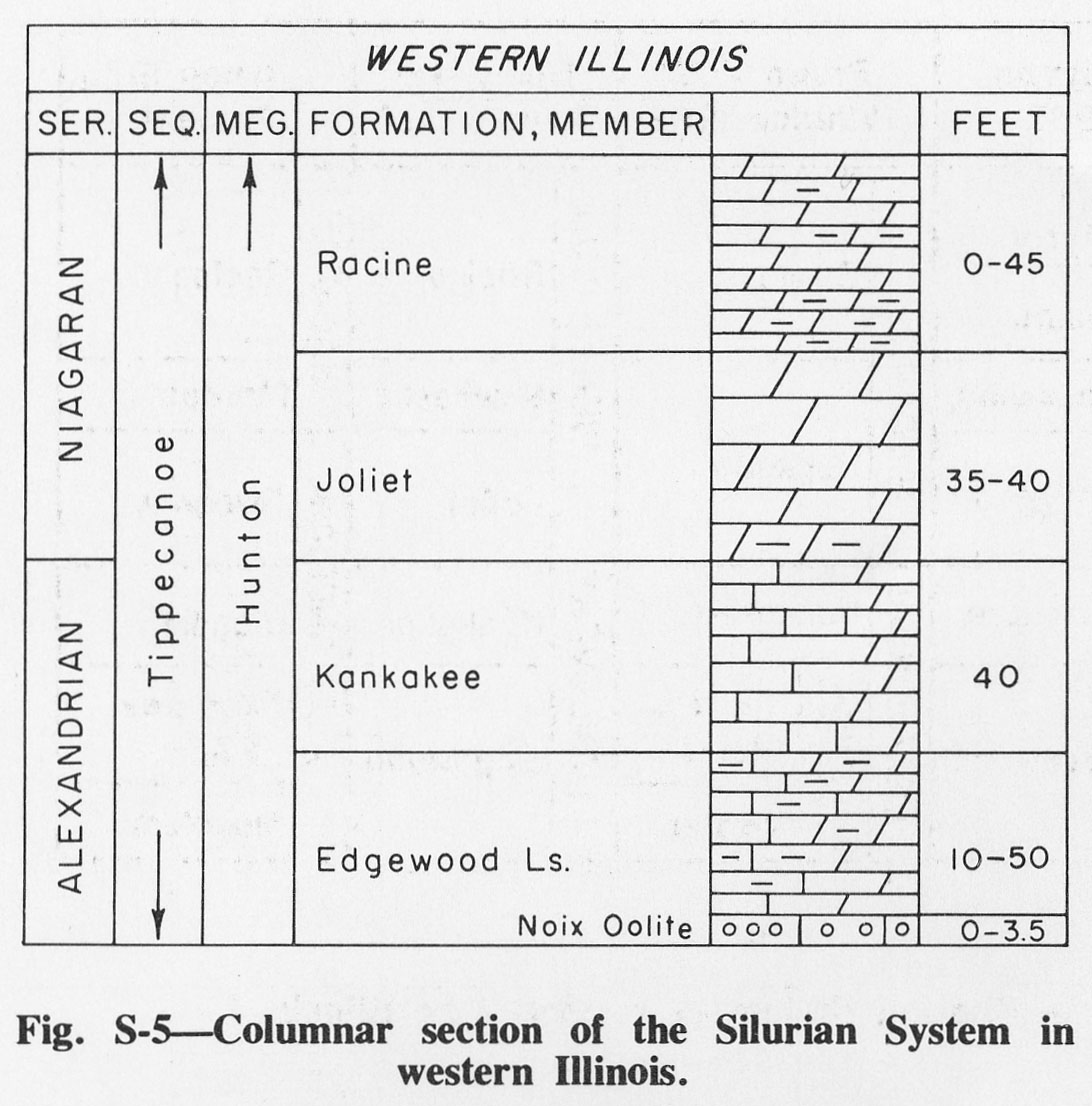
198 KB | Alan.Myers | Fig. S-5 -- Columnar section of the Silurian System in western Illinois. | 1 |
| 17:03, 4 April 2016 | Figure S-4.jpg (file) |  |
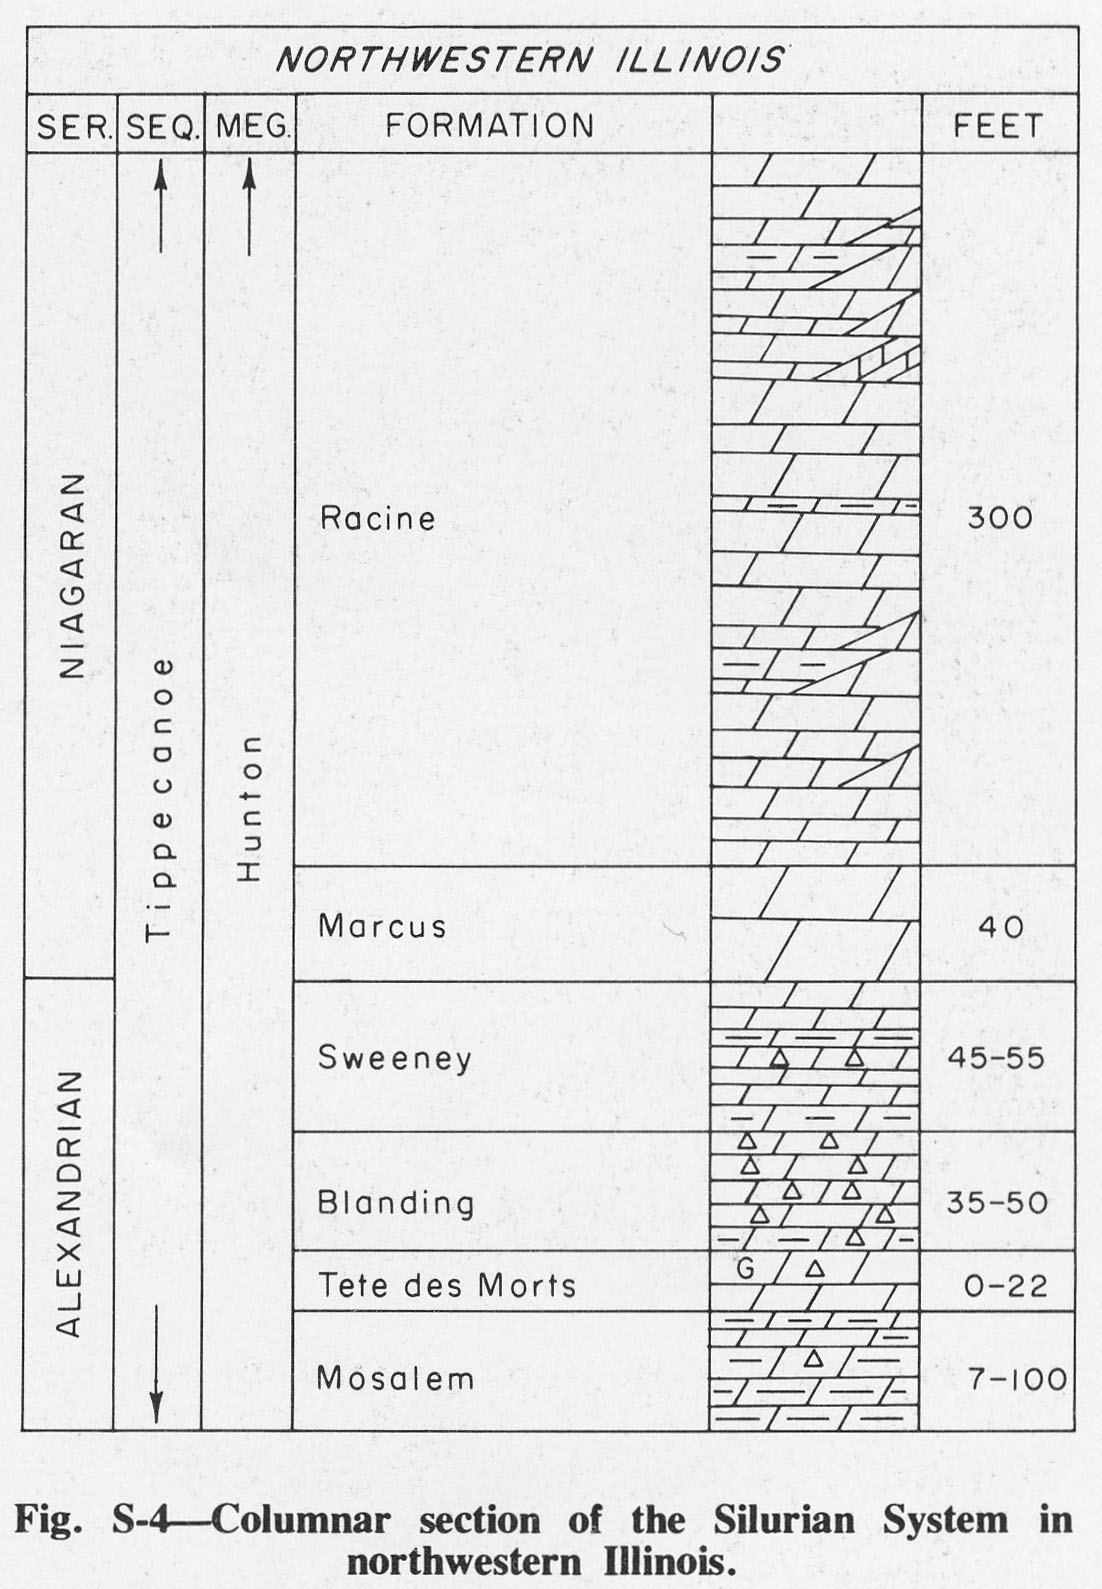
219 KB | Alan.Myers | Fig. S-4 -- Columnar section of the Silurian System in northwestern Illinois. | 1 |
| 17:03, 4 April 2016 | Figure S-3.jpg (file) |  |
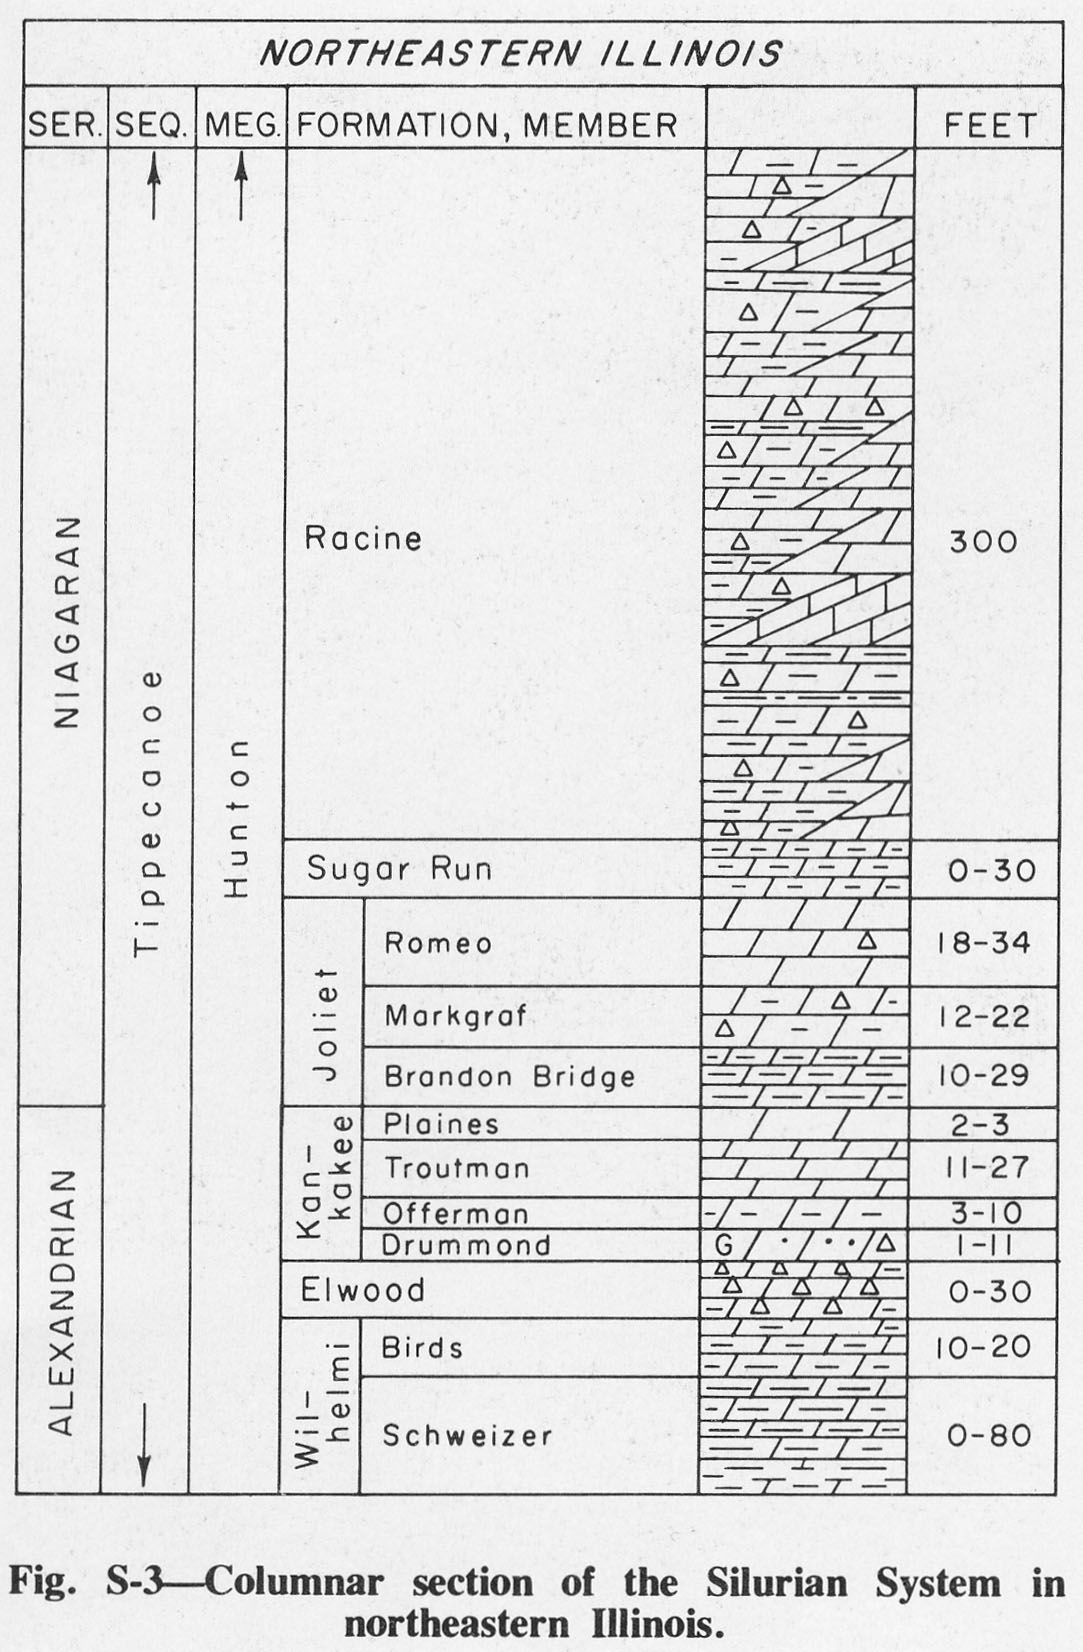
254 KB | Alan.Myers | Fig. S-3 -- Columnar section of Silurian System in northeastern Illinois. | 1 |
| 17:02, 4 April 2016 | Figure S-1.jpg (file) |  |
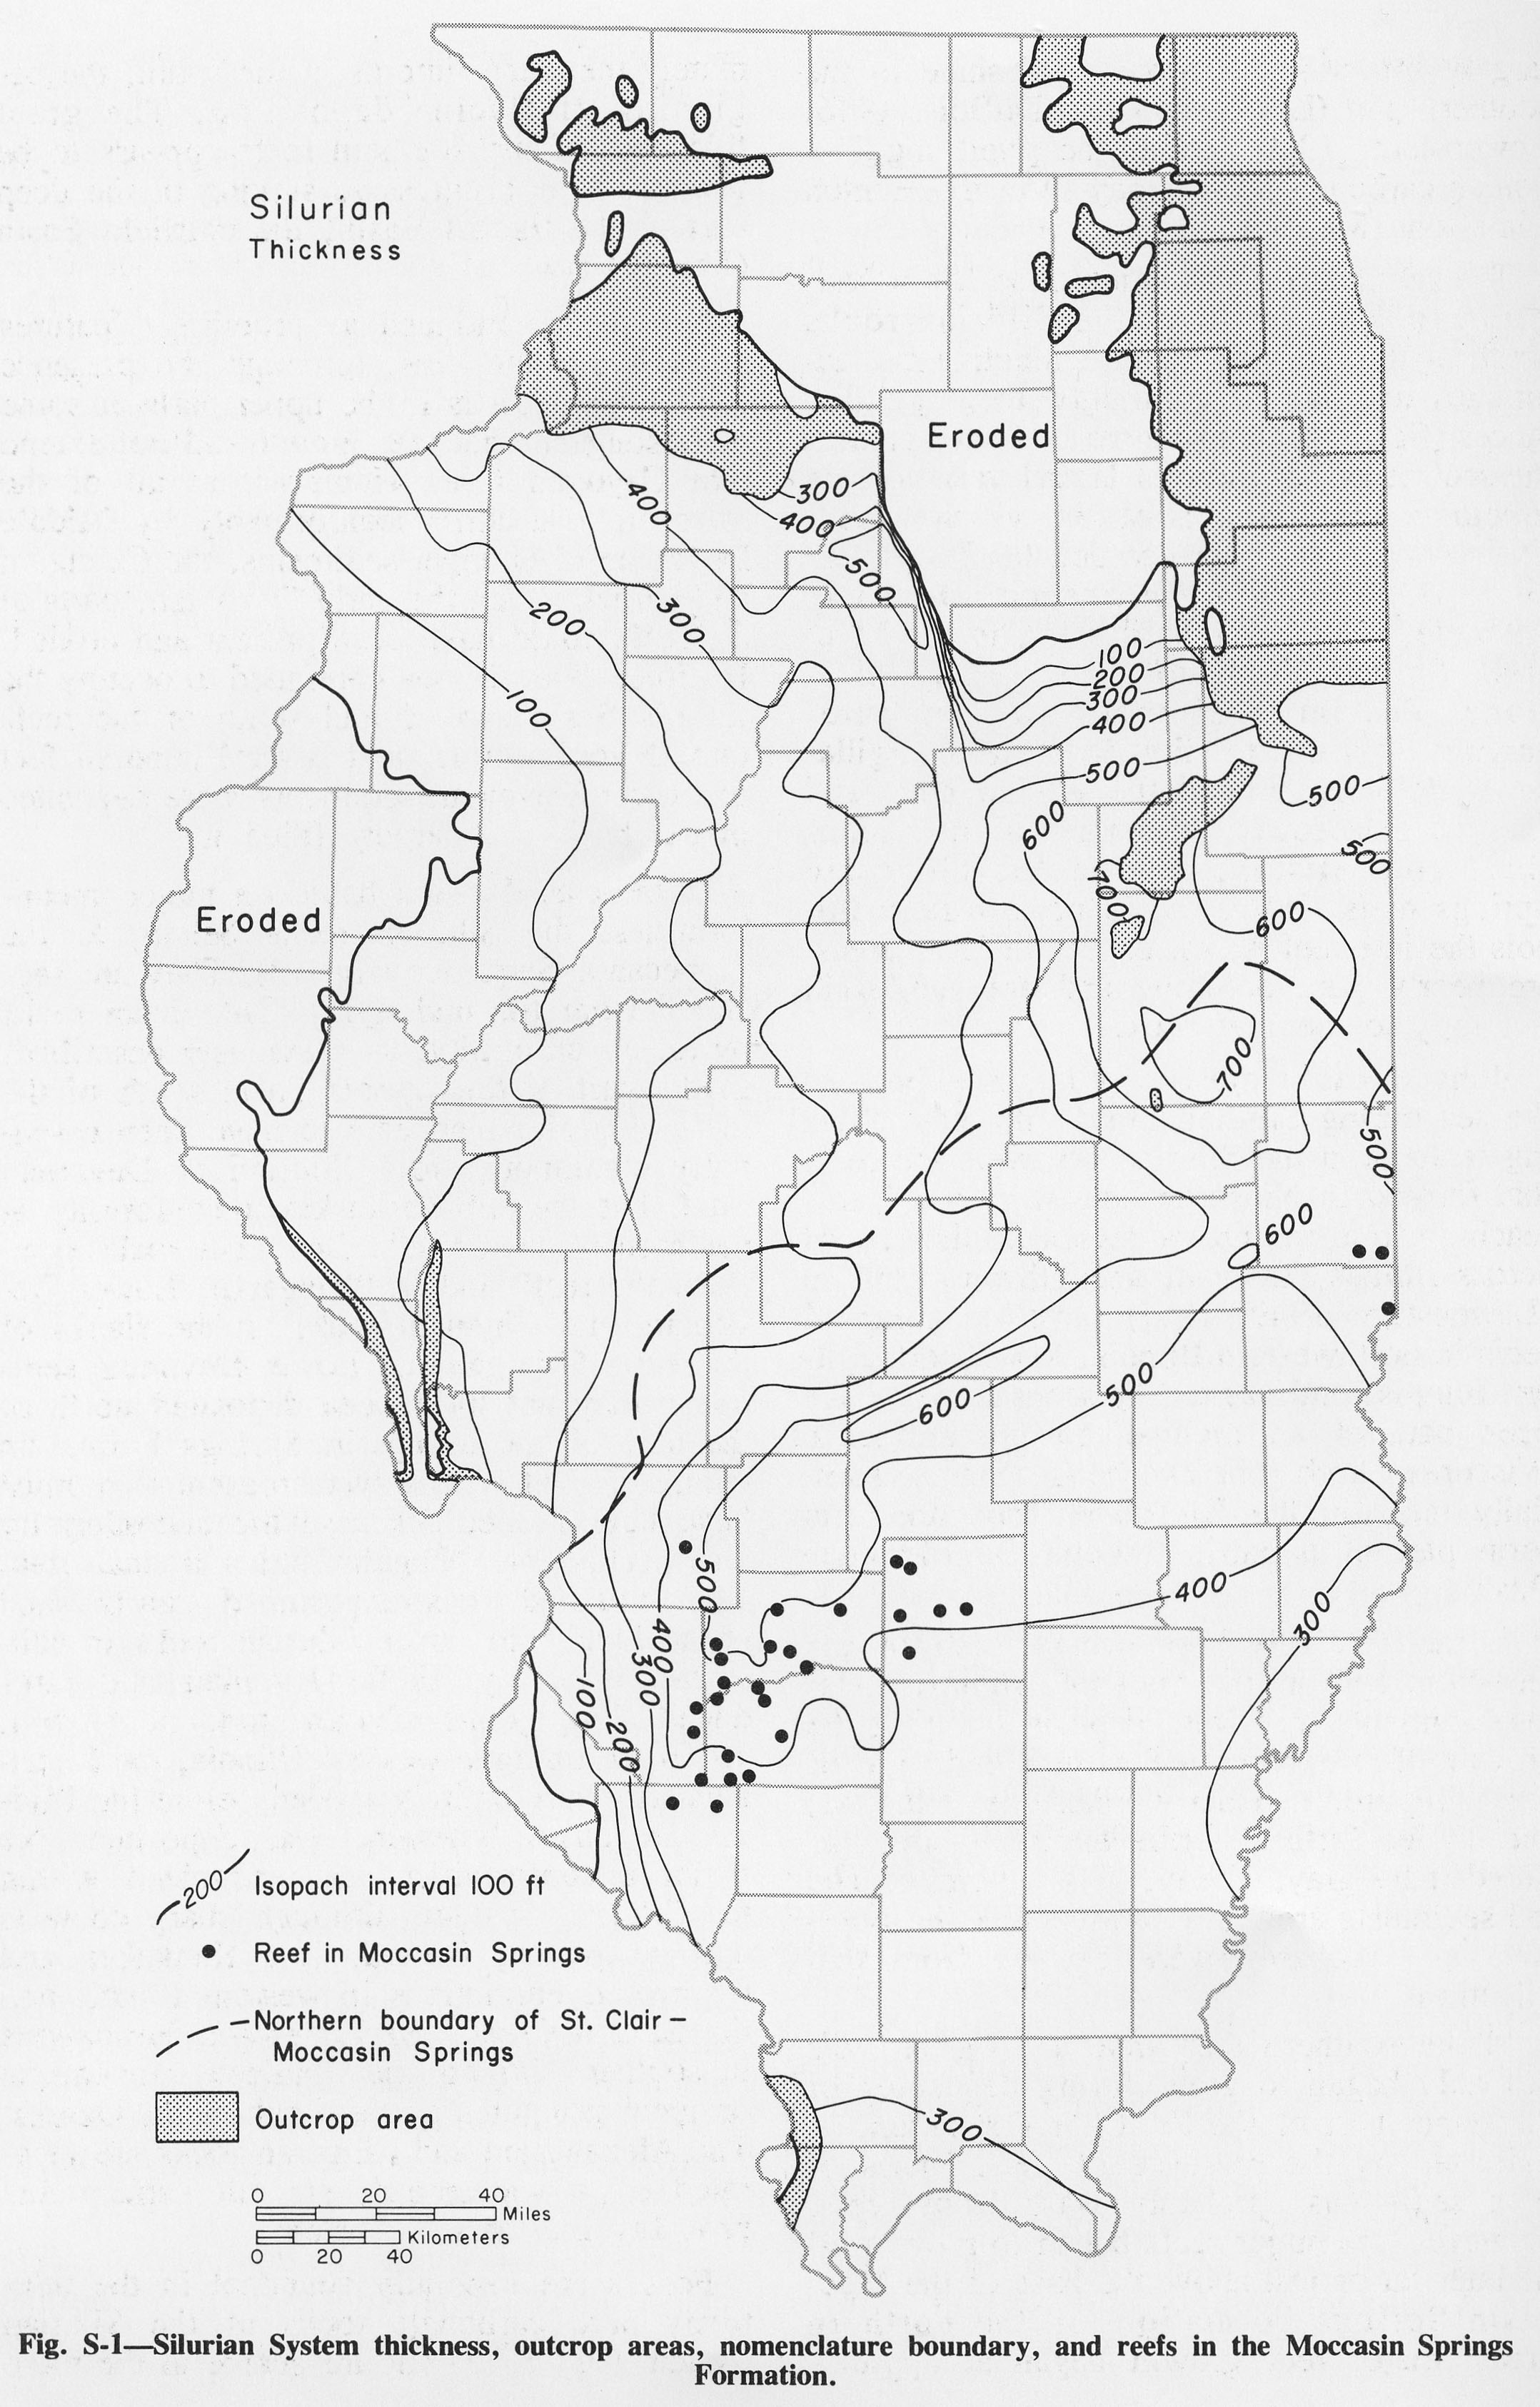
883 KB | Alan.Myers | Fig. S-1 -- Silurian System thickness, outcroup areas, nomenclature boundary, and reef in the Moccasin Springs Formation. | 1 |
| 16:00, 4 April 2016 | Figure Q-10.jpg (file) |  |
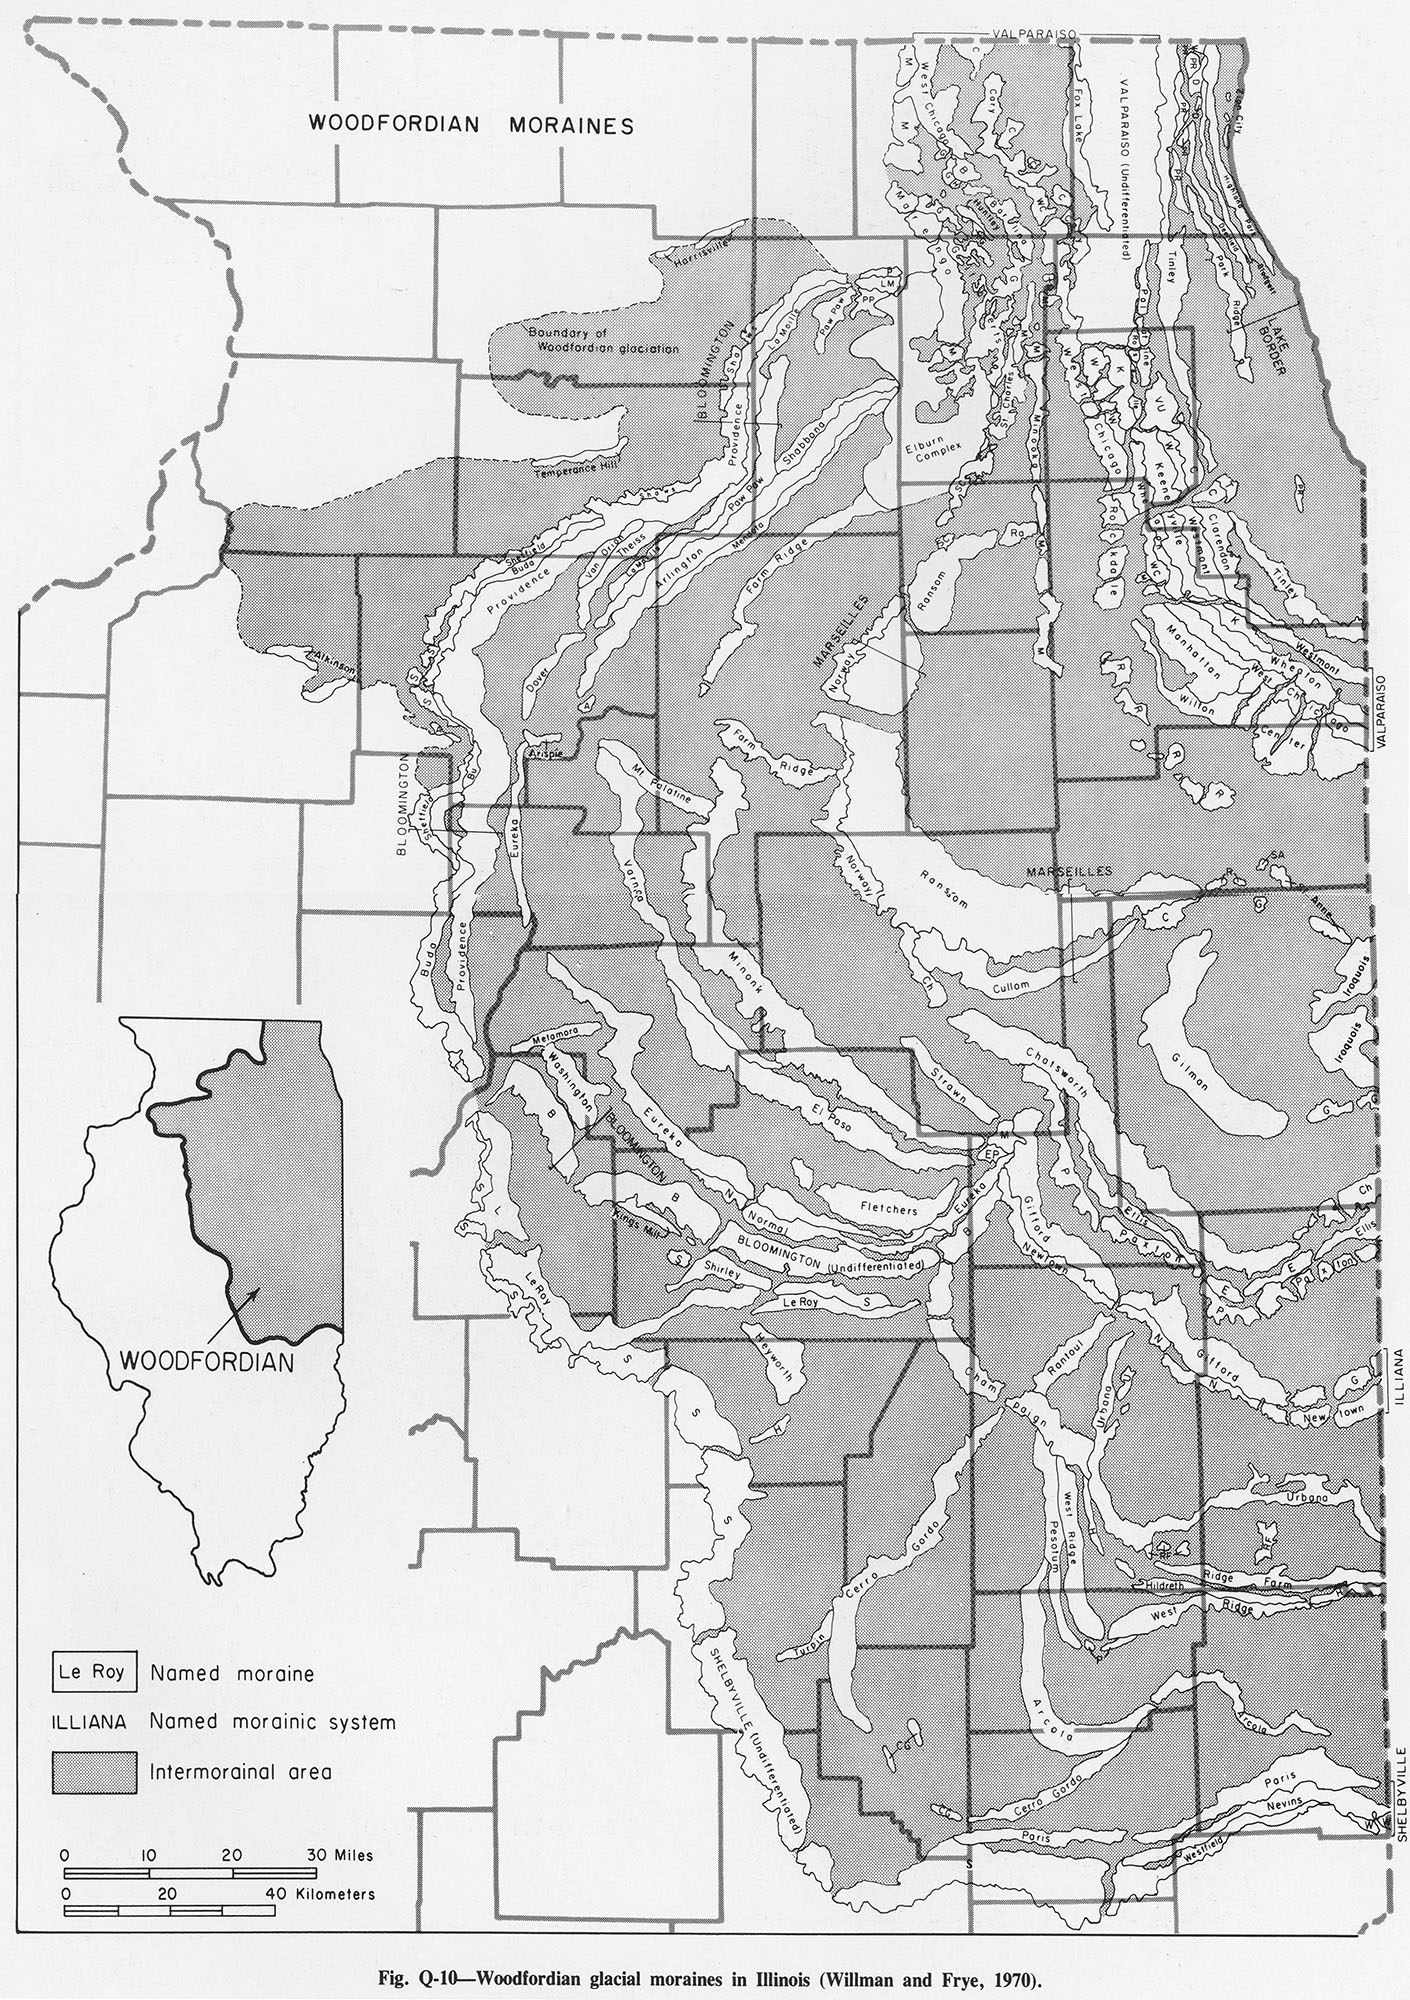
860 KB | Alan.Myers | Fig. Q-10 -- Woodfordian glacial moraines in Illinois (Willman and Frye, 1970). | 2 |
| 15:58, 4 April 2016 | Figure Q-9.jpg (file) |  |
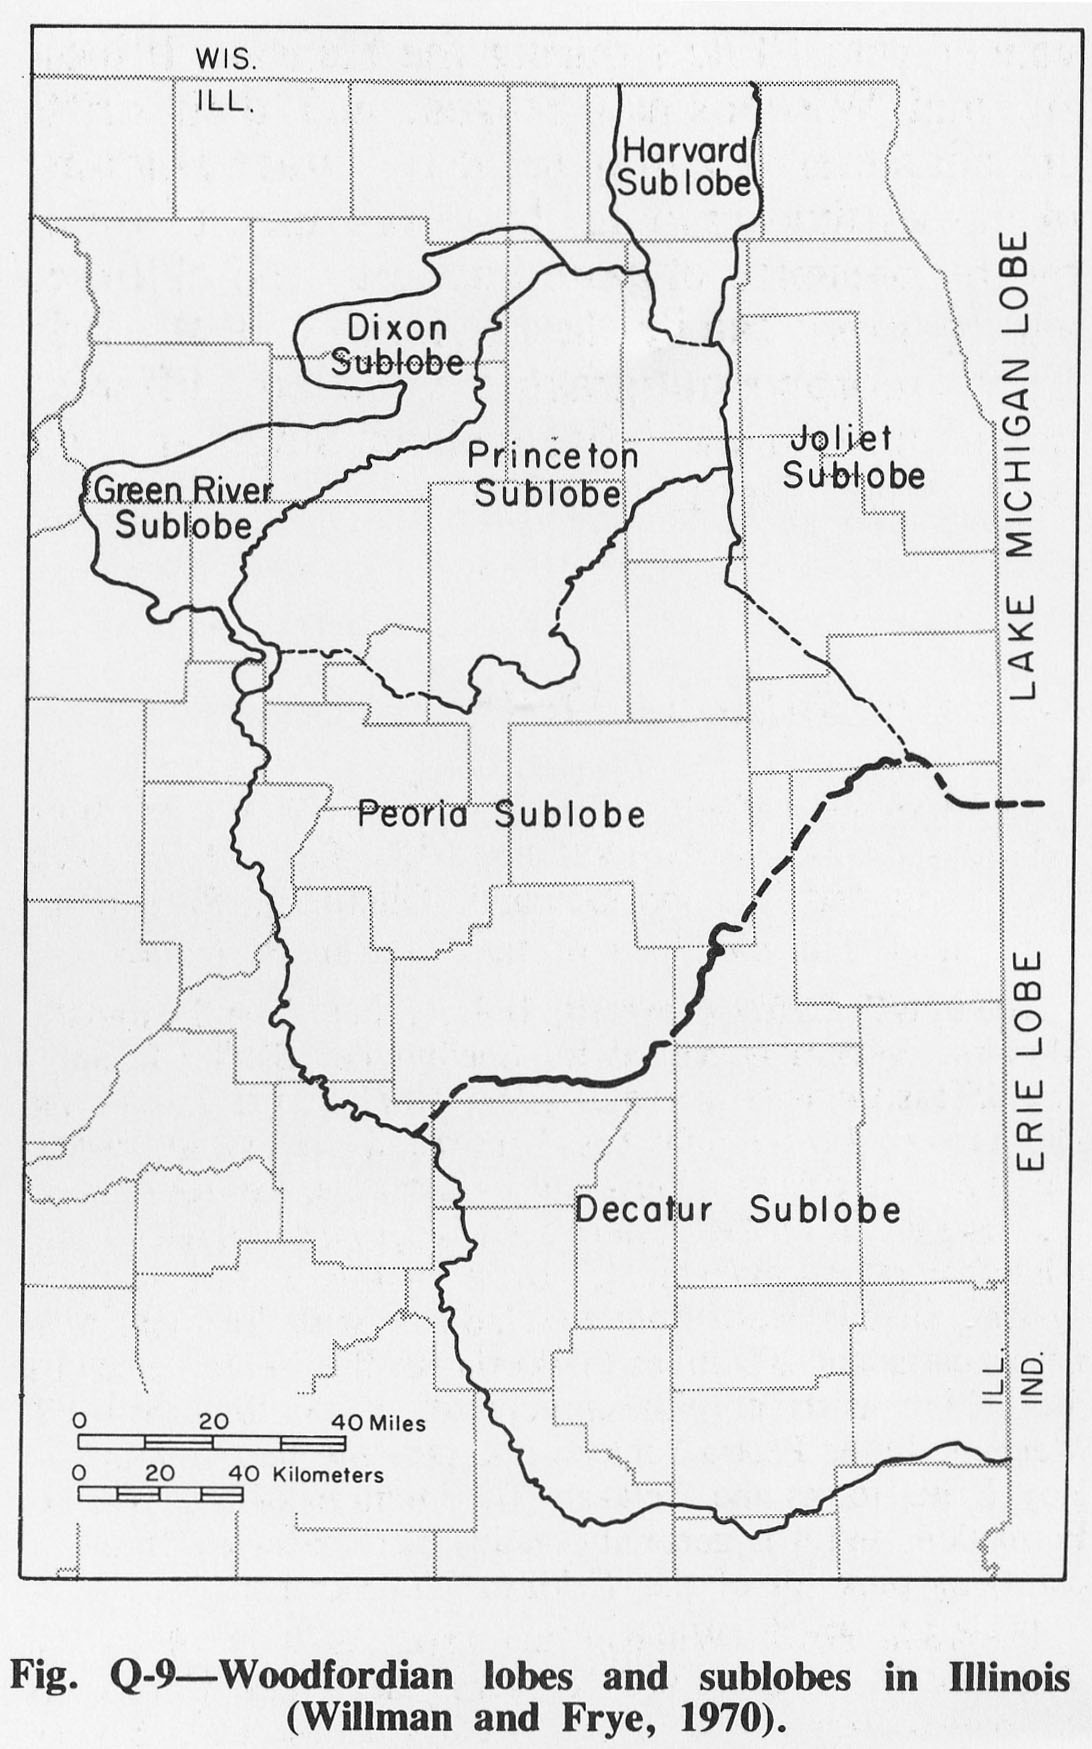
248 KB | Alan.Myers | Fig. Q-9 -- Woodfordian lobes and sublobes in Illinois (Willman and Frye, 1970). | 1 |
| 15:56, 4 April 2016 | Figure Q-8.jpg (file) |  |
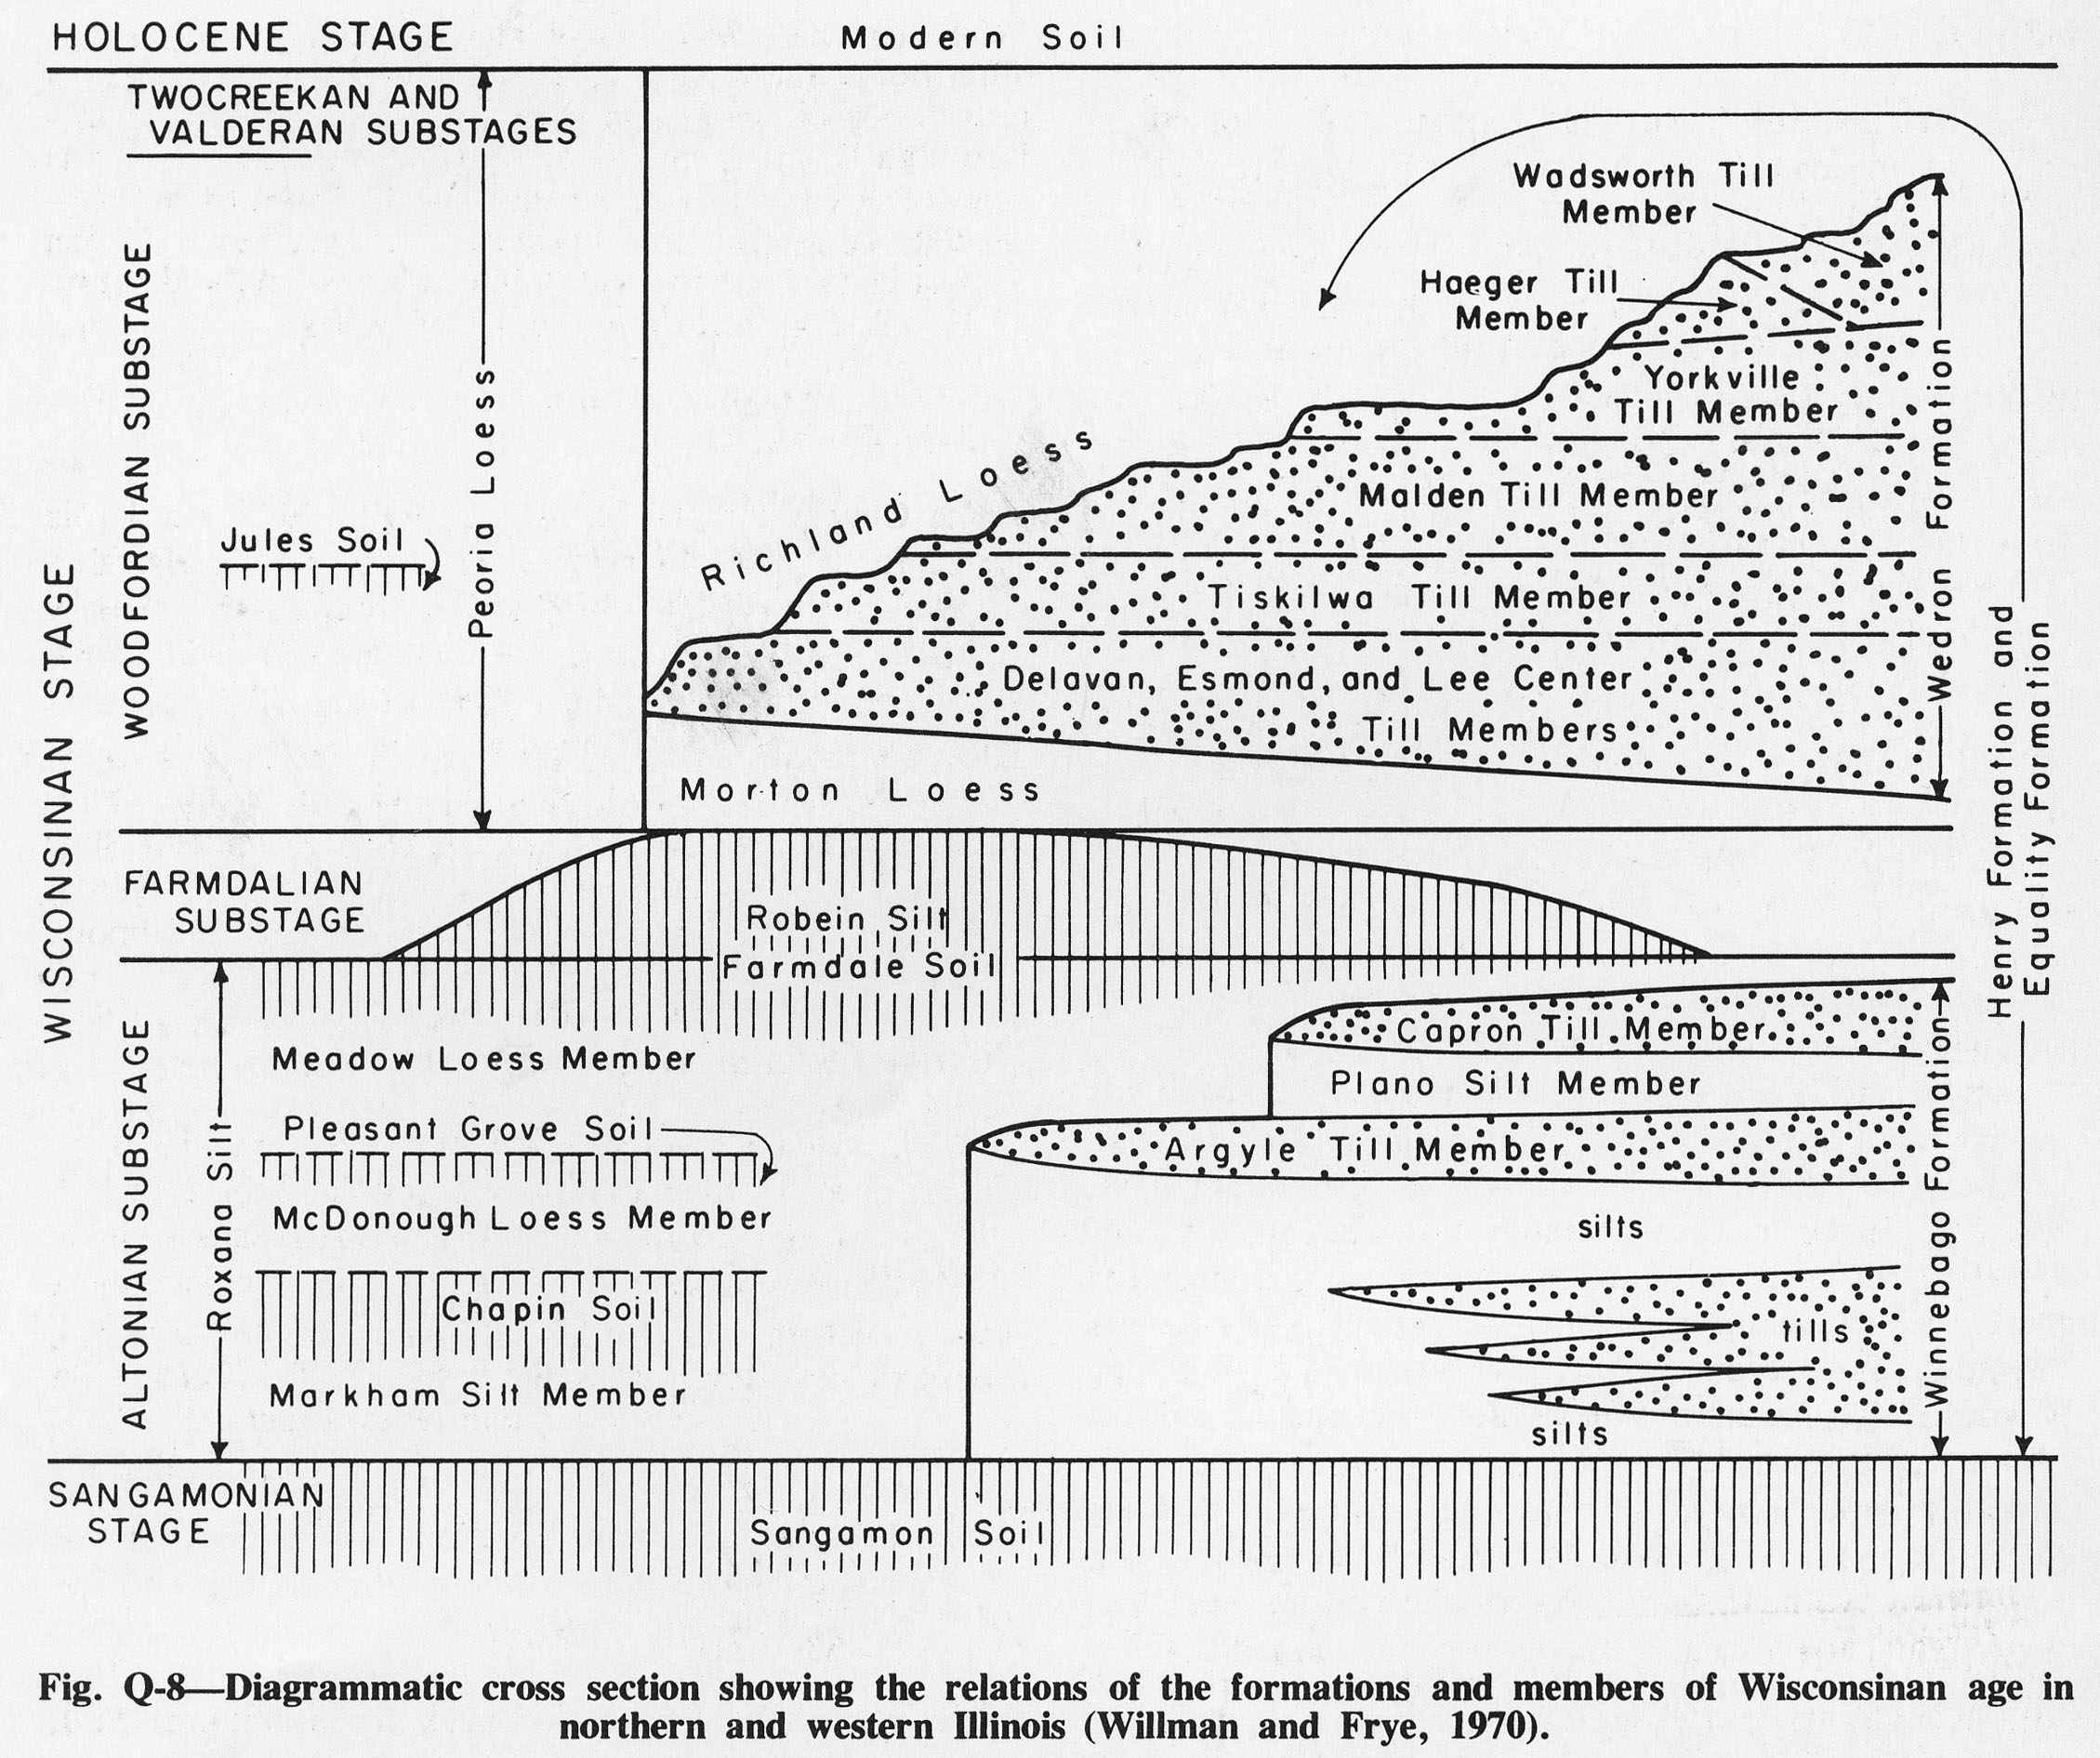
651 KB | Alan.Myers | Fig. Q-8 -- Diagrammatic cross section showing the relations of the formations and members of Wisconsinan age in northern and western Illinois (Willman and Frye, 1970). | 1 |
| 15:55, 4 April 2016 | Figure Q-7.jpg (file) |  |
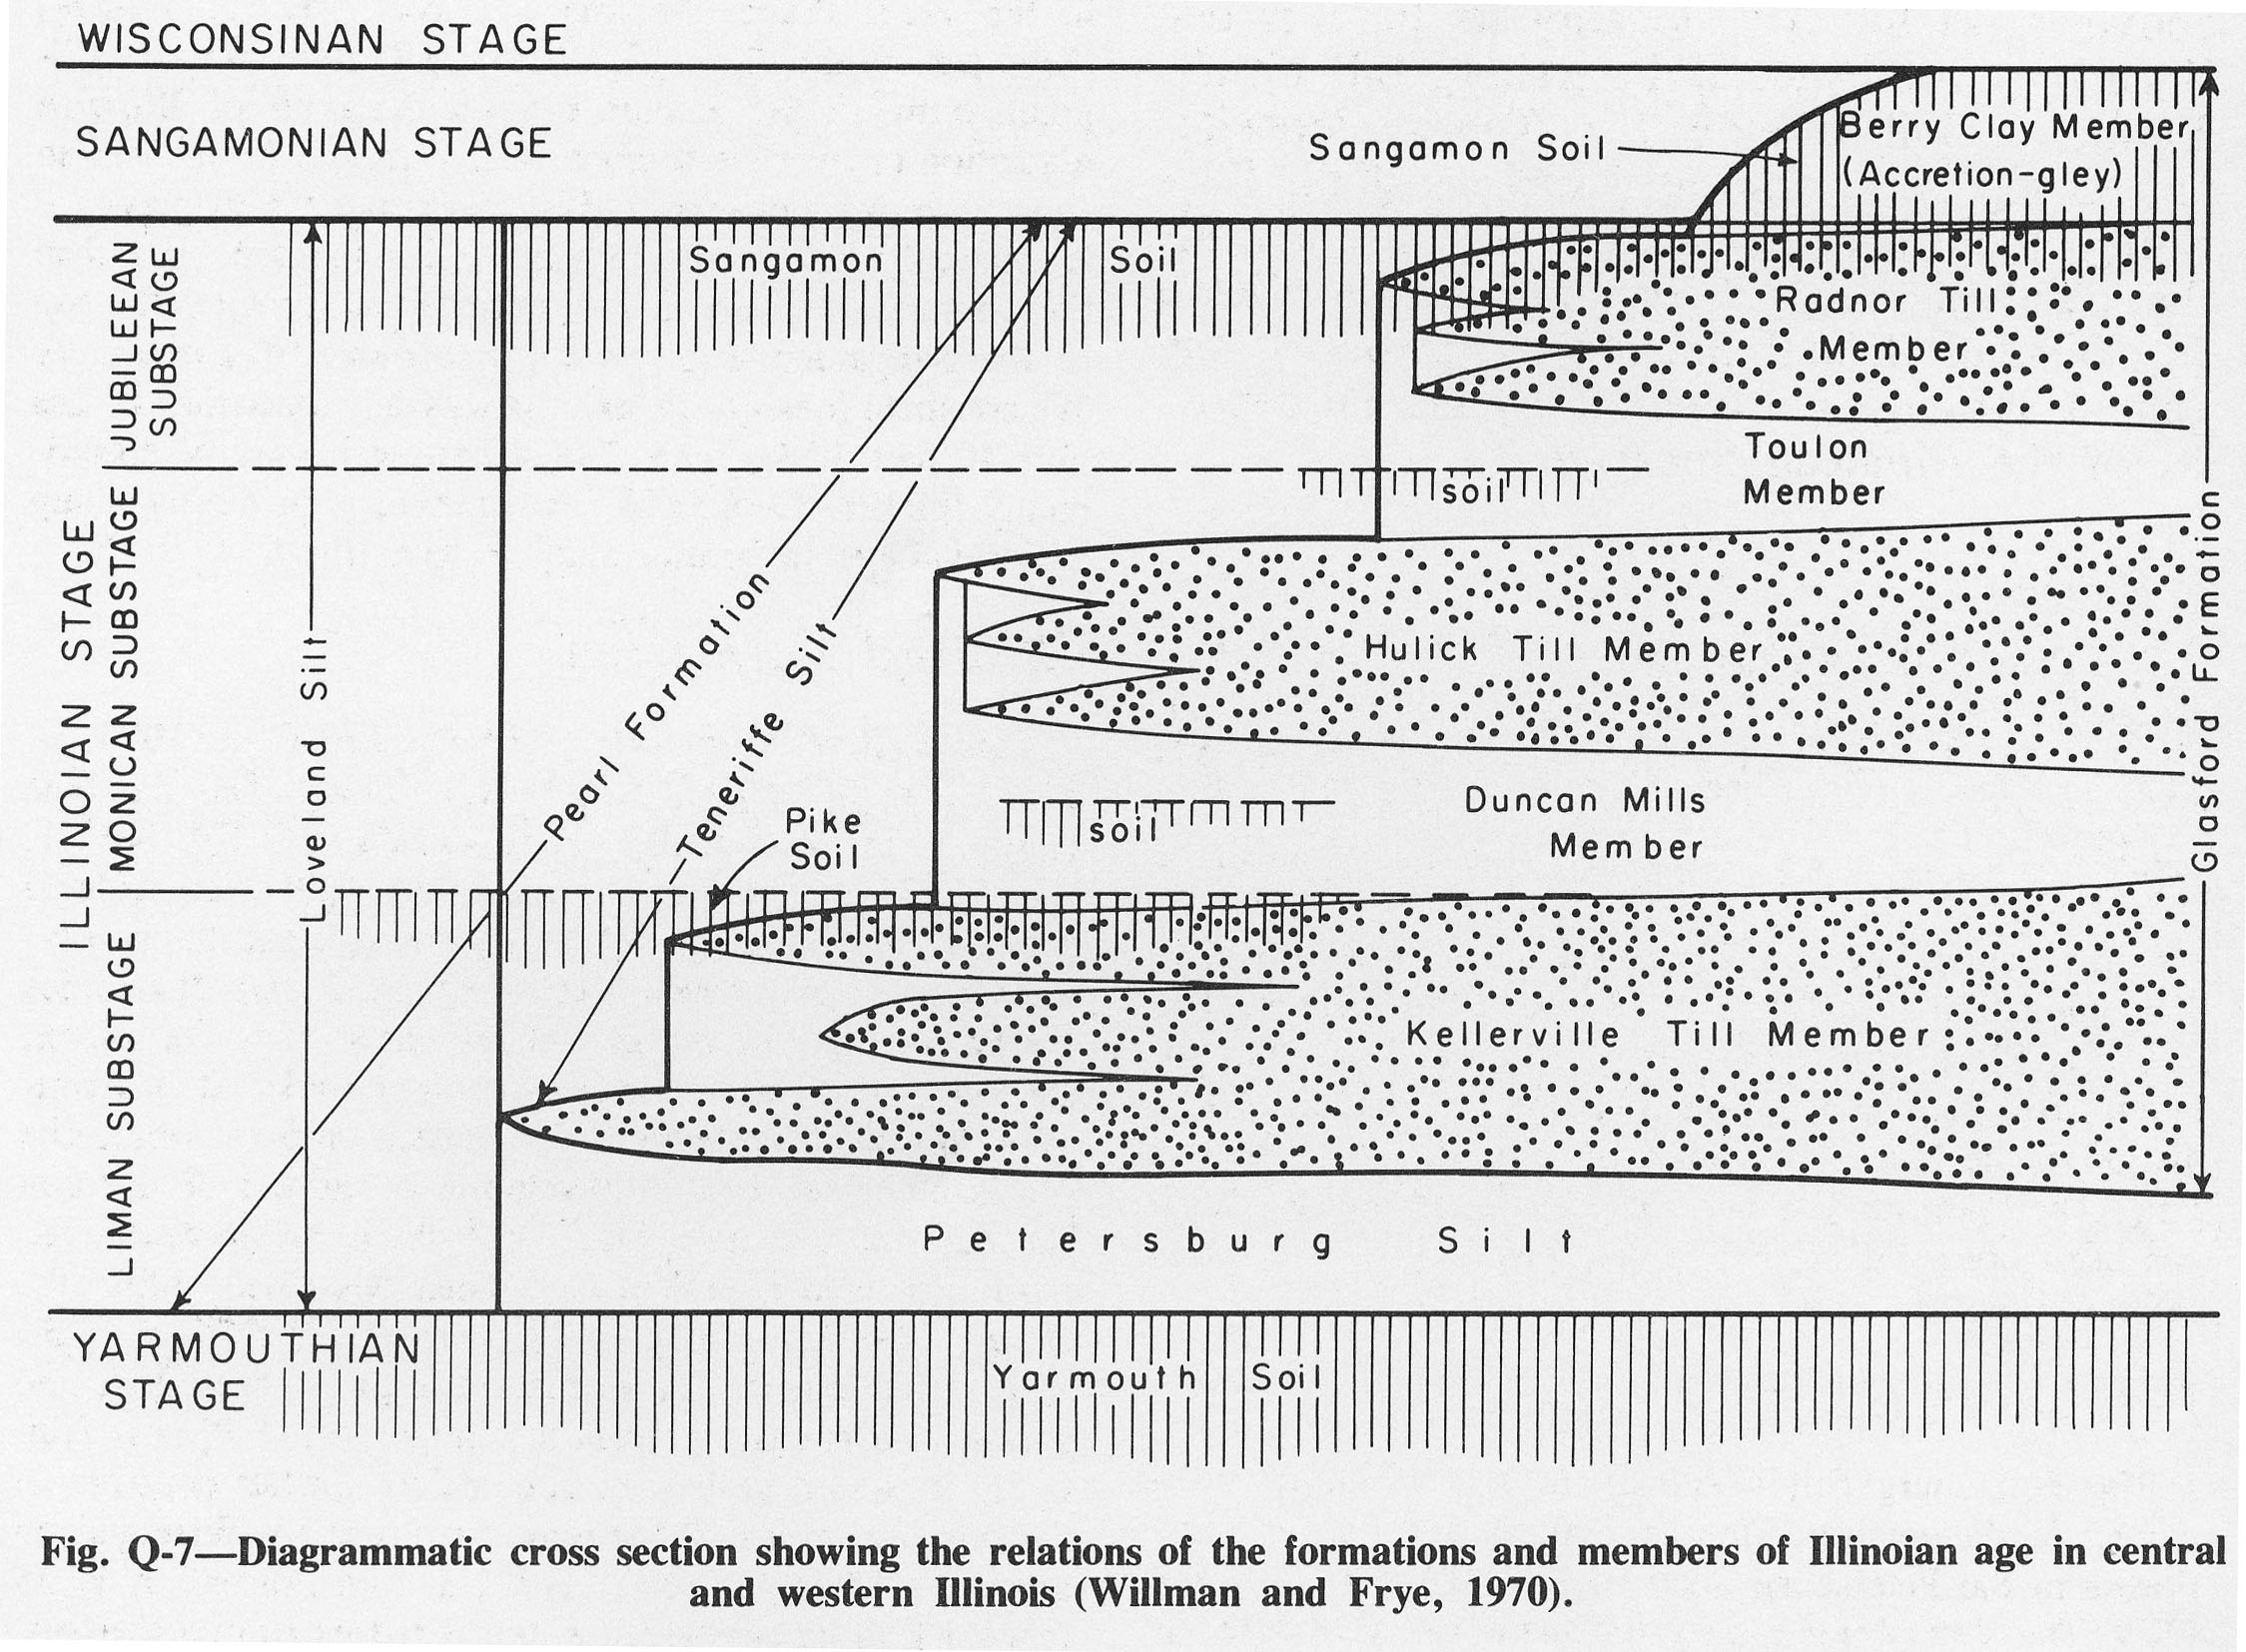
647 KB | Alan.Myers | Fig. Q-7 -- Diagrammatic cross section showing the relations of the formations and members of Illinoian age in central and western Illinois (Willman and Frye, 1970). | 1 |
| 15:53, 4 April 2016 | Figure Q-6.jpg (file) |  |
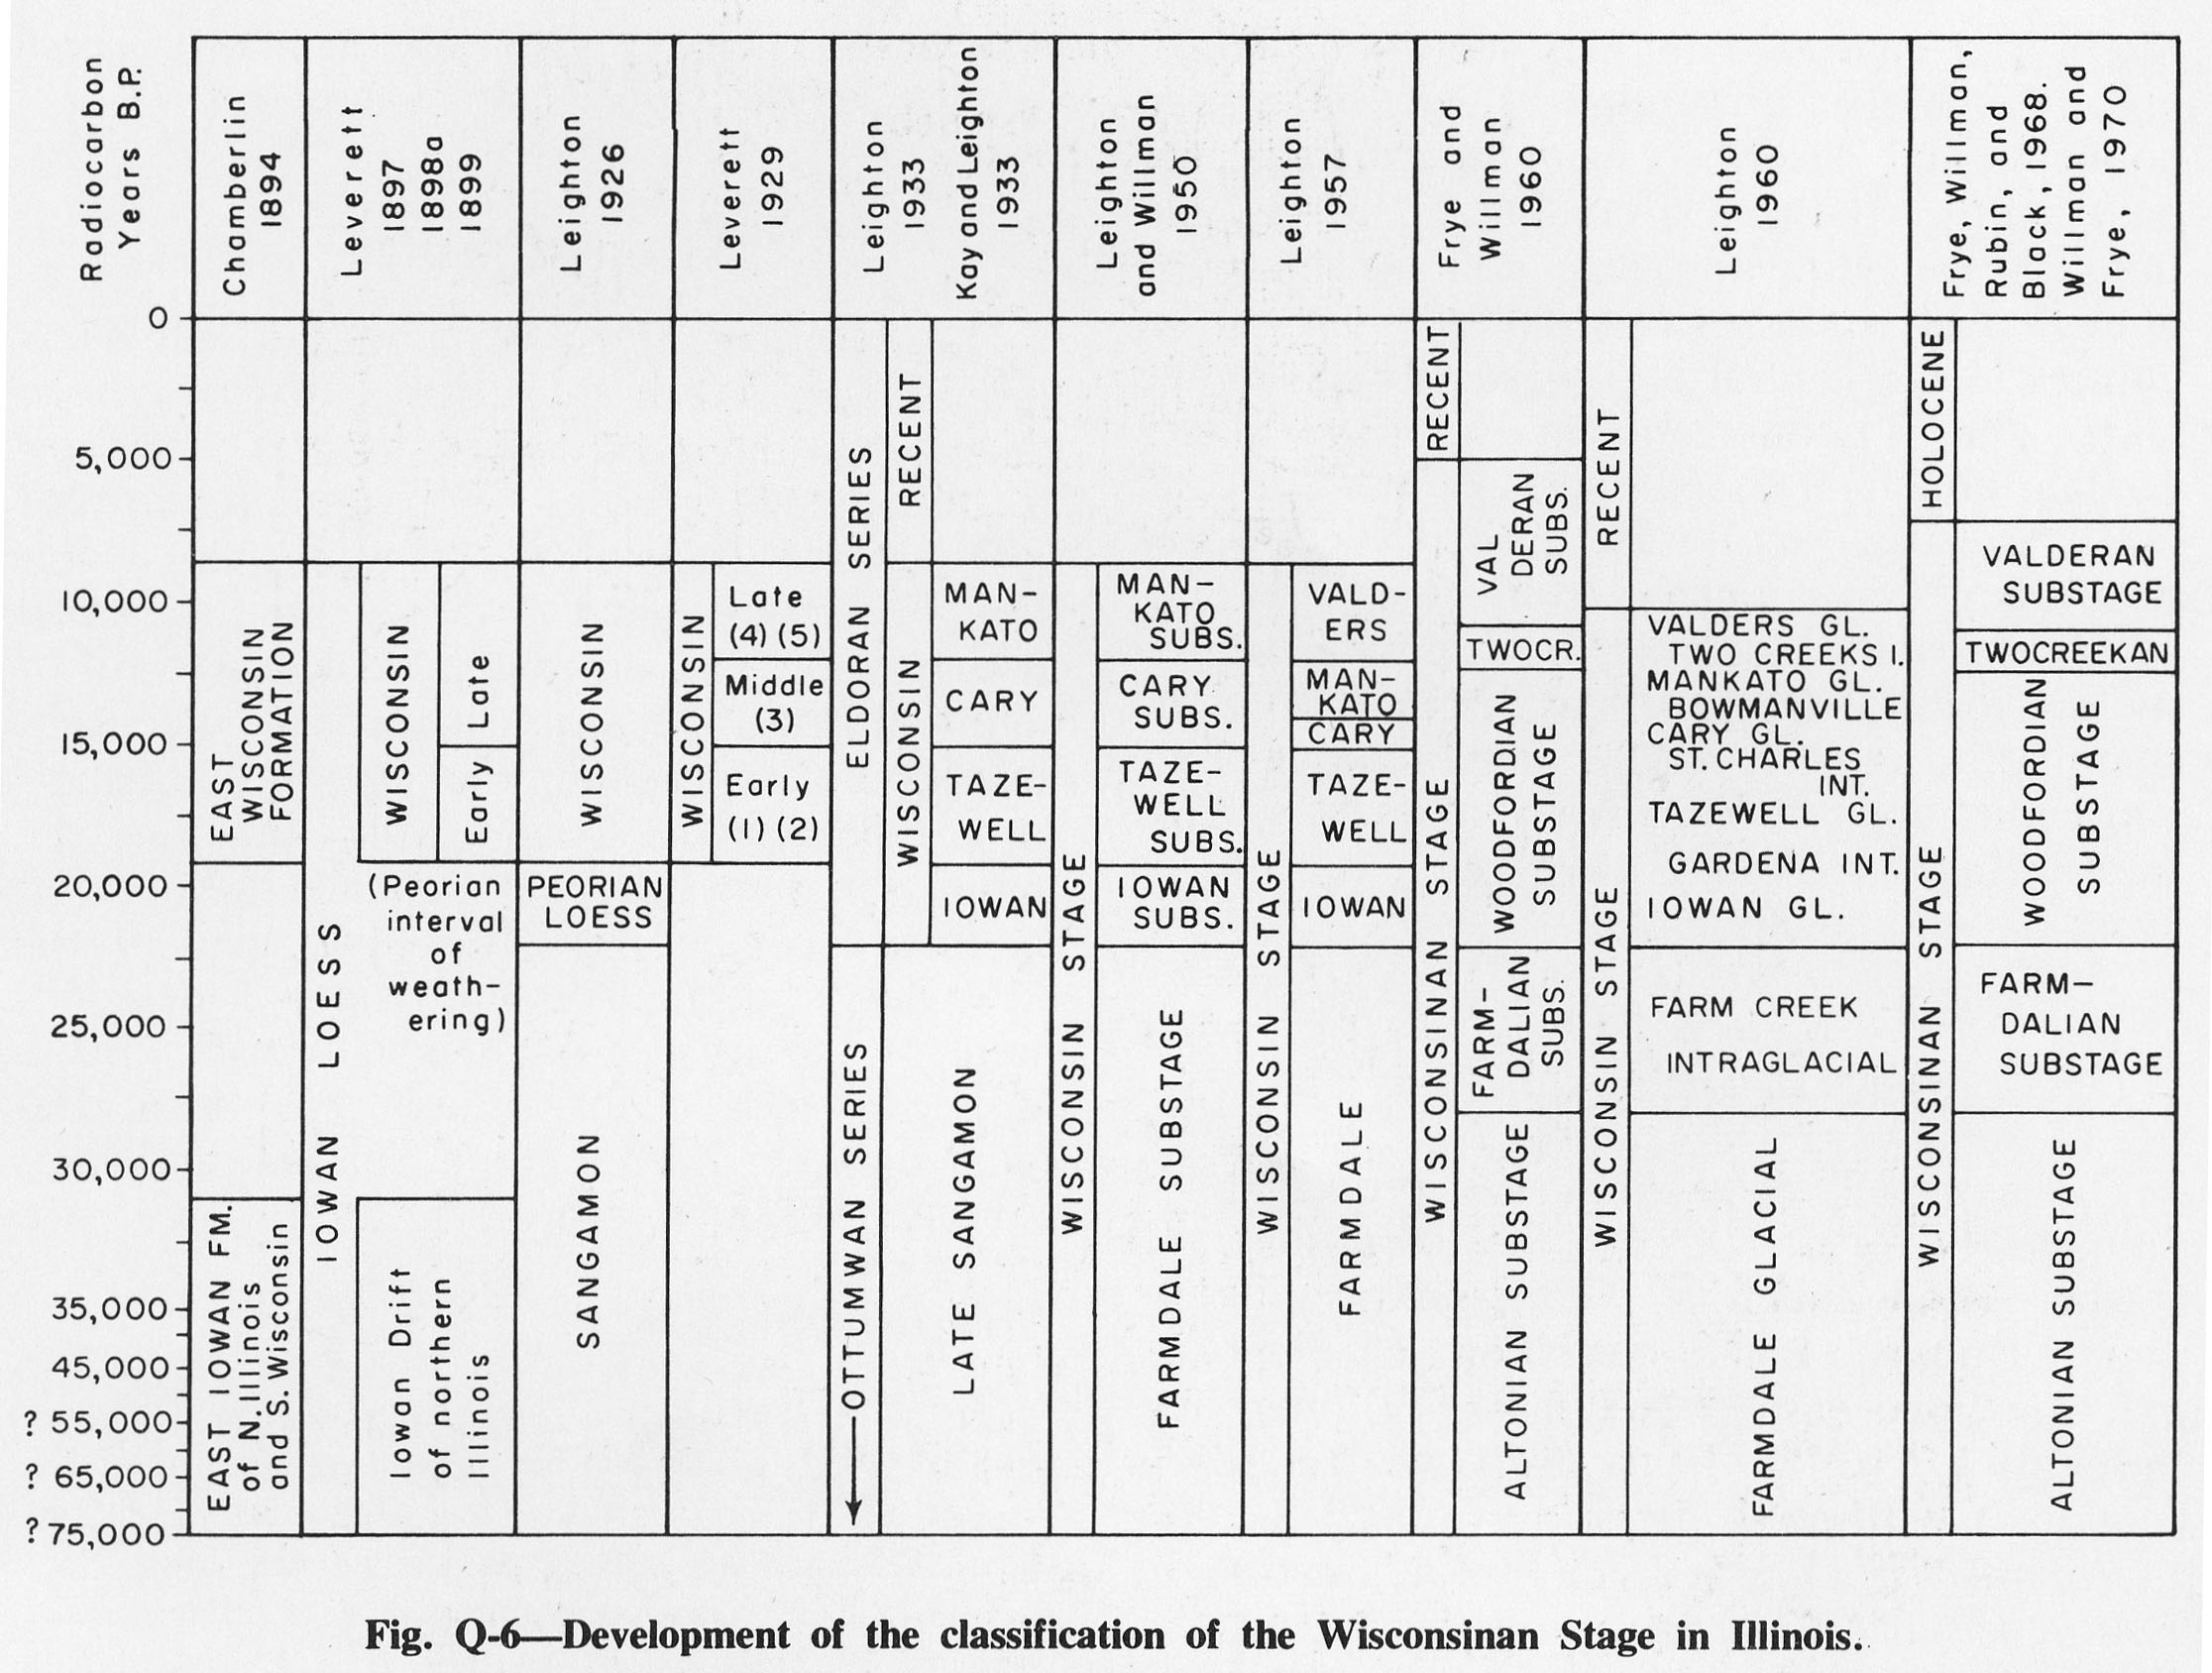
477 KB | Alan.Myers | Fig. Q-6 -- Development of classification of the Wisconsinan Stage in Illinois. | 1 |
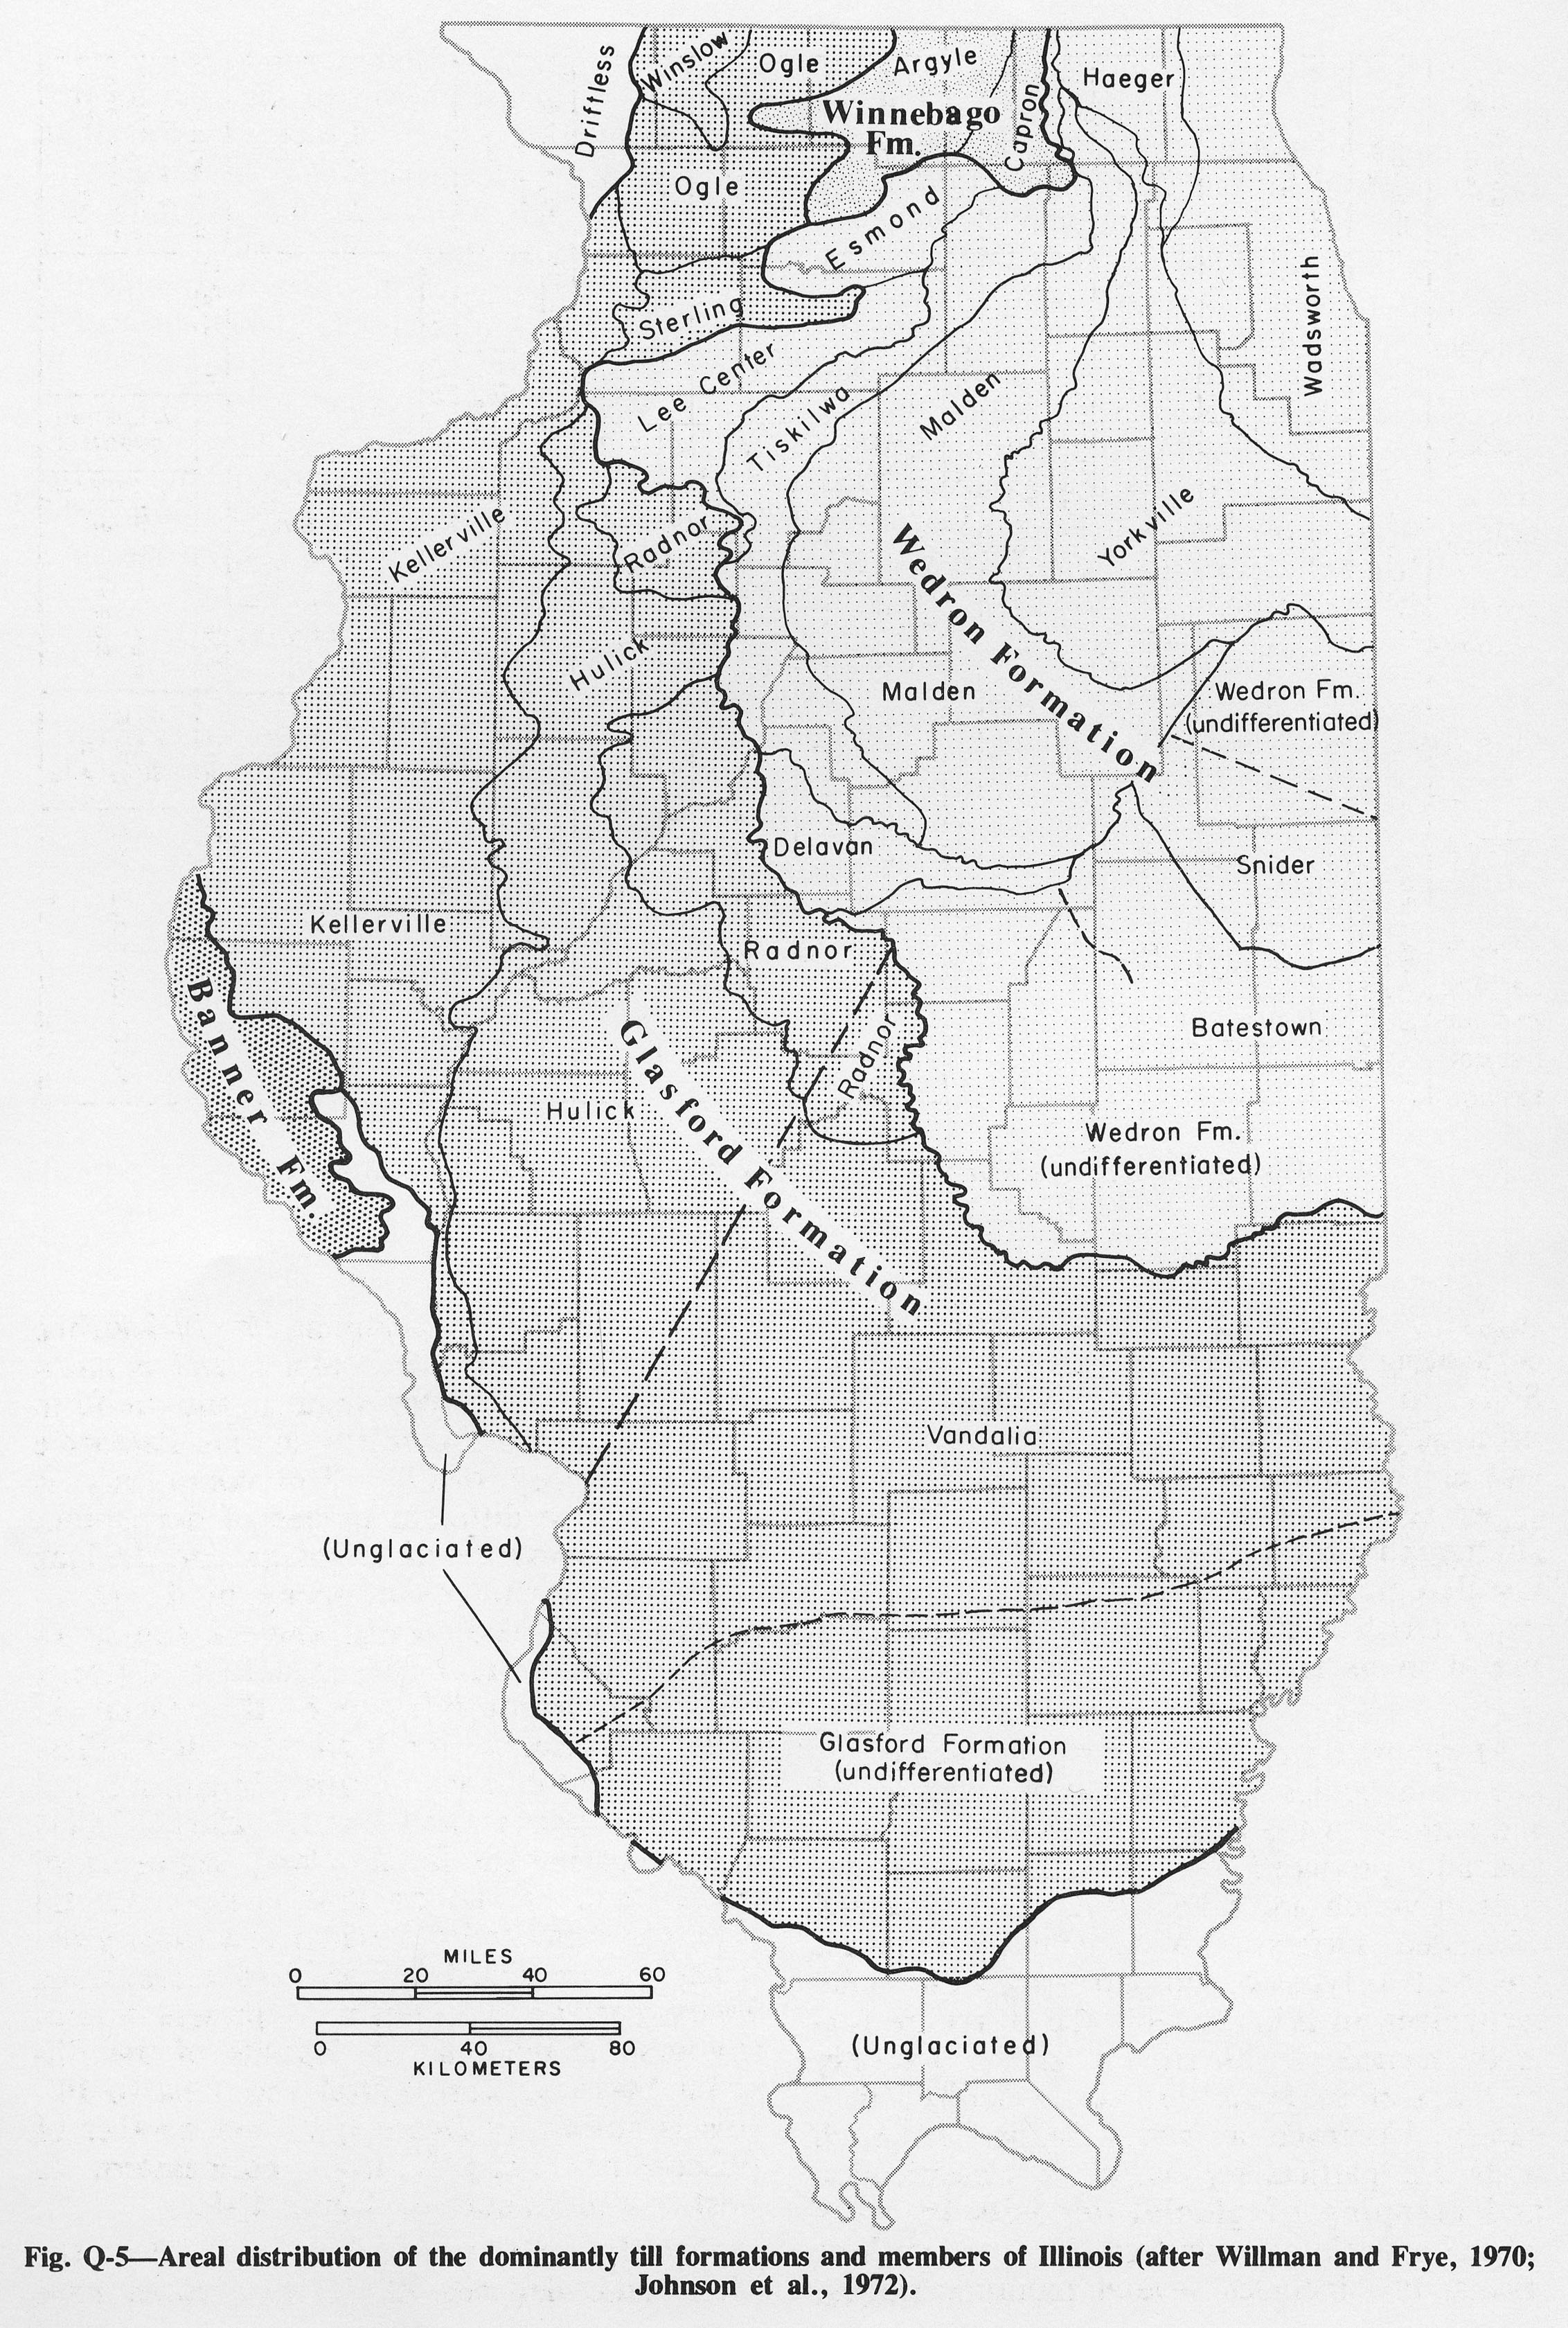
| 15:53, 4 April 2016 | Figure Q-5.jpg (file) |  |
1.68 MB | Alan.Myers | Fig. Q-5 -- Areal distribution of the dominantly till formations and members of Illinois (after Willman and Frye, 1970; Johnson et al., 1972). | 1 |
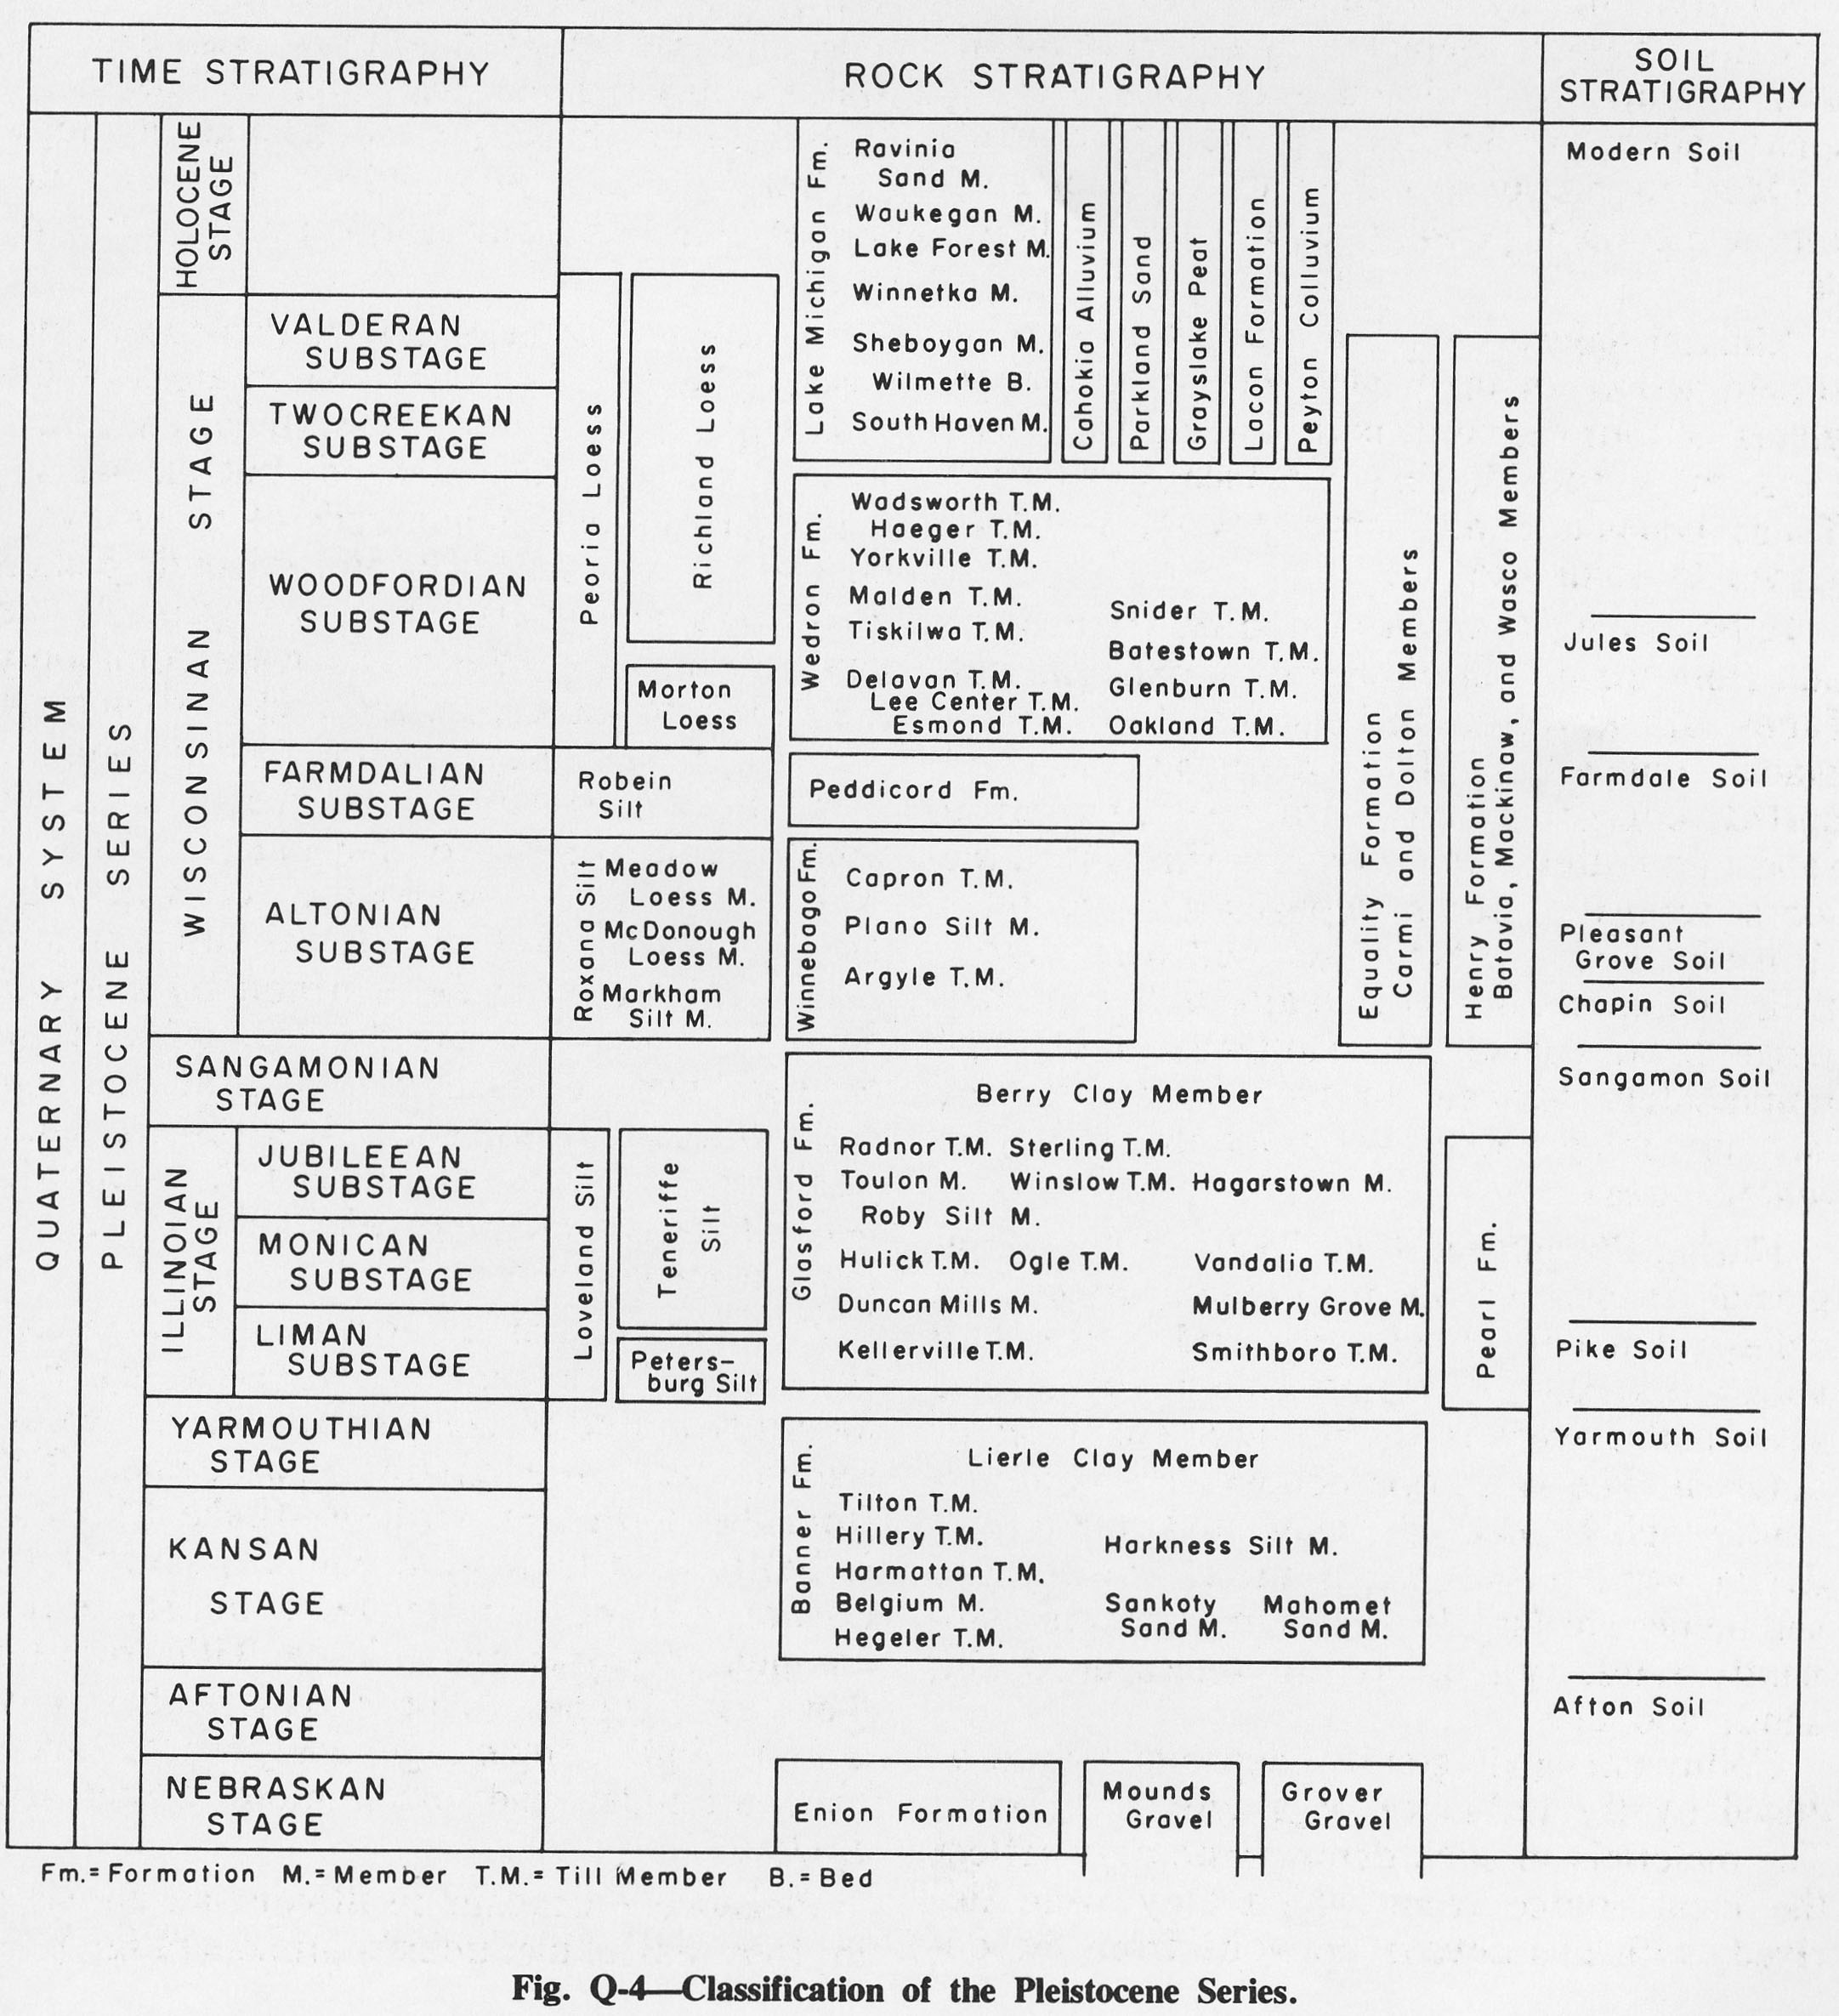
| 15:51, 4 April 2016 | Figure Q-4.jpg (file) |  |
613 KB | Alan.Myers | Fig. Q-4 -- Classification of the Pleistocene Series. | 1 |
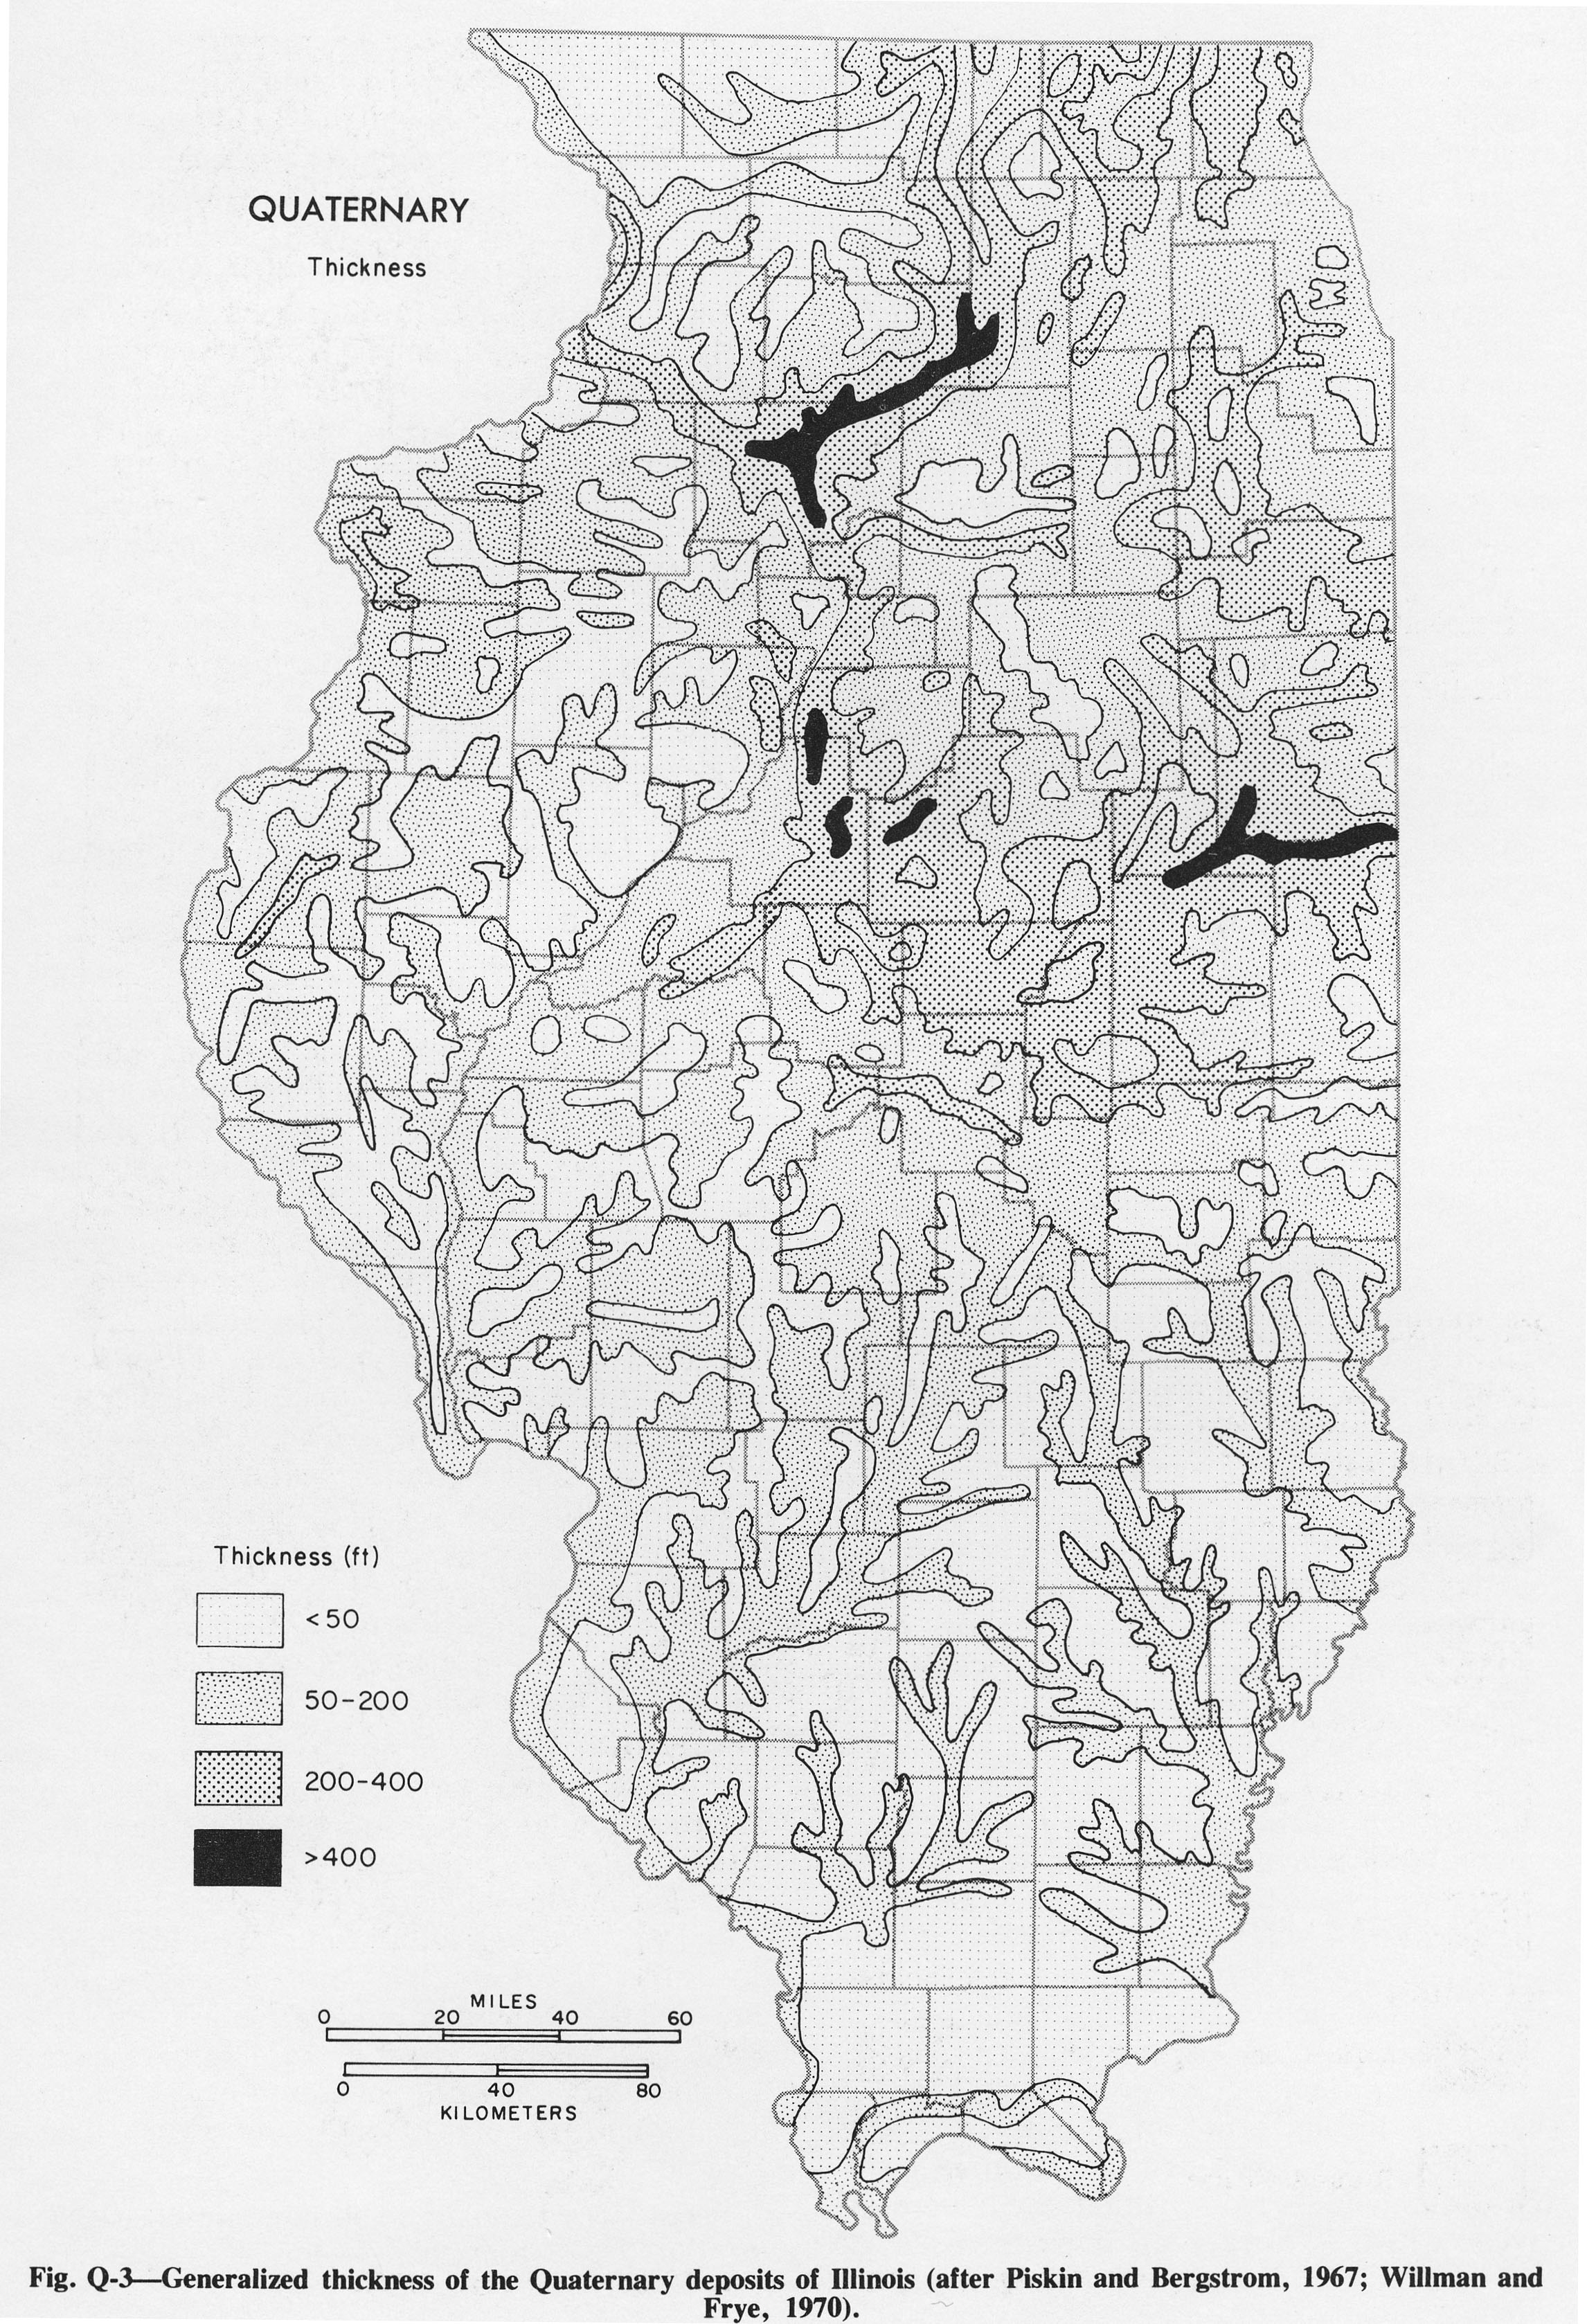
| 15:42, 4 April 2016 | Figure Q-3.jpg (file) |  |
1.55 MB | Alan.Myers | Fig. Q-3 -- Generalized thickness of the Quaternary deposits of Illinois (after Piskin and Bergstrom, 1967; Willman and Frye, 1970). | 1 |
| 15:41, 4 April 2016 | Figure Q-2.jpg (file) |  |
1.76 MB | Alan.Myers | Fig. Q-2 -- Glacial map of Illinois (after Willman and Frye, 1970). | 1 |
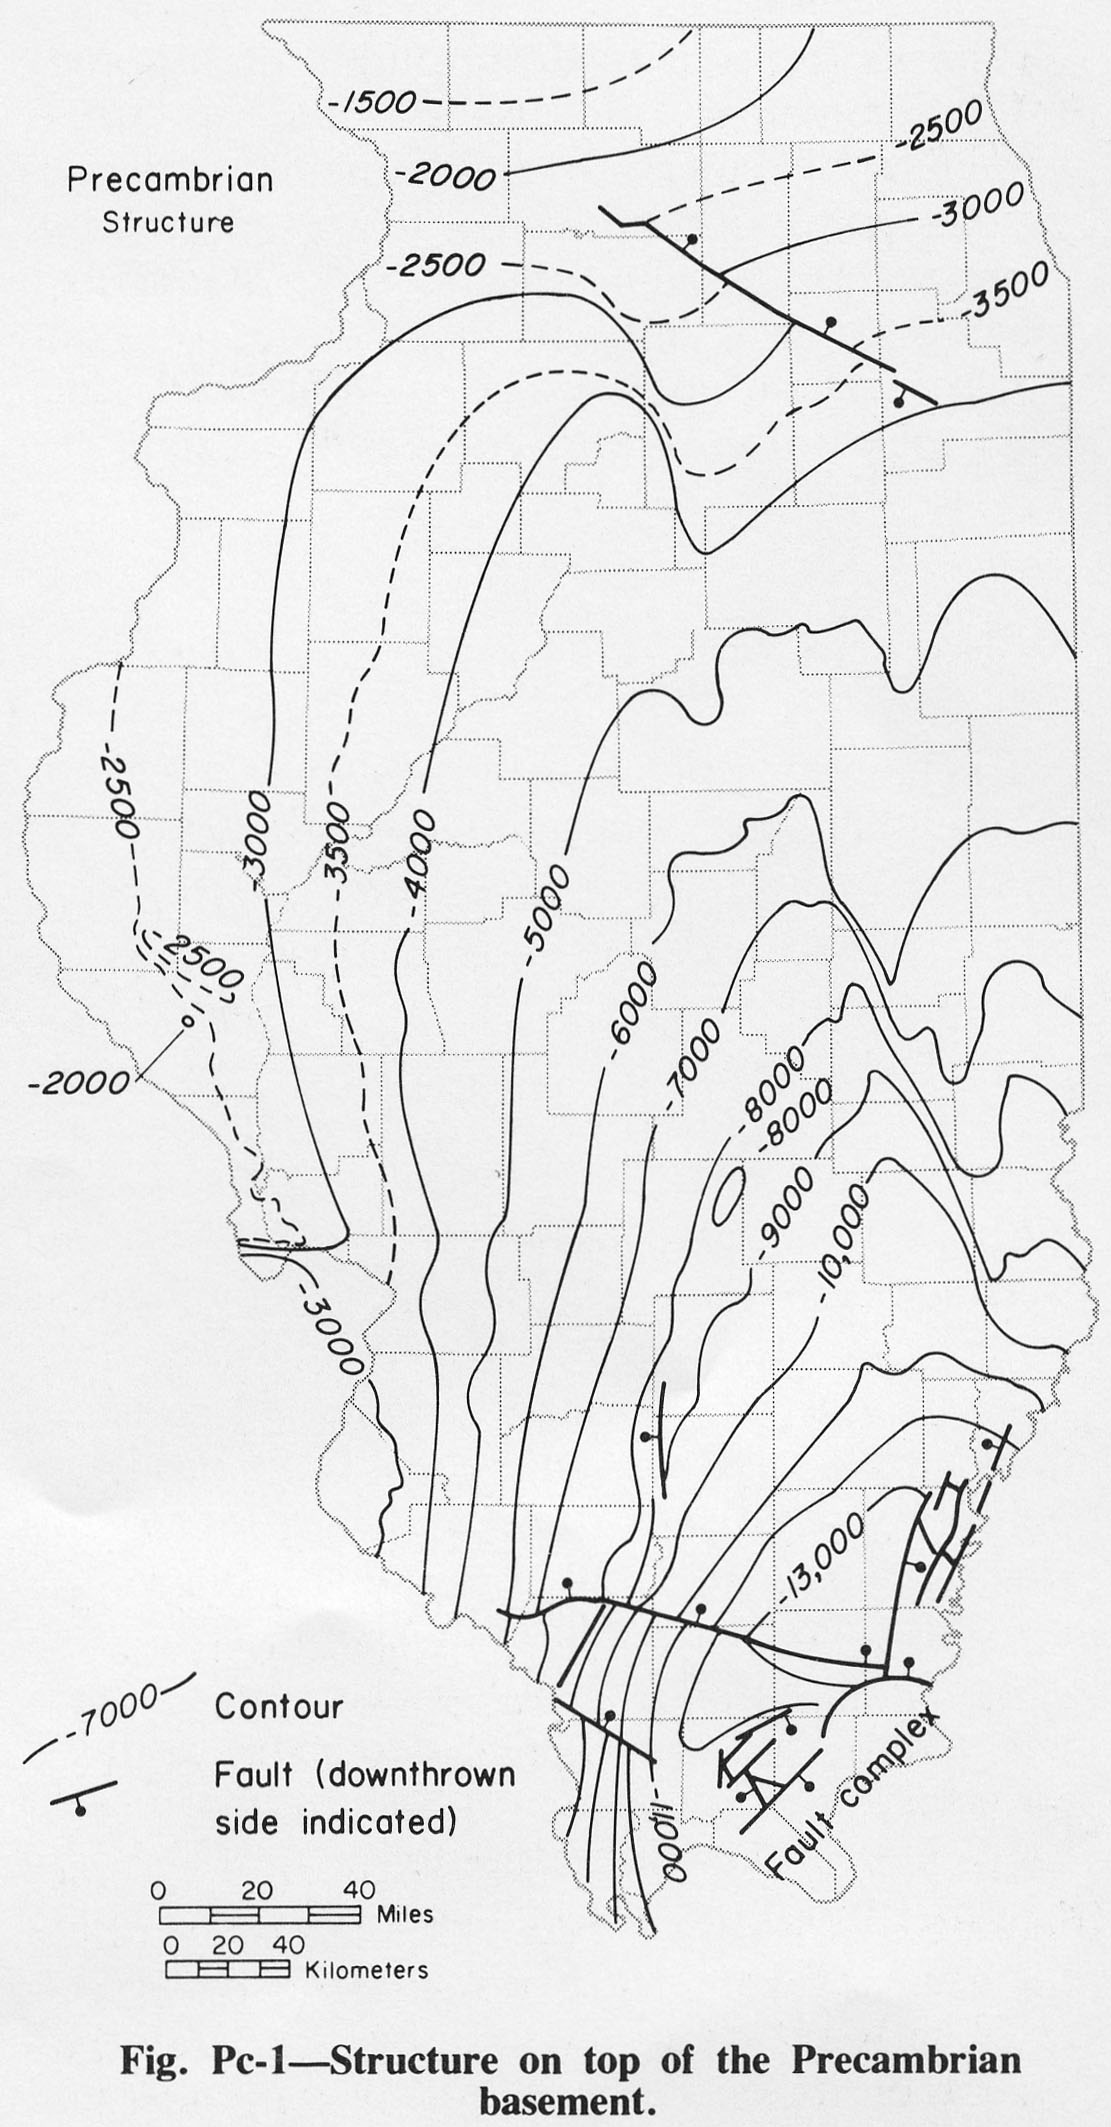
| 15:14, 4 April 2016 | Figure Pc-1.jpg (file) |  |
328 KB | Alan.Myers | Fig. Pc-1 -- Structure on top of the Precambrian basement. | 1 |
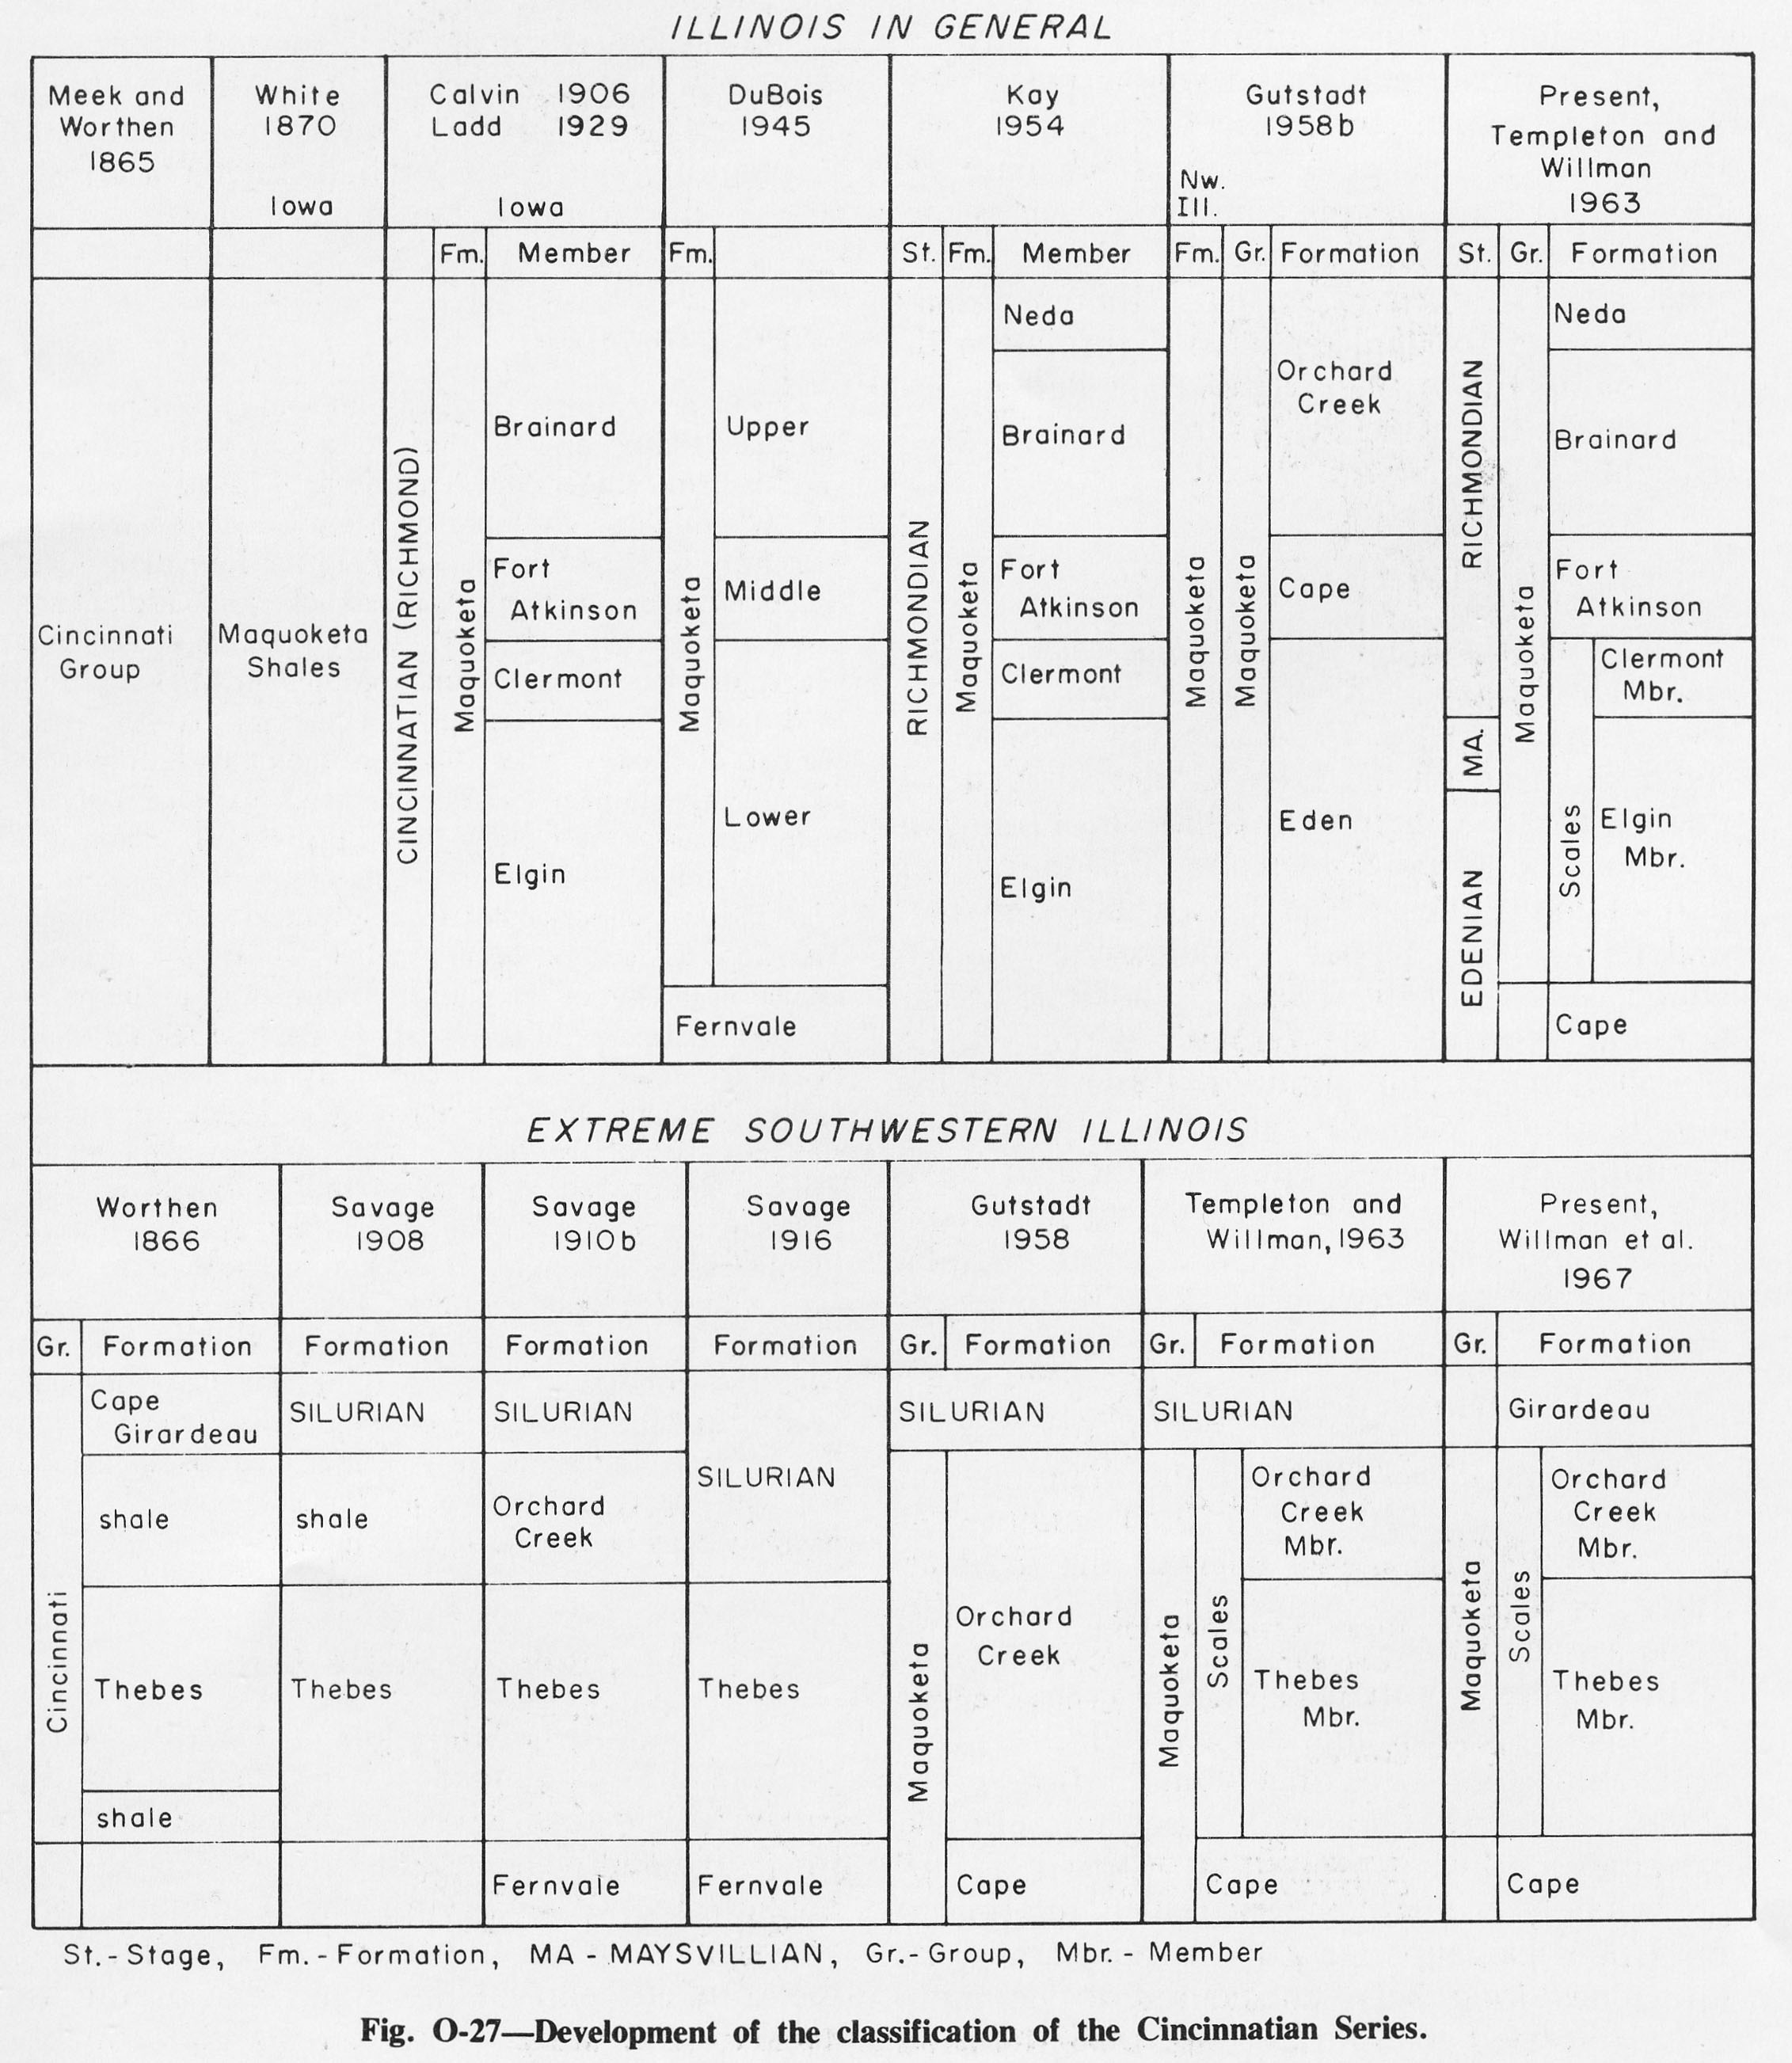
| 15:13, 4 April 2016 | Figure O-27.jpg (file) |  |
605 KB | Alan.Myers | Fig. O-27 -- Development of the classification of the Cincinnatian Series. | 1 |
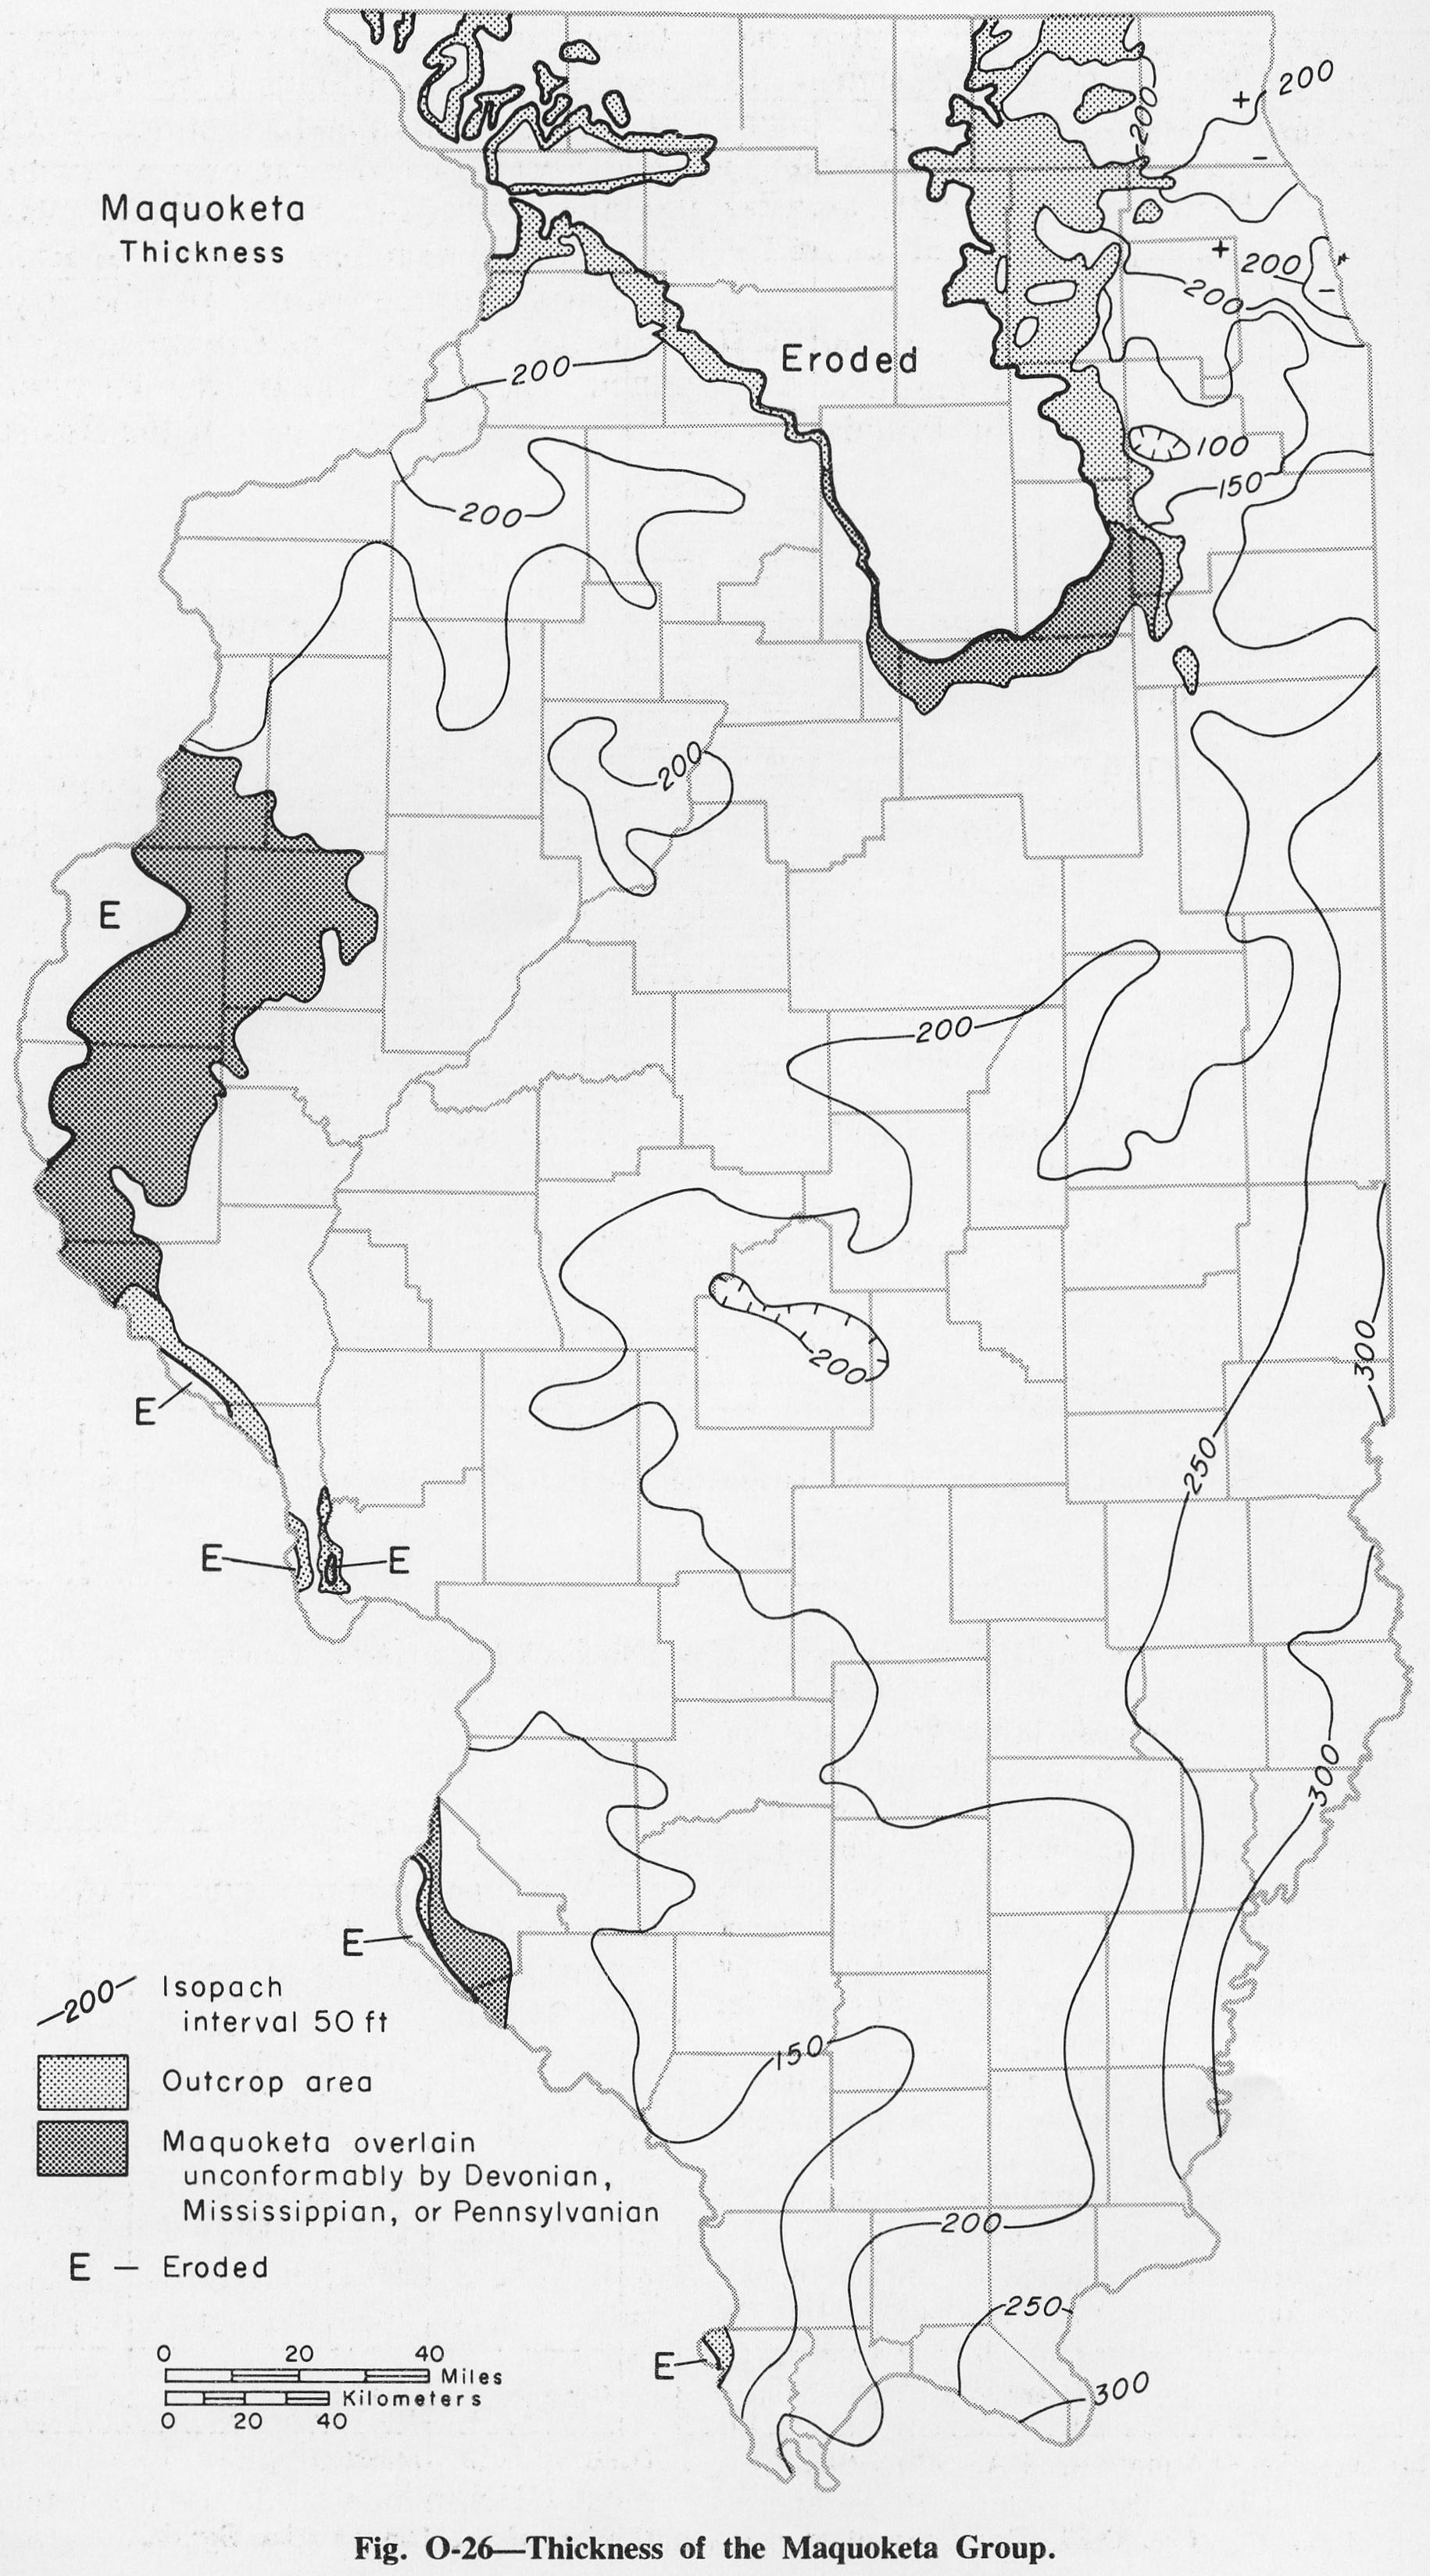
| 15:11, 4 April 2016 | Figure O-26.jpg (file) |  |
752 KB | Alan.Myers | Fig O-26 -- Thickness of the Maquoketa Group. | 1 |
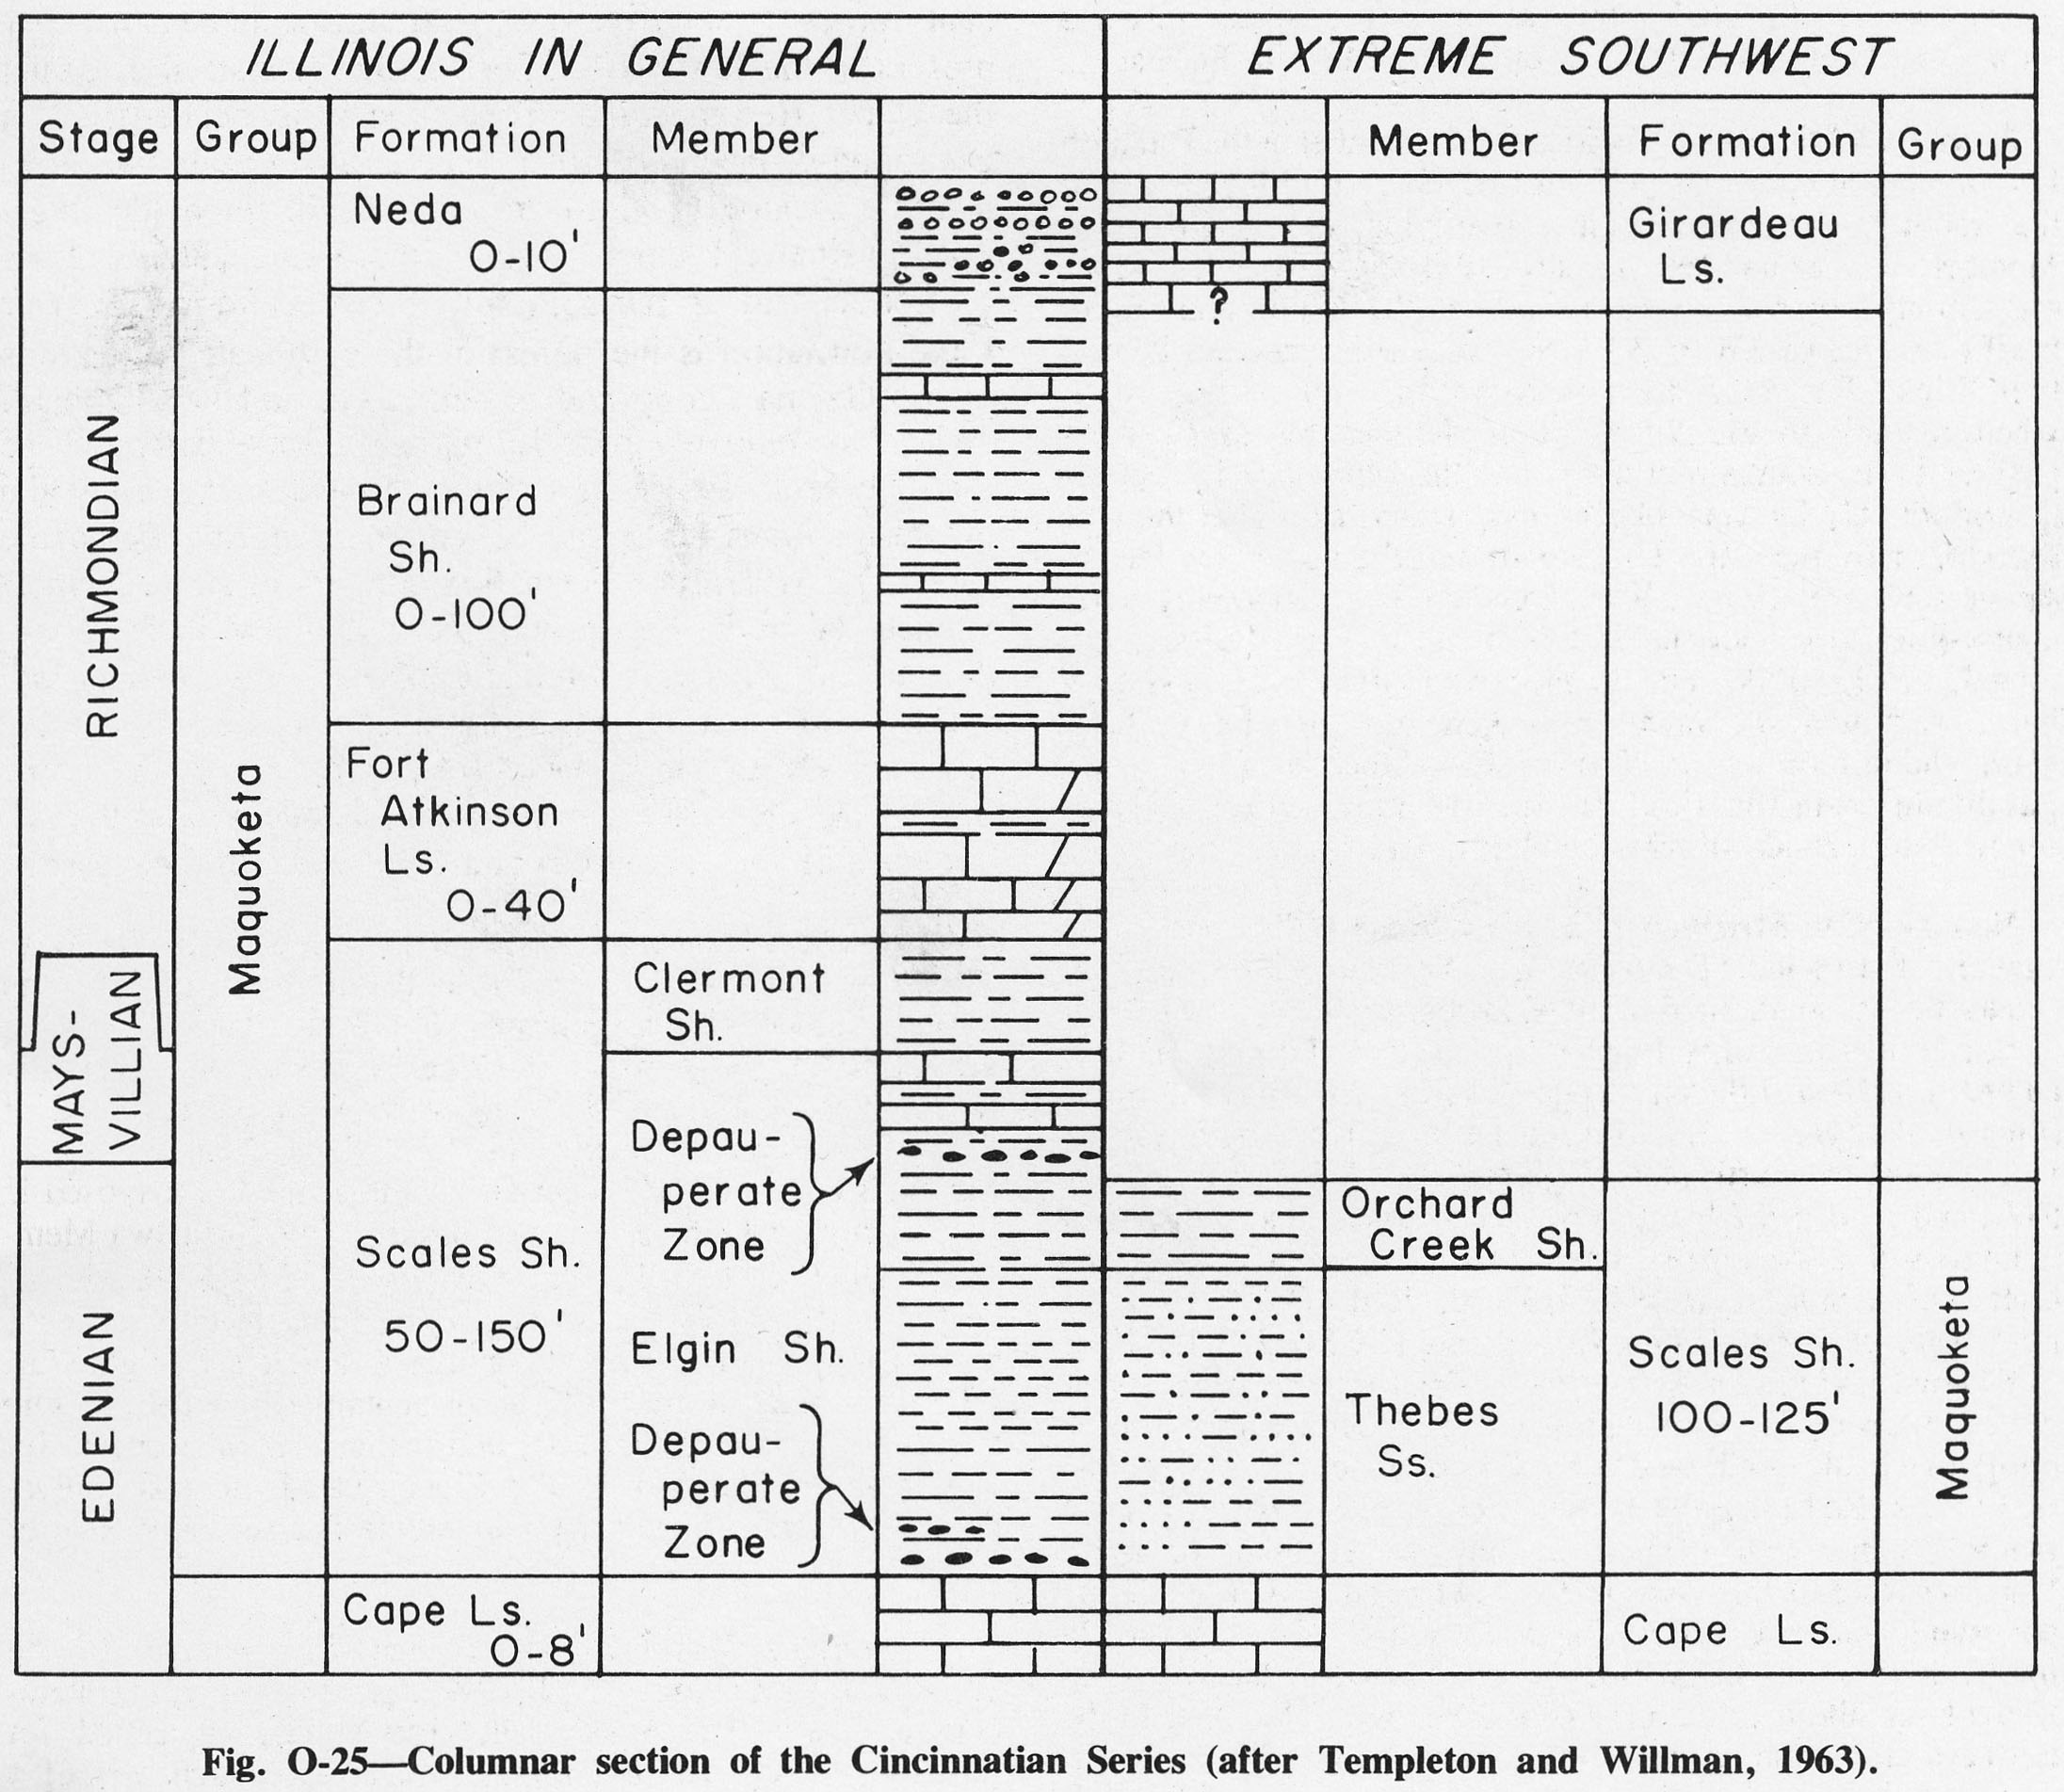
| 15:05, 4 April 2016 | Figure O-25.jpg (file) |  |
492 KB | Alan.Myers | Fig. O-25 -- Columnar section of the Cincinnatian Series (after Templeton and Willman, 1963). | 1 |
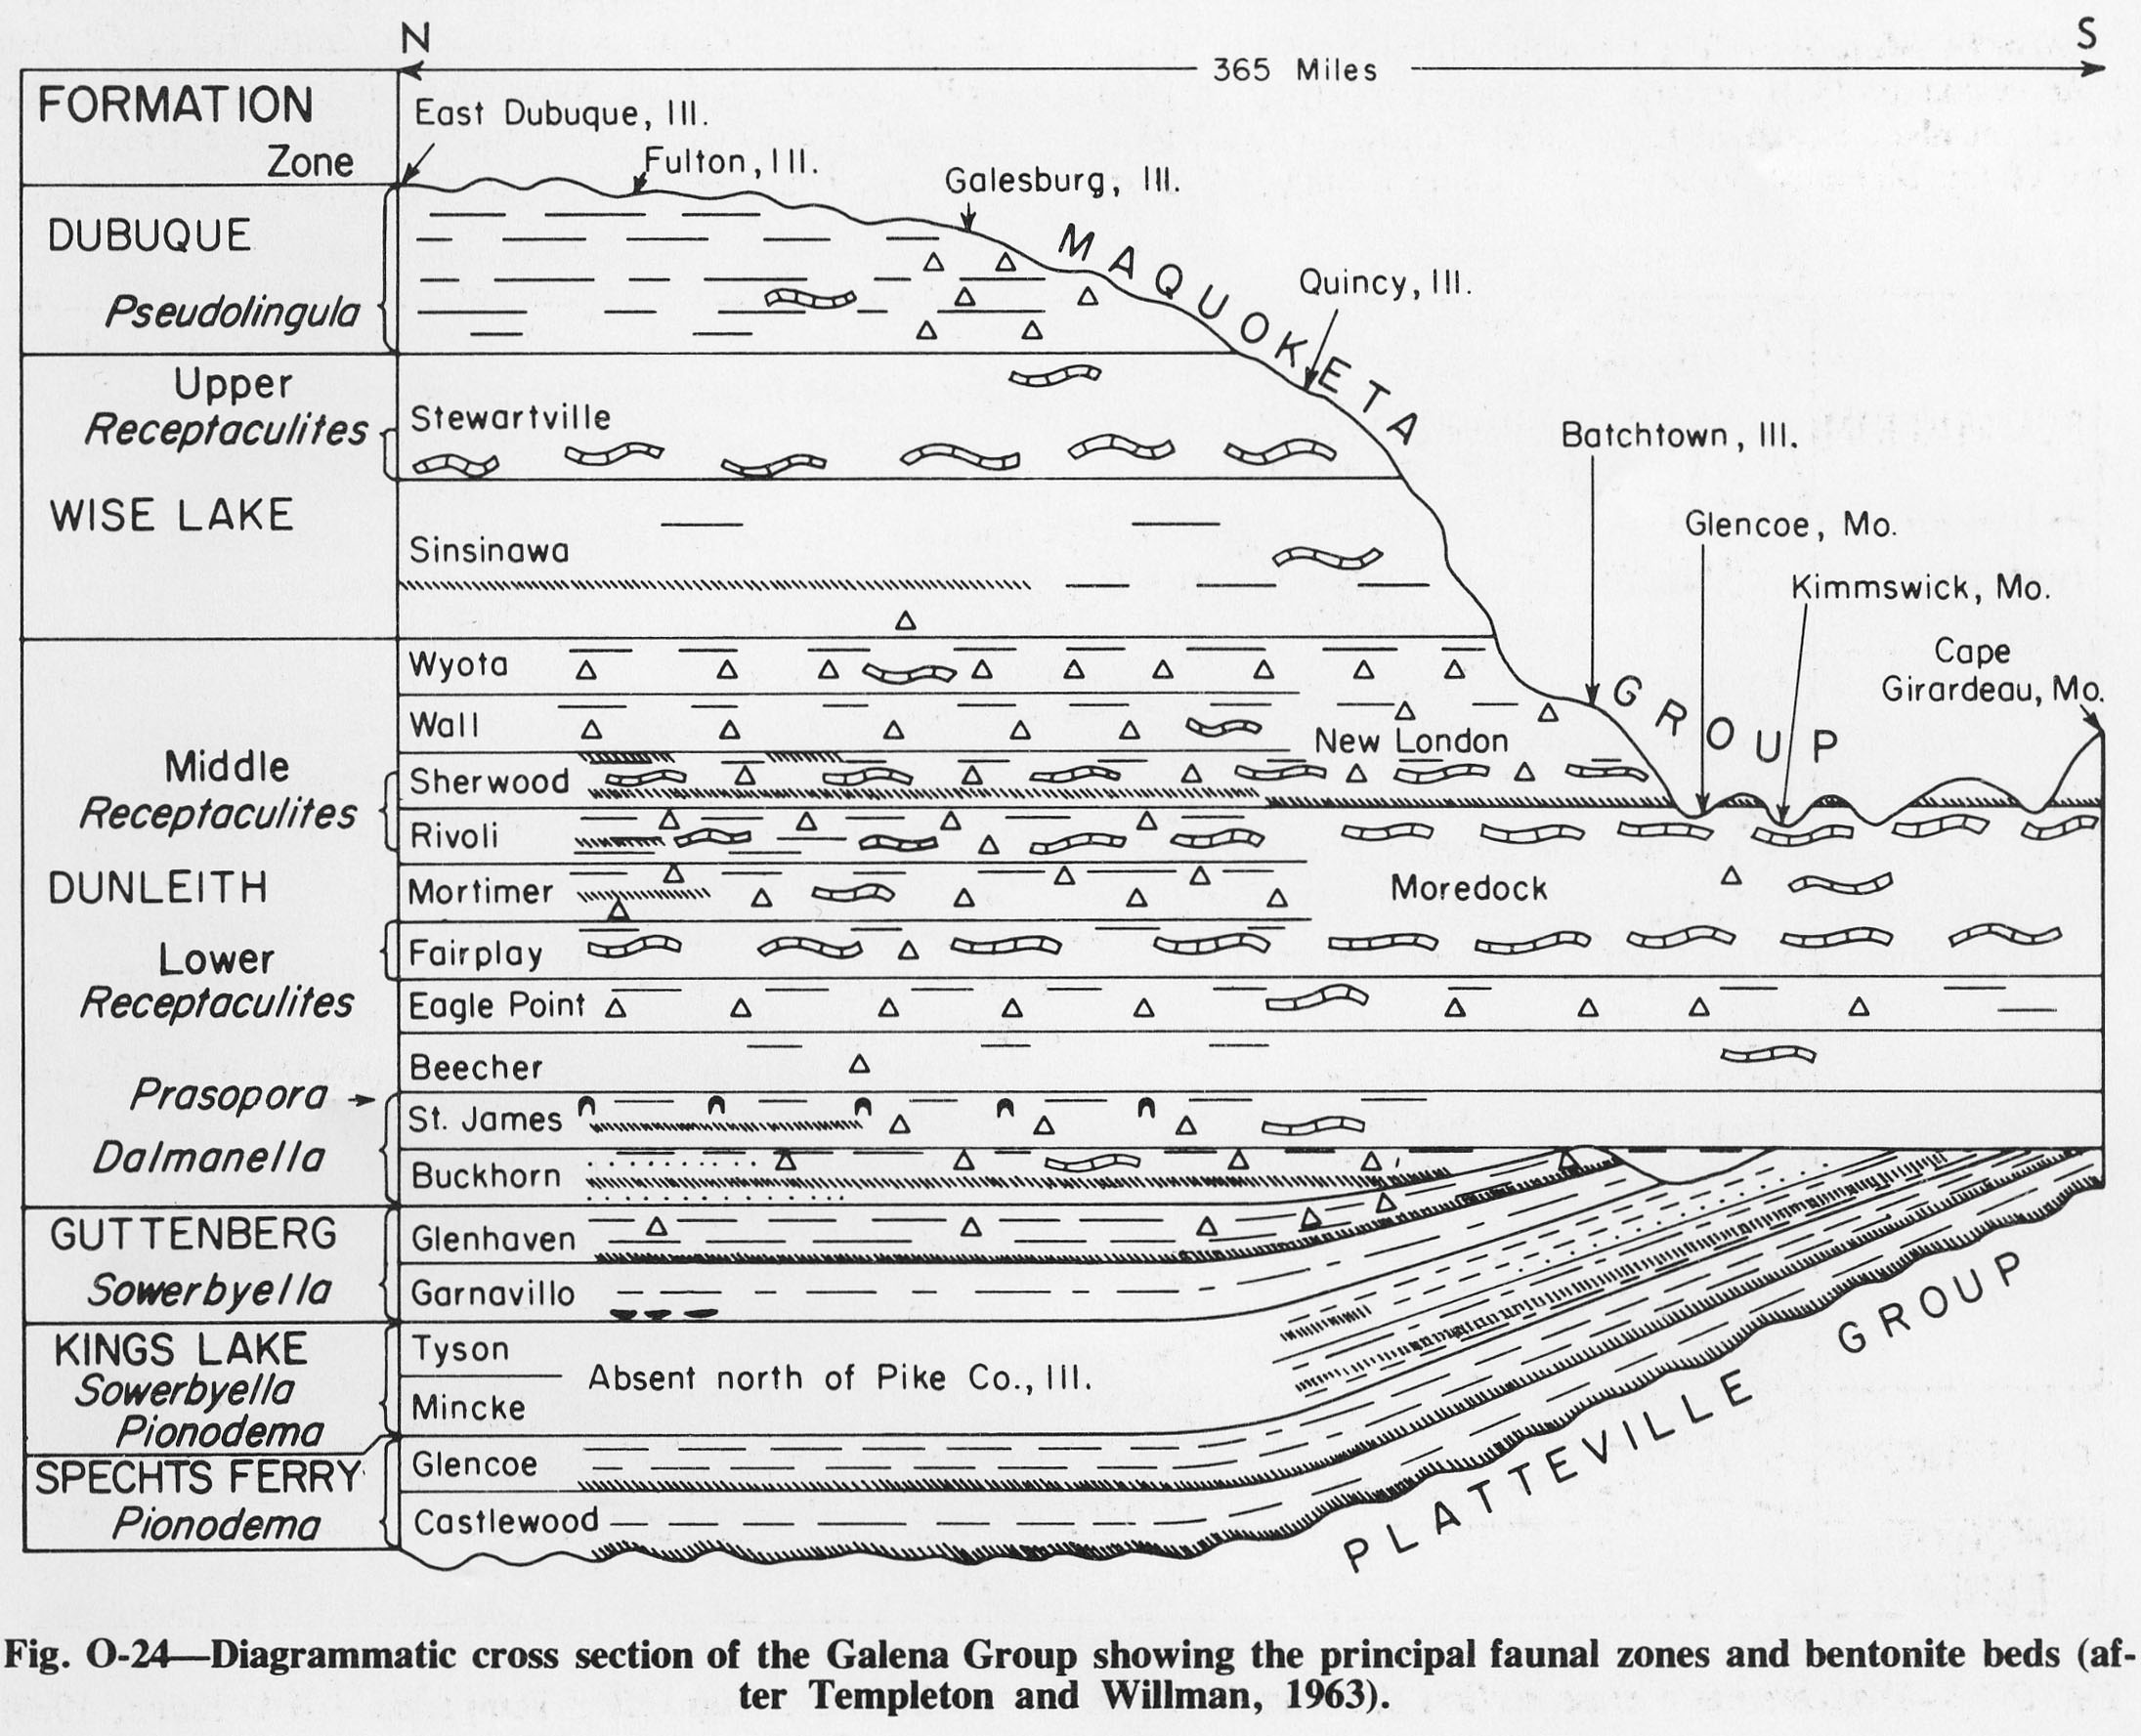
| 15:04, 4 April 2016 | Figure O-24.jpg (file) |  |
550 KB | Alan.Myers | Fig. O-24 -- Diagrammatic cross section of the Galena Group showing the principal faunal zones and bentonite beds (after Templeton and Willman, 1963). | 1 |
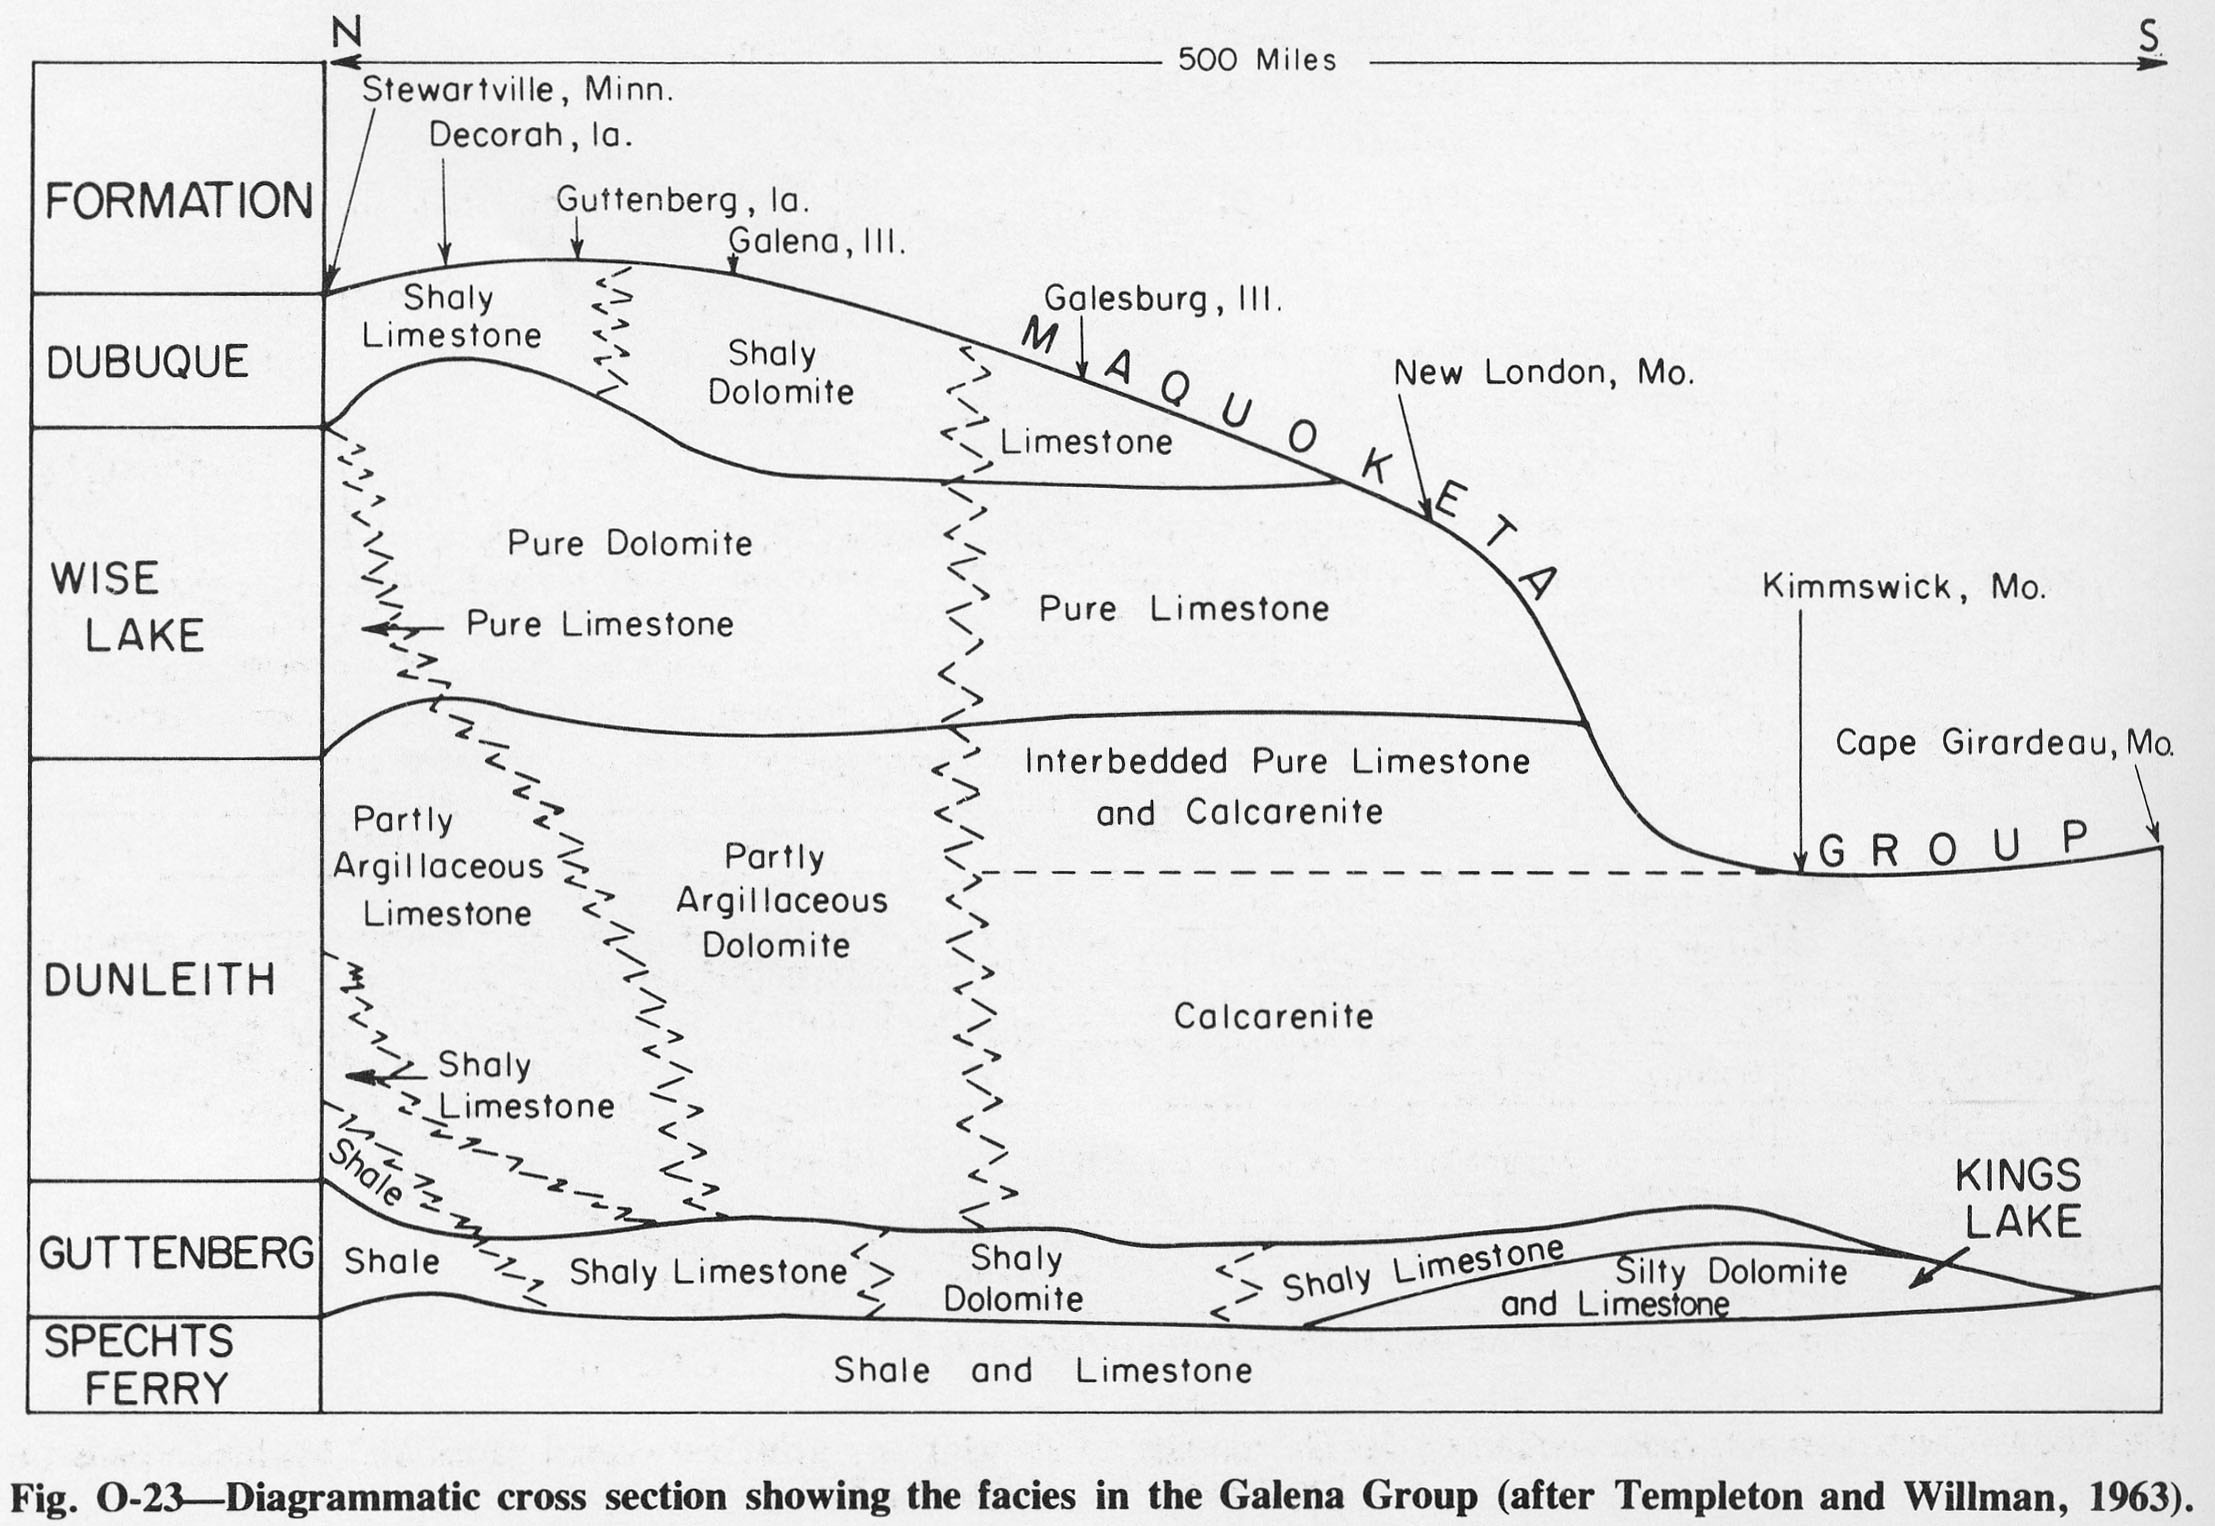
| 15:03, 4 April 2016 | Figure O-23.jpg (file) |  |
368 KB | Alan.Myers | Fig. O-23 -- Diagrammatic cross section showing the facies in the Galena Group. (after Templeton and Willman, 1963). | 1 |
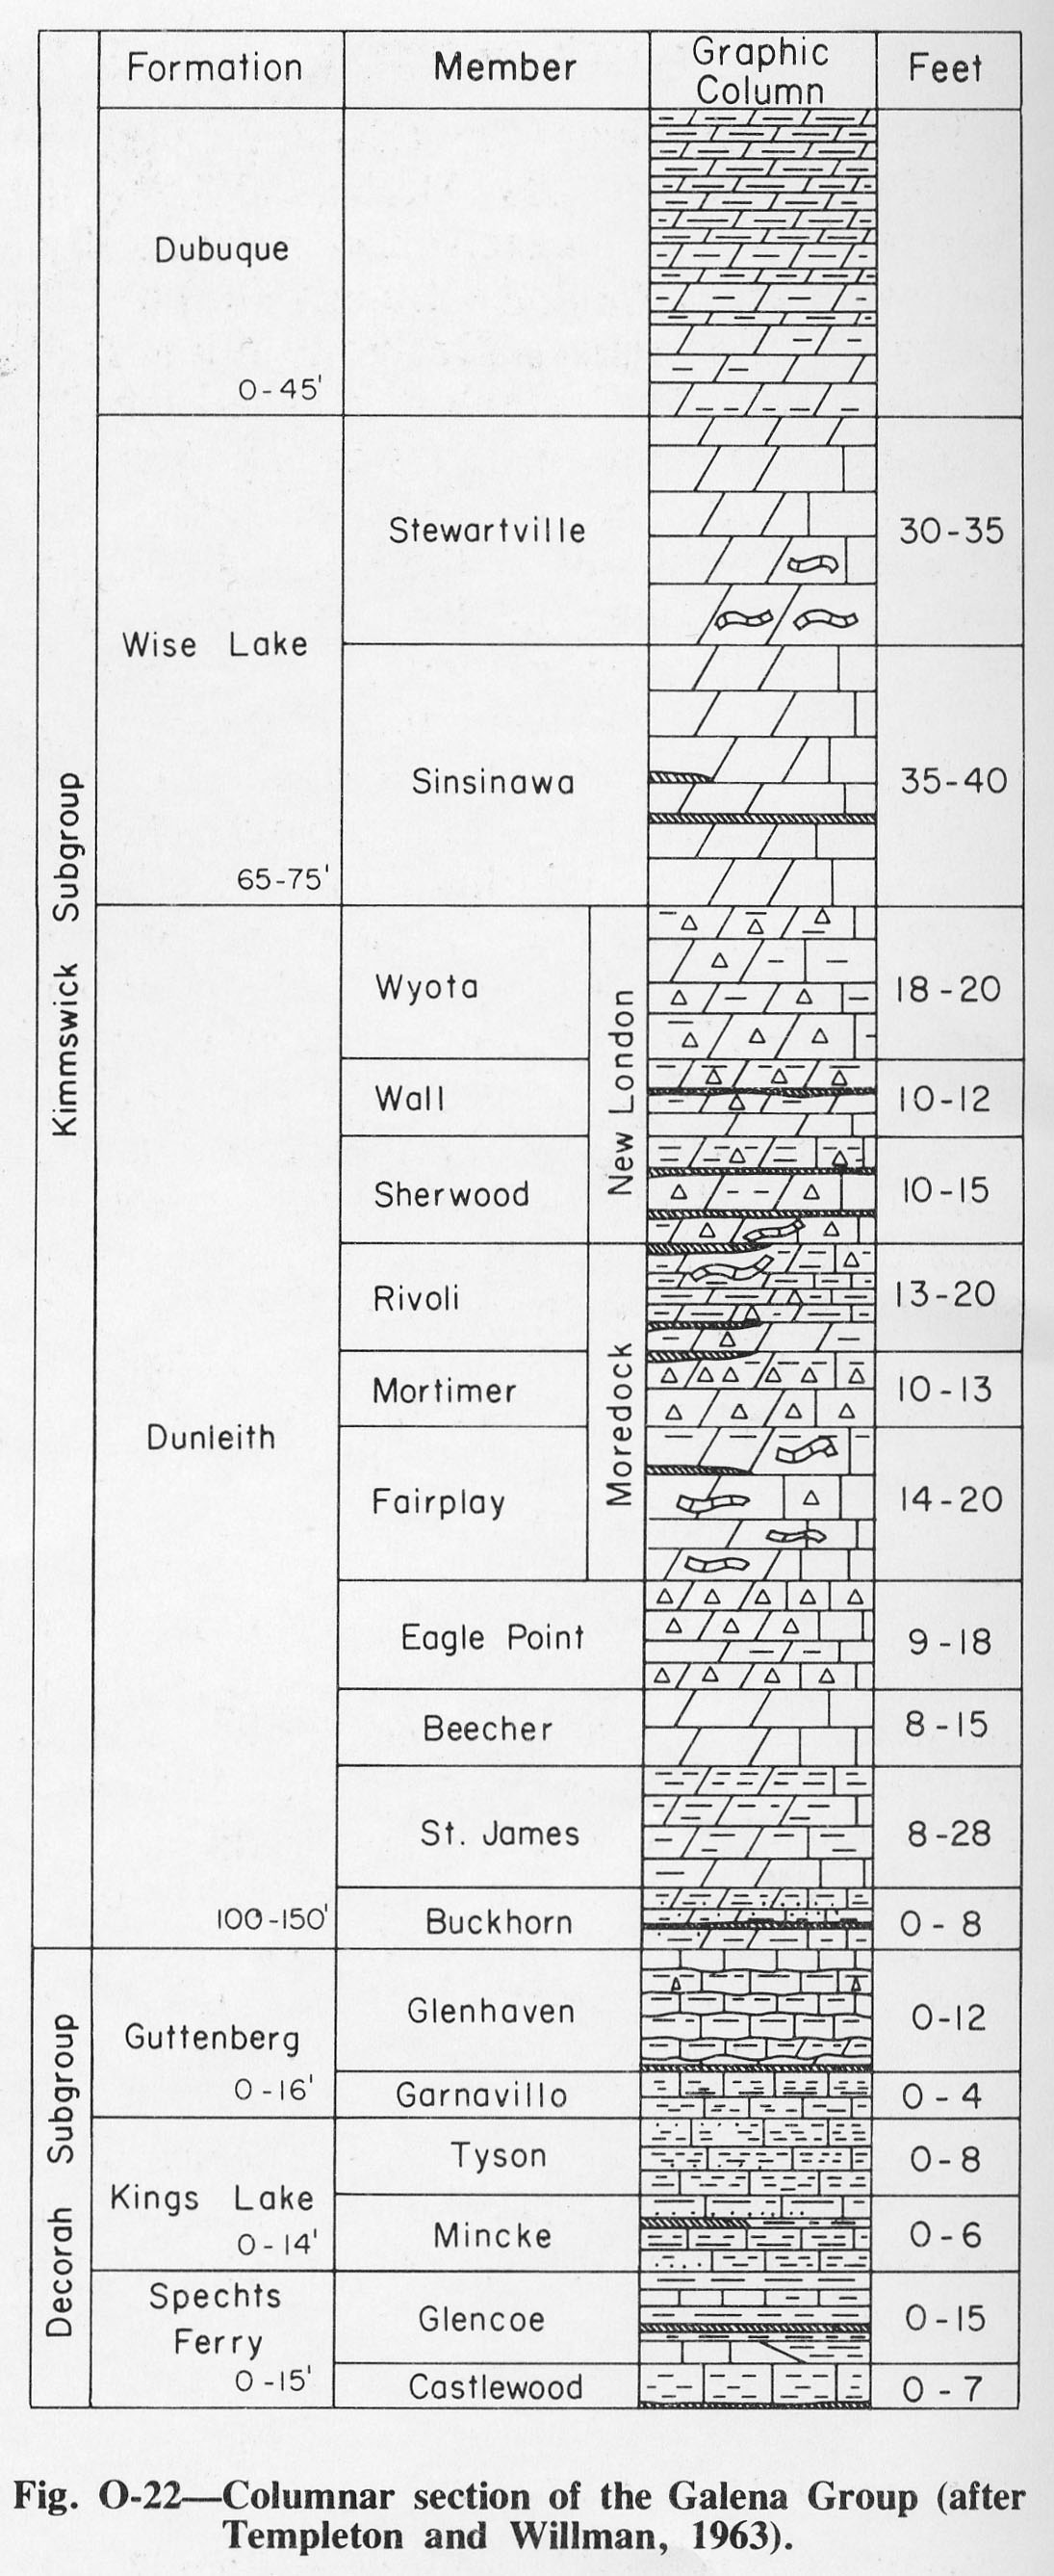
| 15:02, 4 April 2016 | Figure O-22.jpg (file) |  |
384 KB | Alan.Myers | Fig. O-22 -- Columnar section of the Galena Group (after Templeton and Willman, 1963). | 1 |
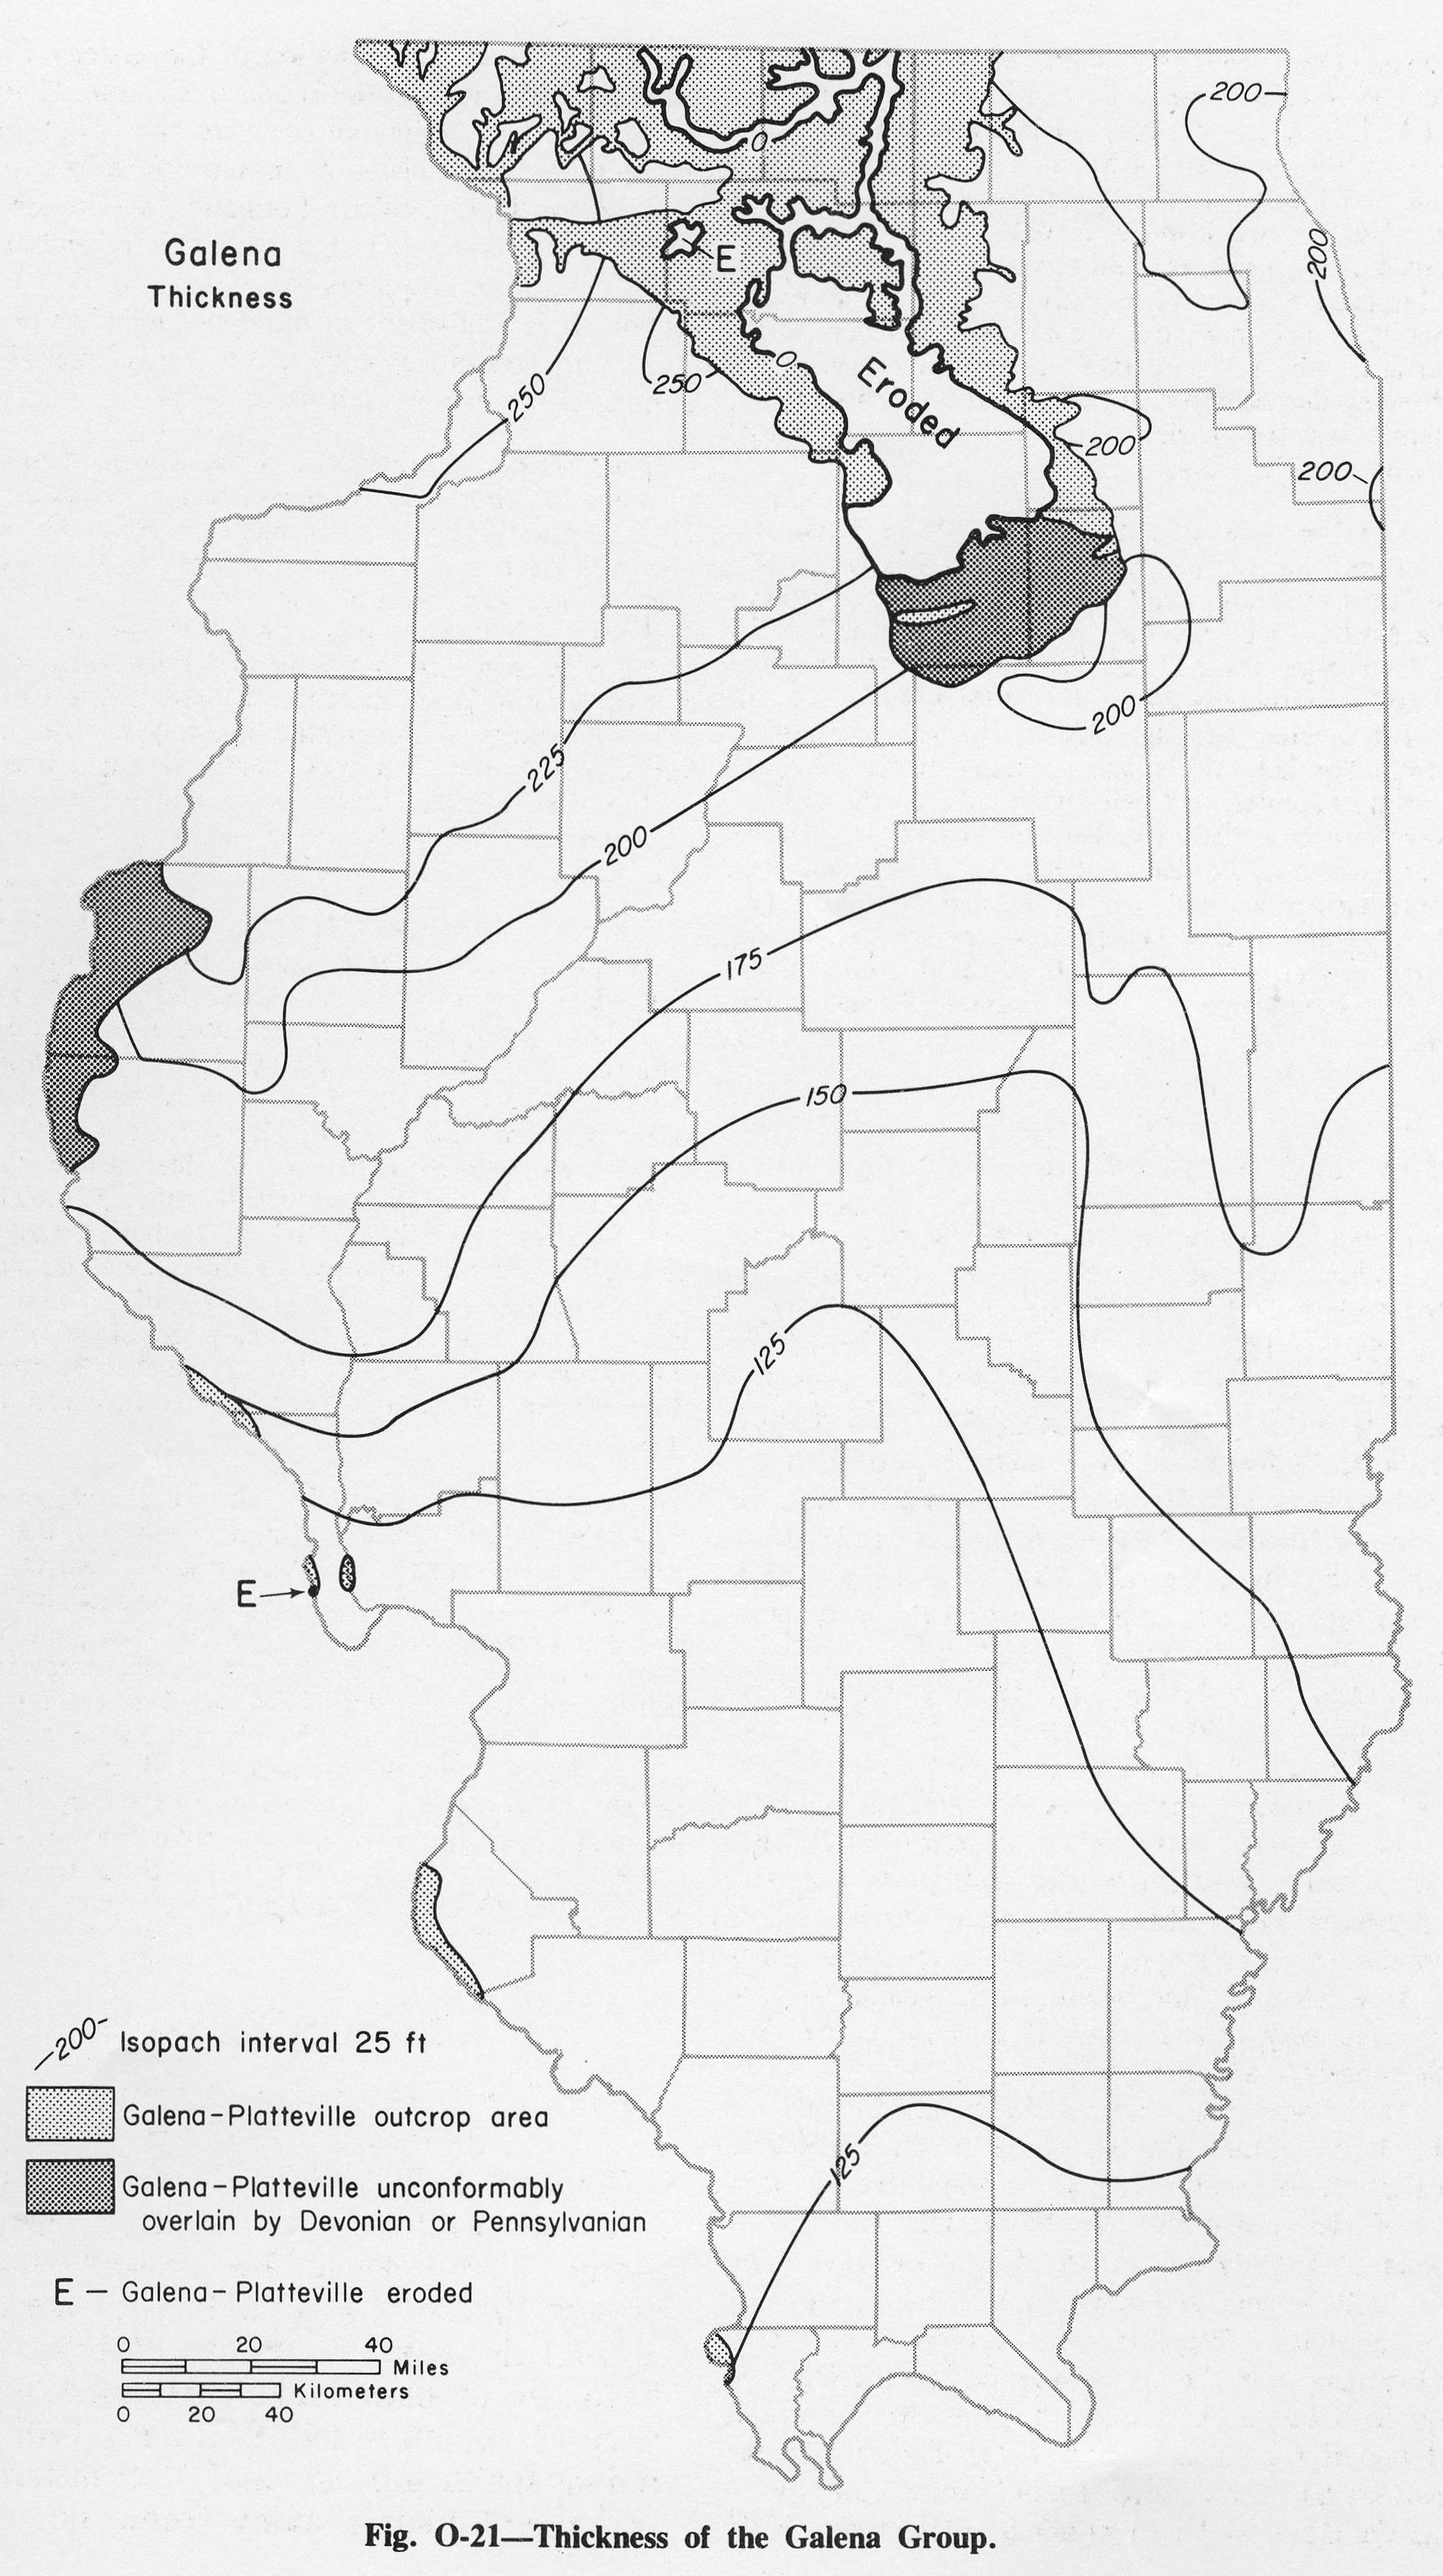
| 15:01, 4 April 2016 | Figure O-21.jpg (file) |  |
782 KB | Alan.Myers | Fig. O-21 -- Thickness of the Galena Group. | 1 |
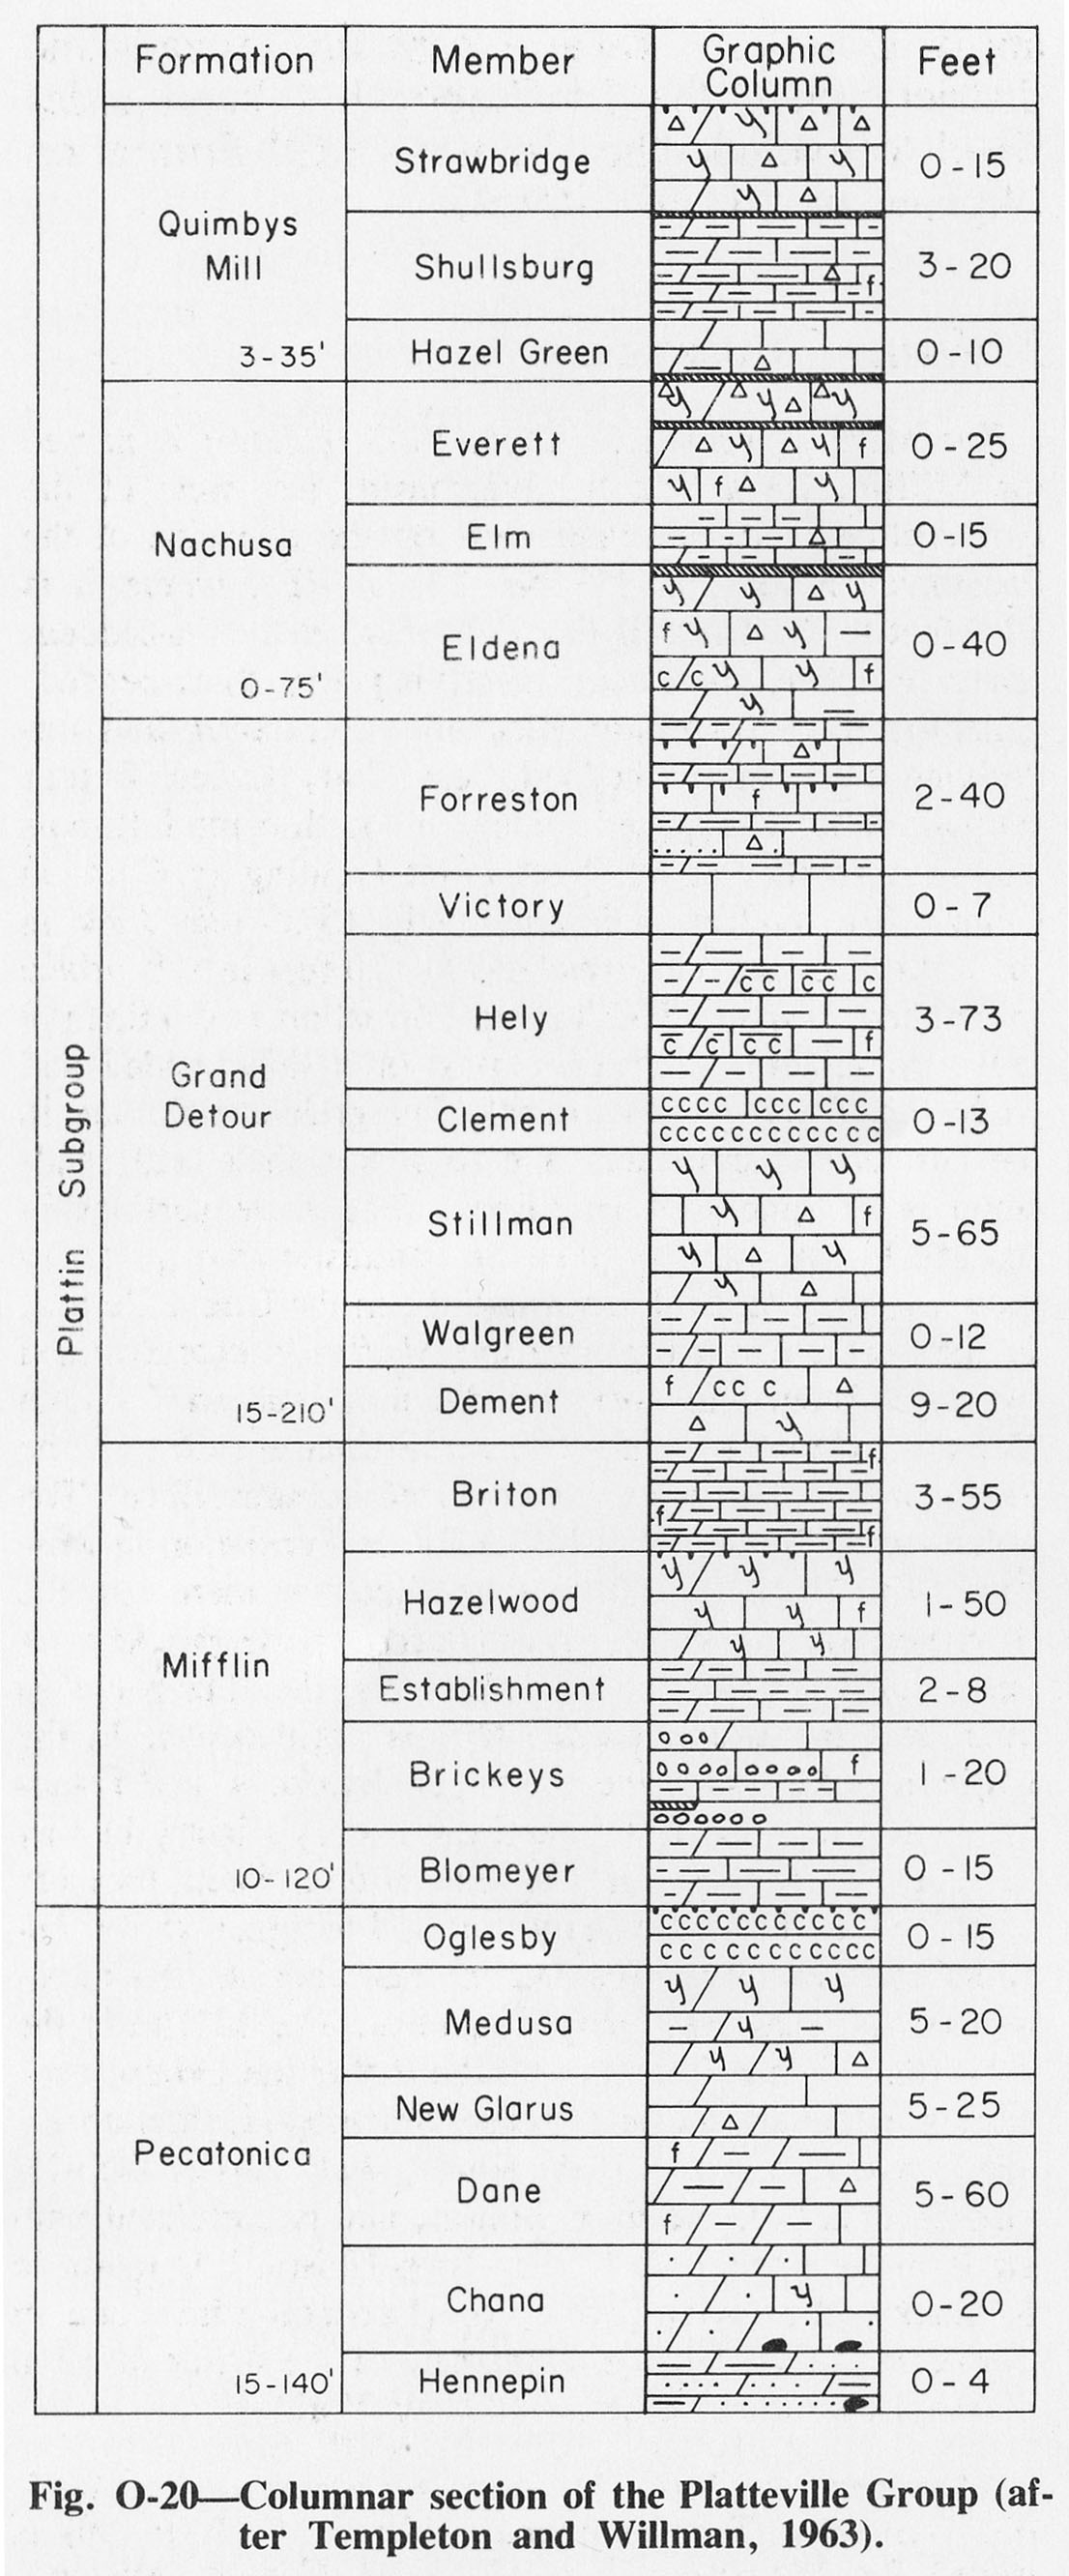
| 15:00, 4 April 2016 | Figure O-20.jpg (file) |  |
385 KB | Alan.Myers | Fig. O-21 -- Columnar Section of the Platteville GRoup (after Templeton and Willman, 1963). | 1 |
| 14:59, 4 April 2016 | Figure O-19.jpg (file) |  |
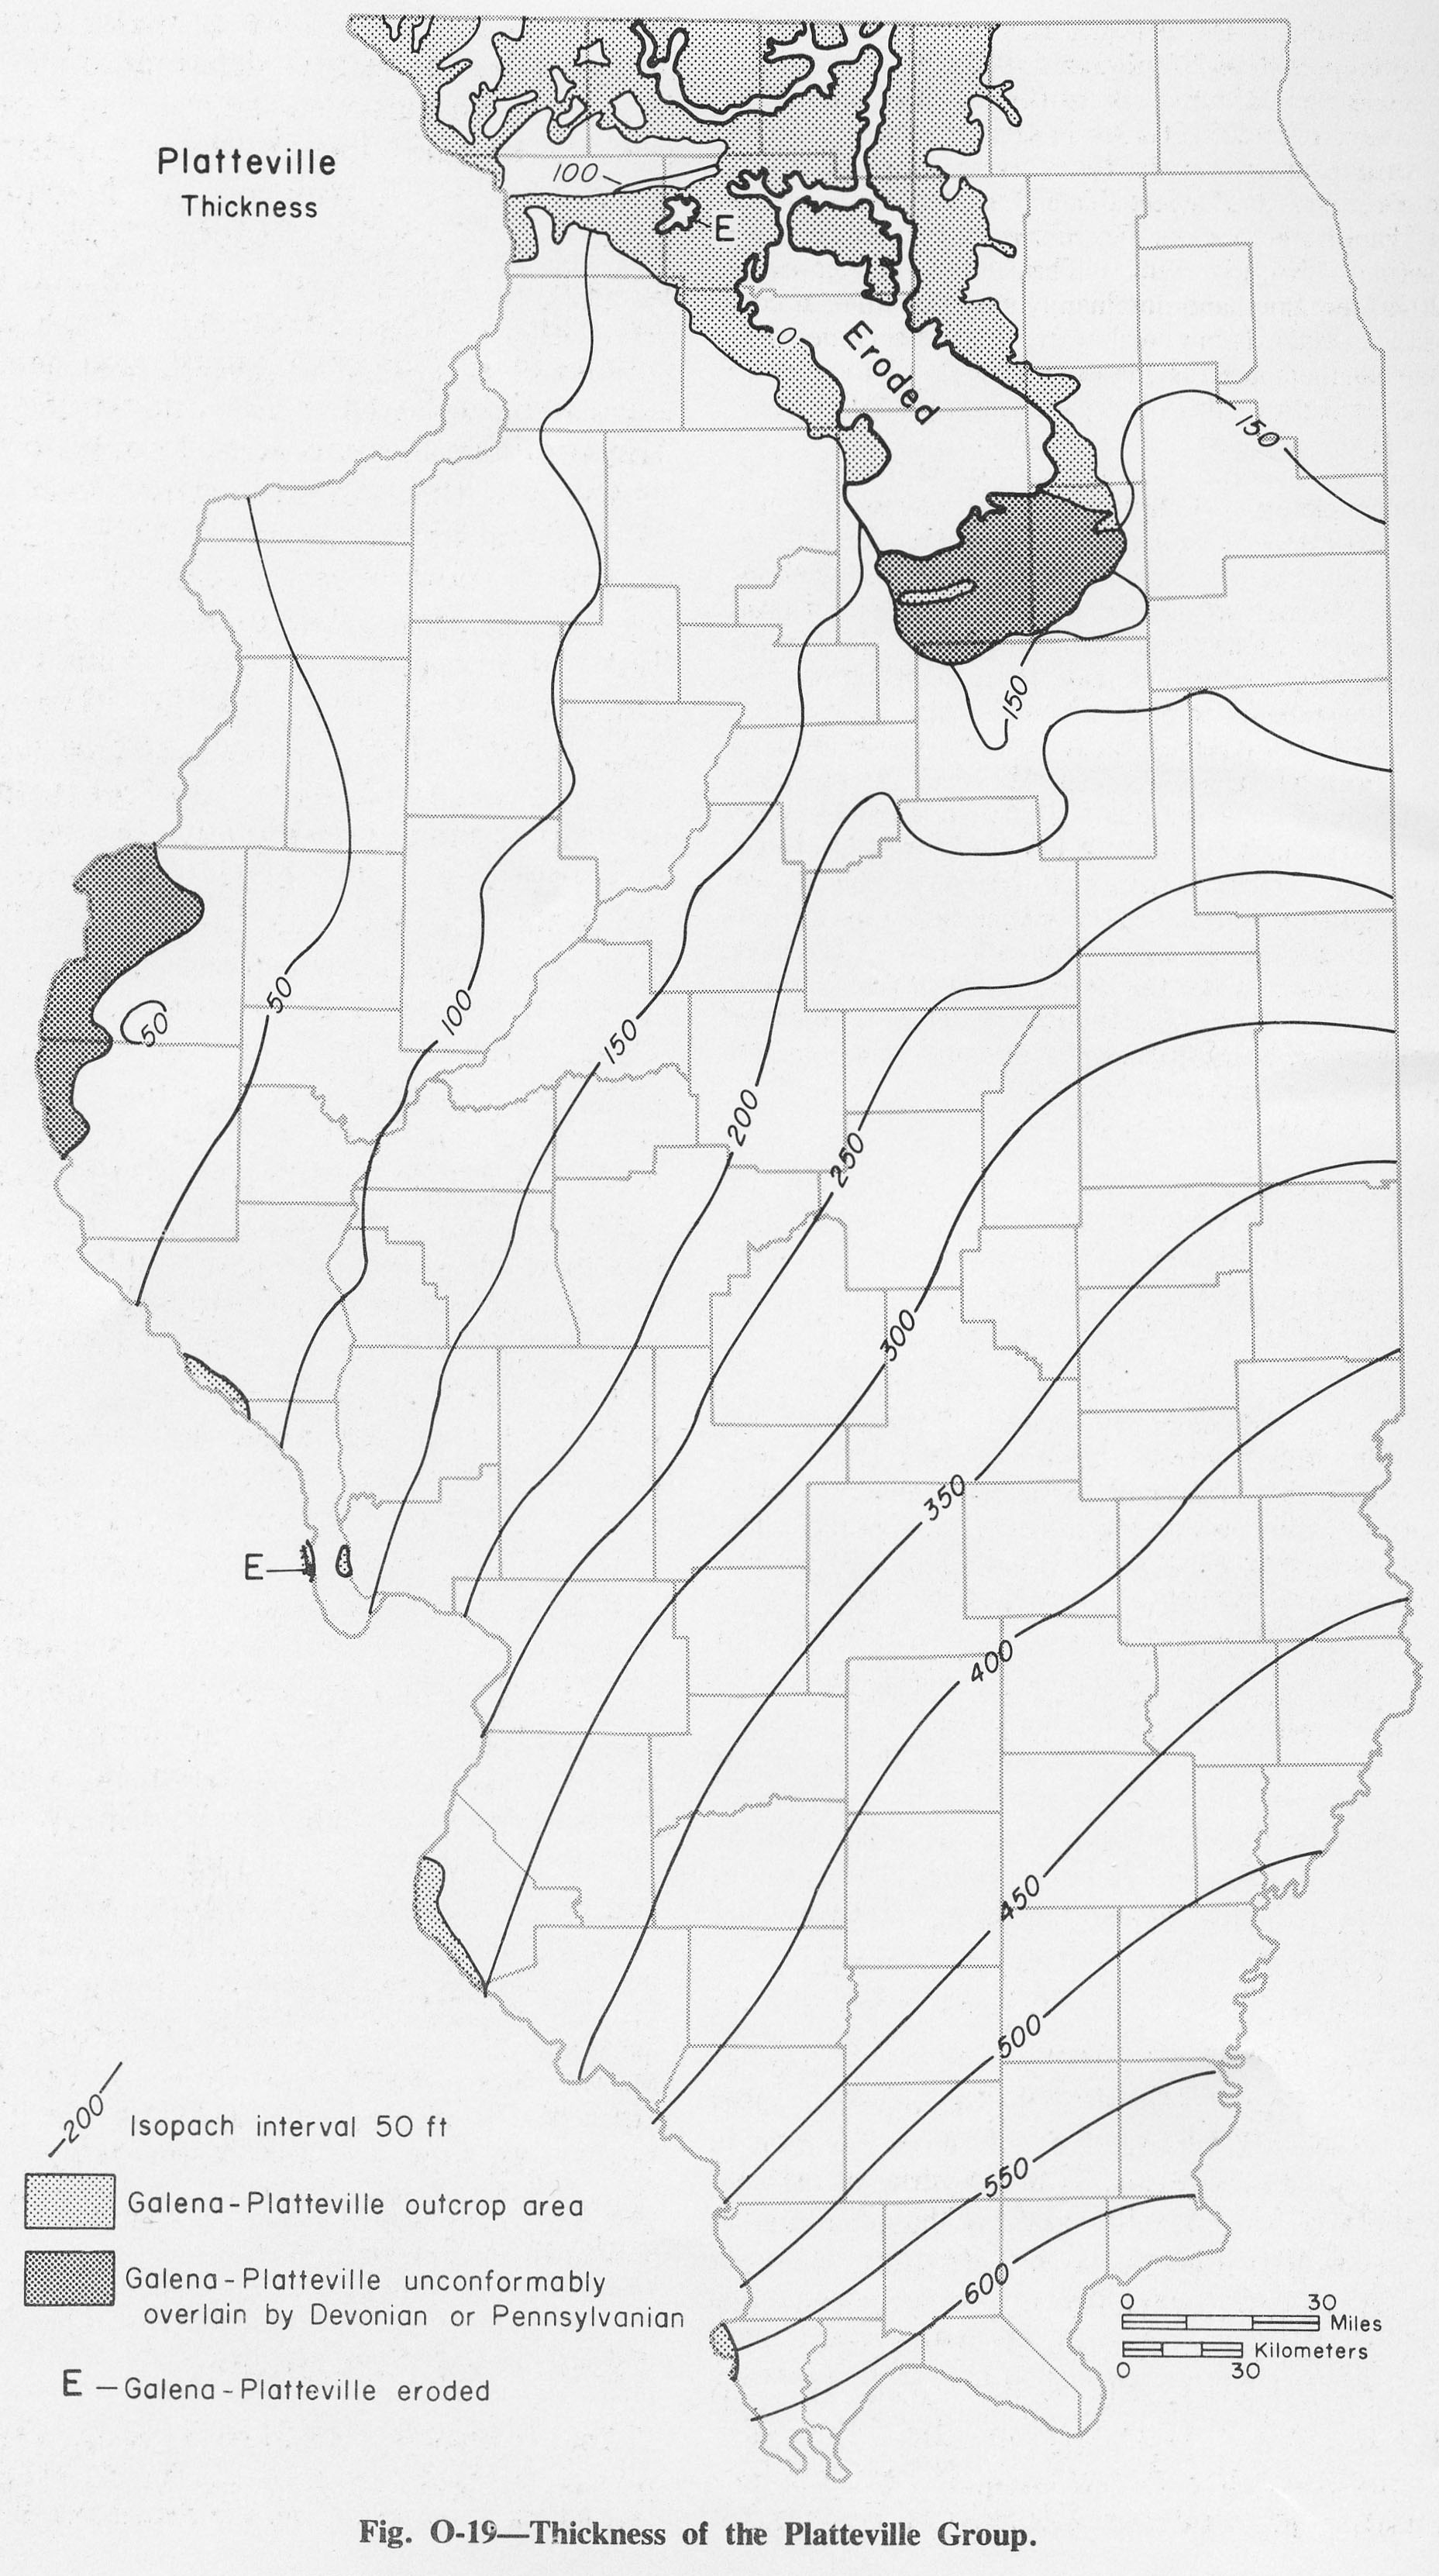
743 KB | Alan.Myers | Fig. O-19 -- Thickness of the Platteville Group. | 1 |
| 14:58, 4 April 2016 | Figure O-18.jpg (file) |  |
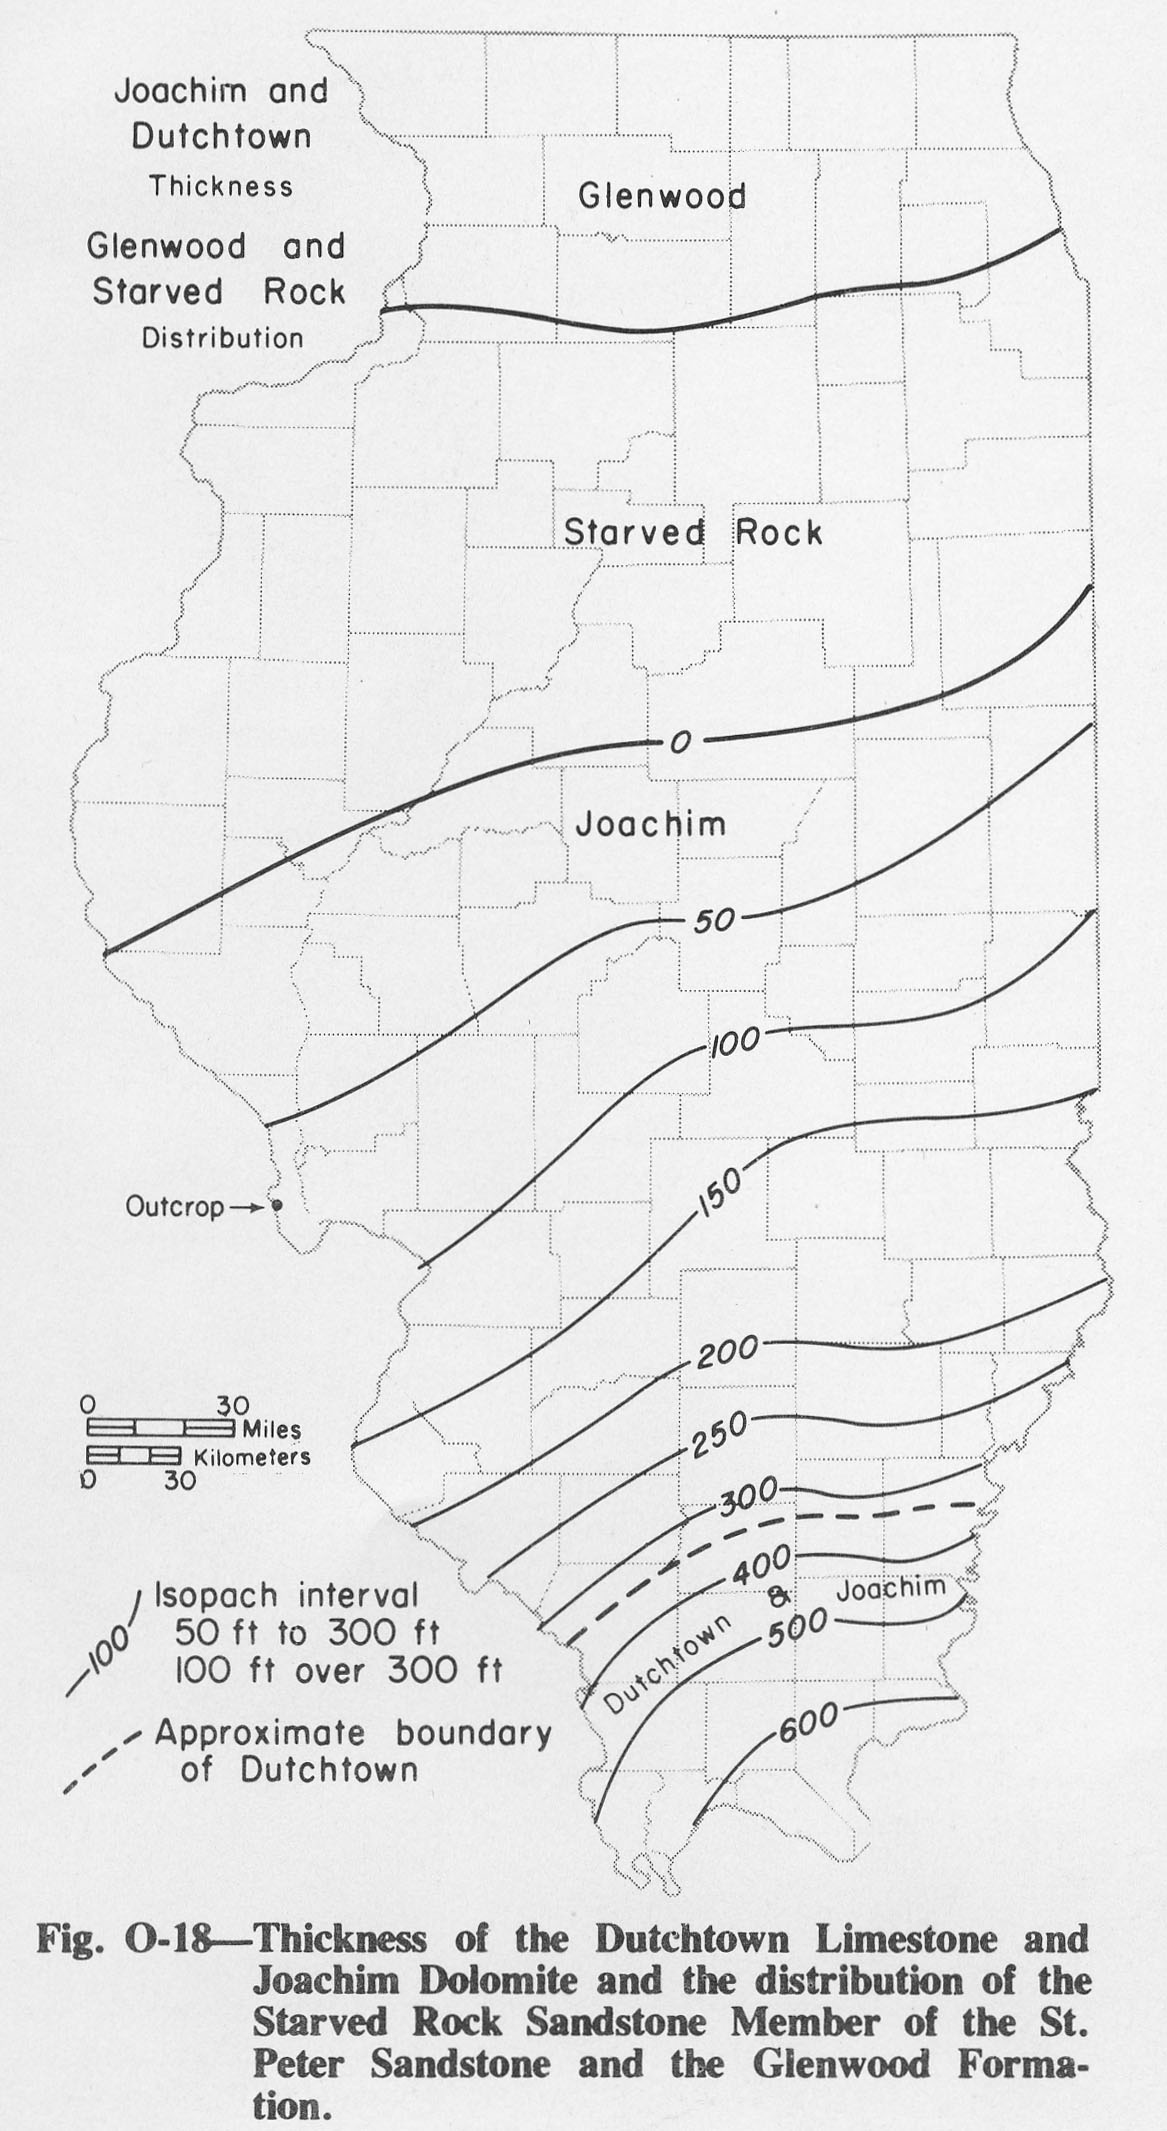
306 KB | Alan.Myers | Fig. O-18 -- Thickness of the Dutchtown Limestone and Joachim Dolomite and the distribution of the Starved Rock Sandstone Member of the St. Peter Sandstone and the Glenwood Formation. | 1 |
| 14:56, 4 April 2016 | Figure O-17.jpg (file) |  |
282 KB | Alan.Myers | Fig. O-17 -- Thickness of the St. Peter Sandstone. | 1 |
| 14:56, 4 April 2016 | Figure O-16.jpg (file) |  |
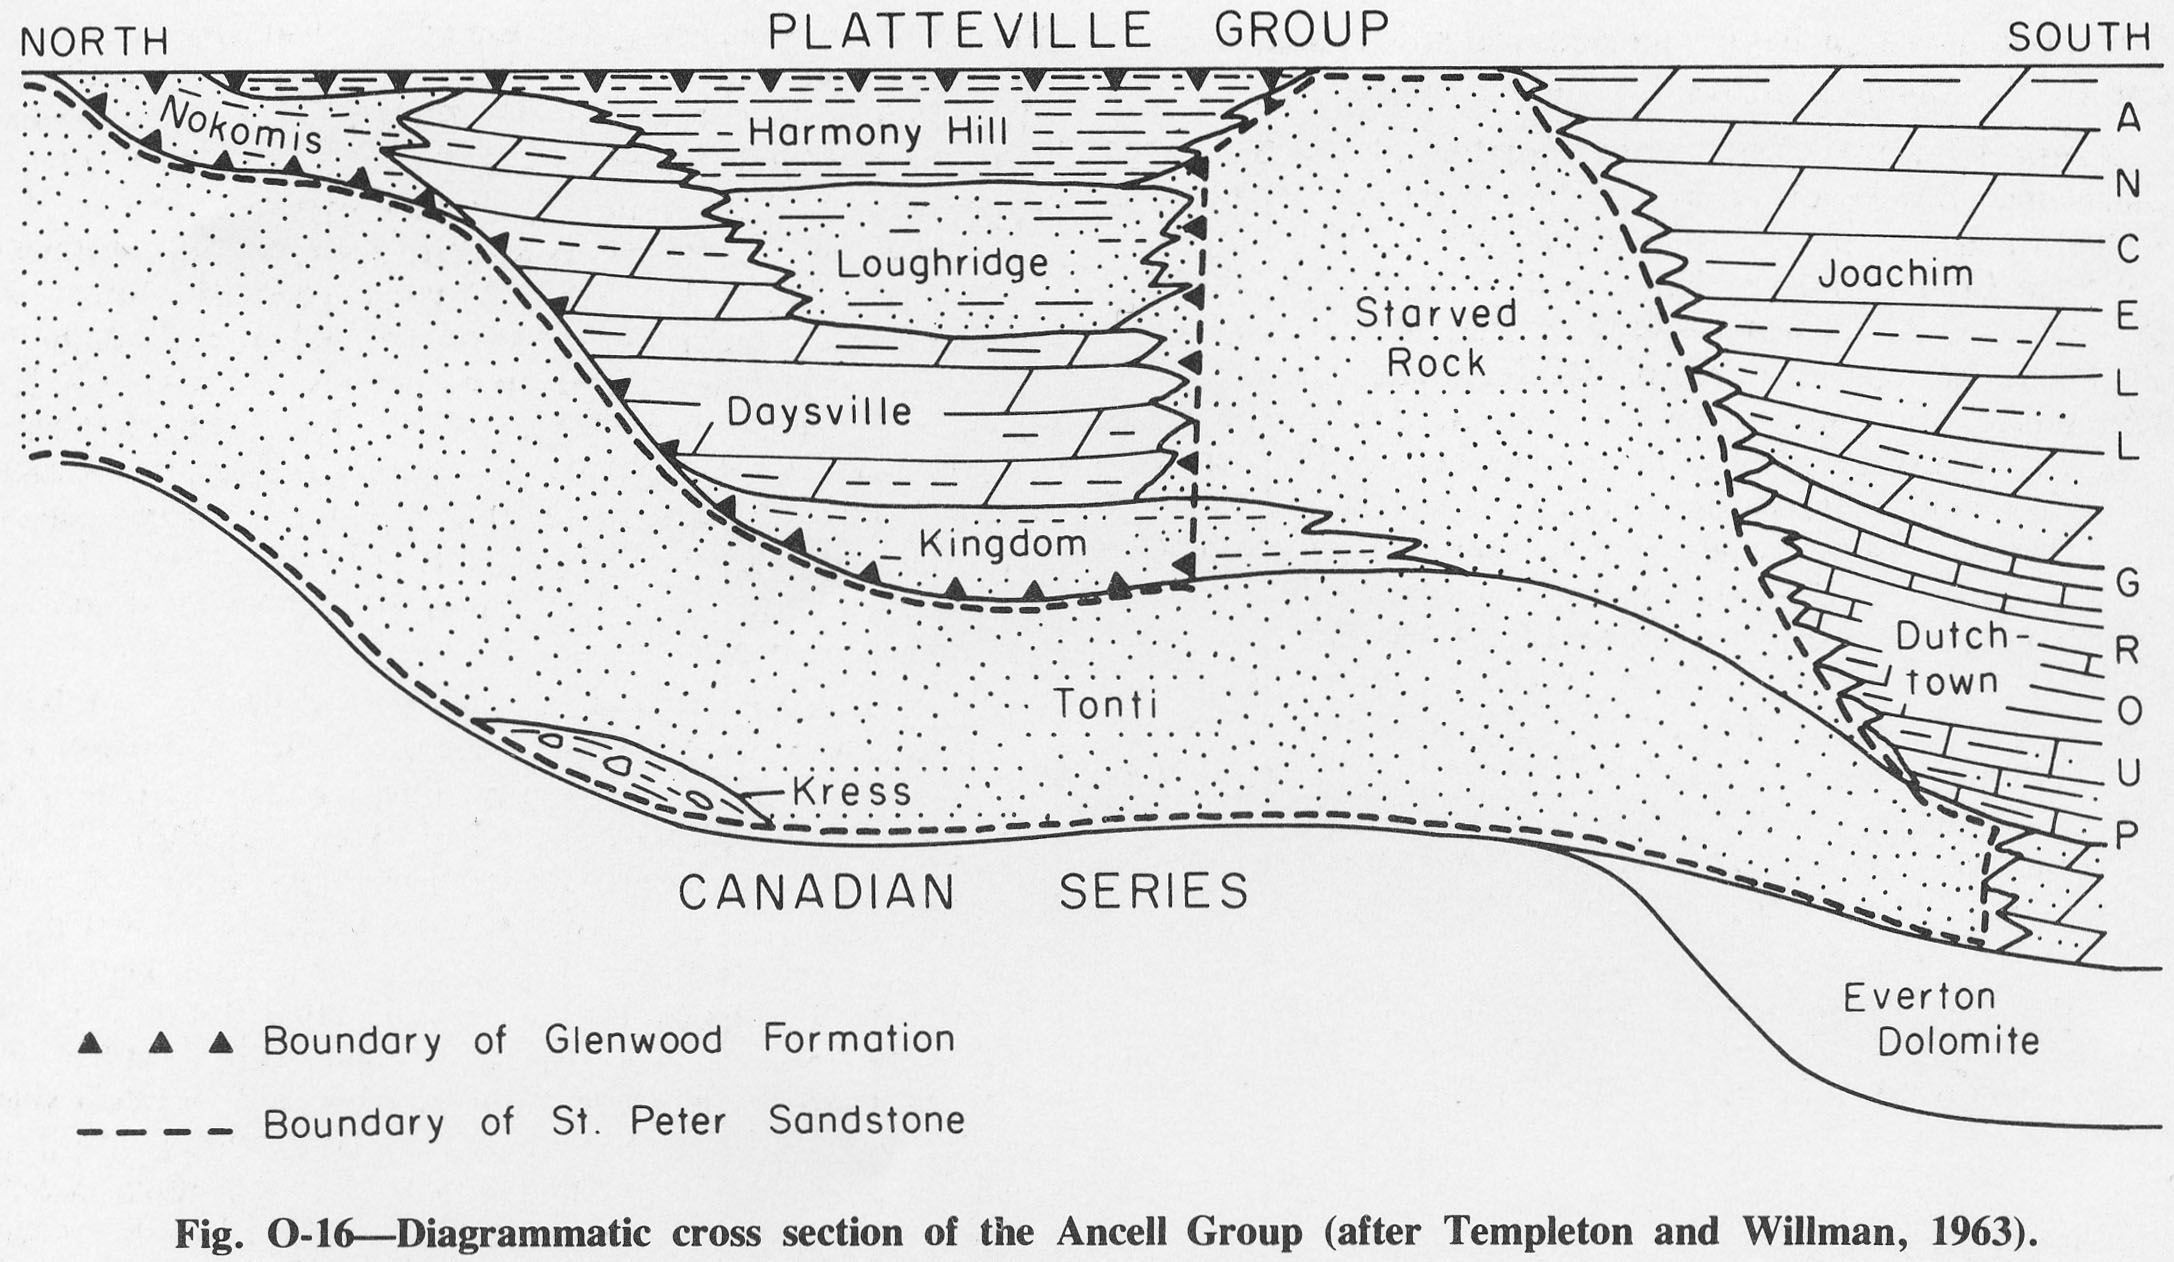
388 KB | Alan.Myers | Fig. O-16 -- Diagrammatic cross section of the Ancell Group (after Templeton and Willman, 1963). | 1 |