File list
Jump to navigation
Jump to search
This special page shows all uploaded files.
| Date | Name | Thumbnail | Size | User | Description | Versions |
|---|---|---|---|---|---|---|
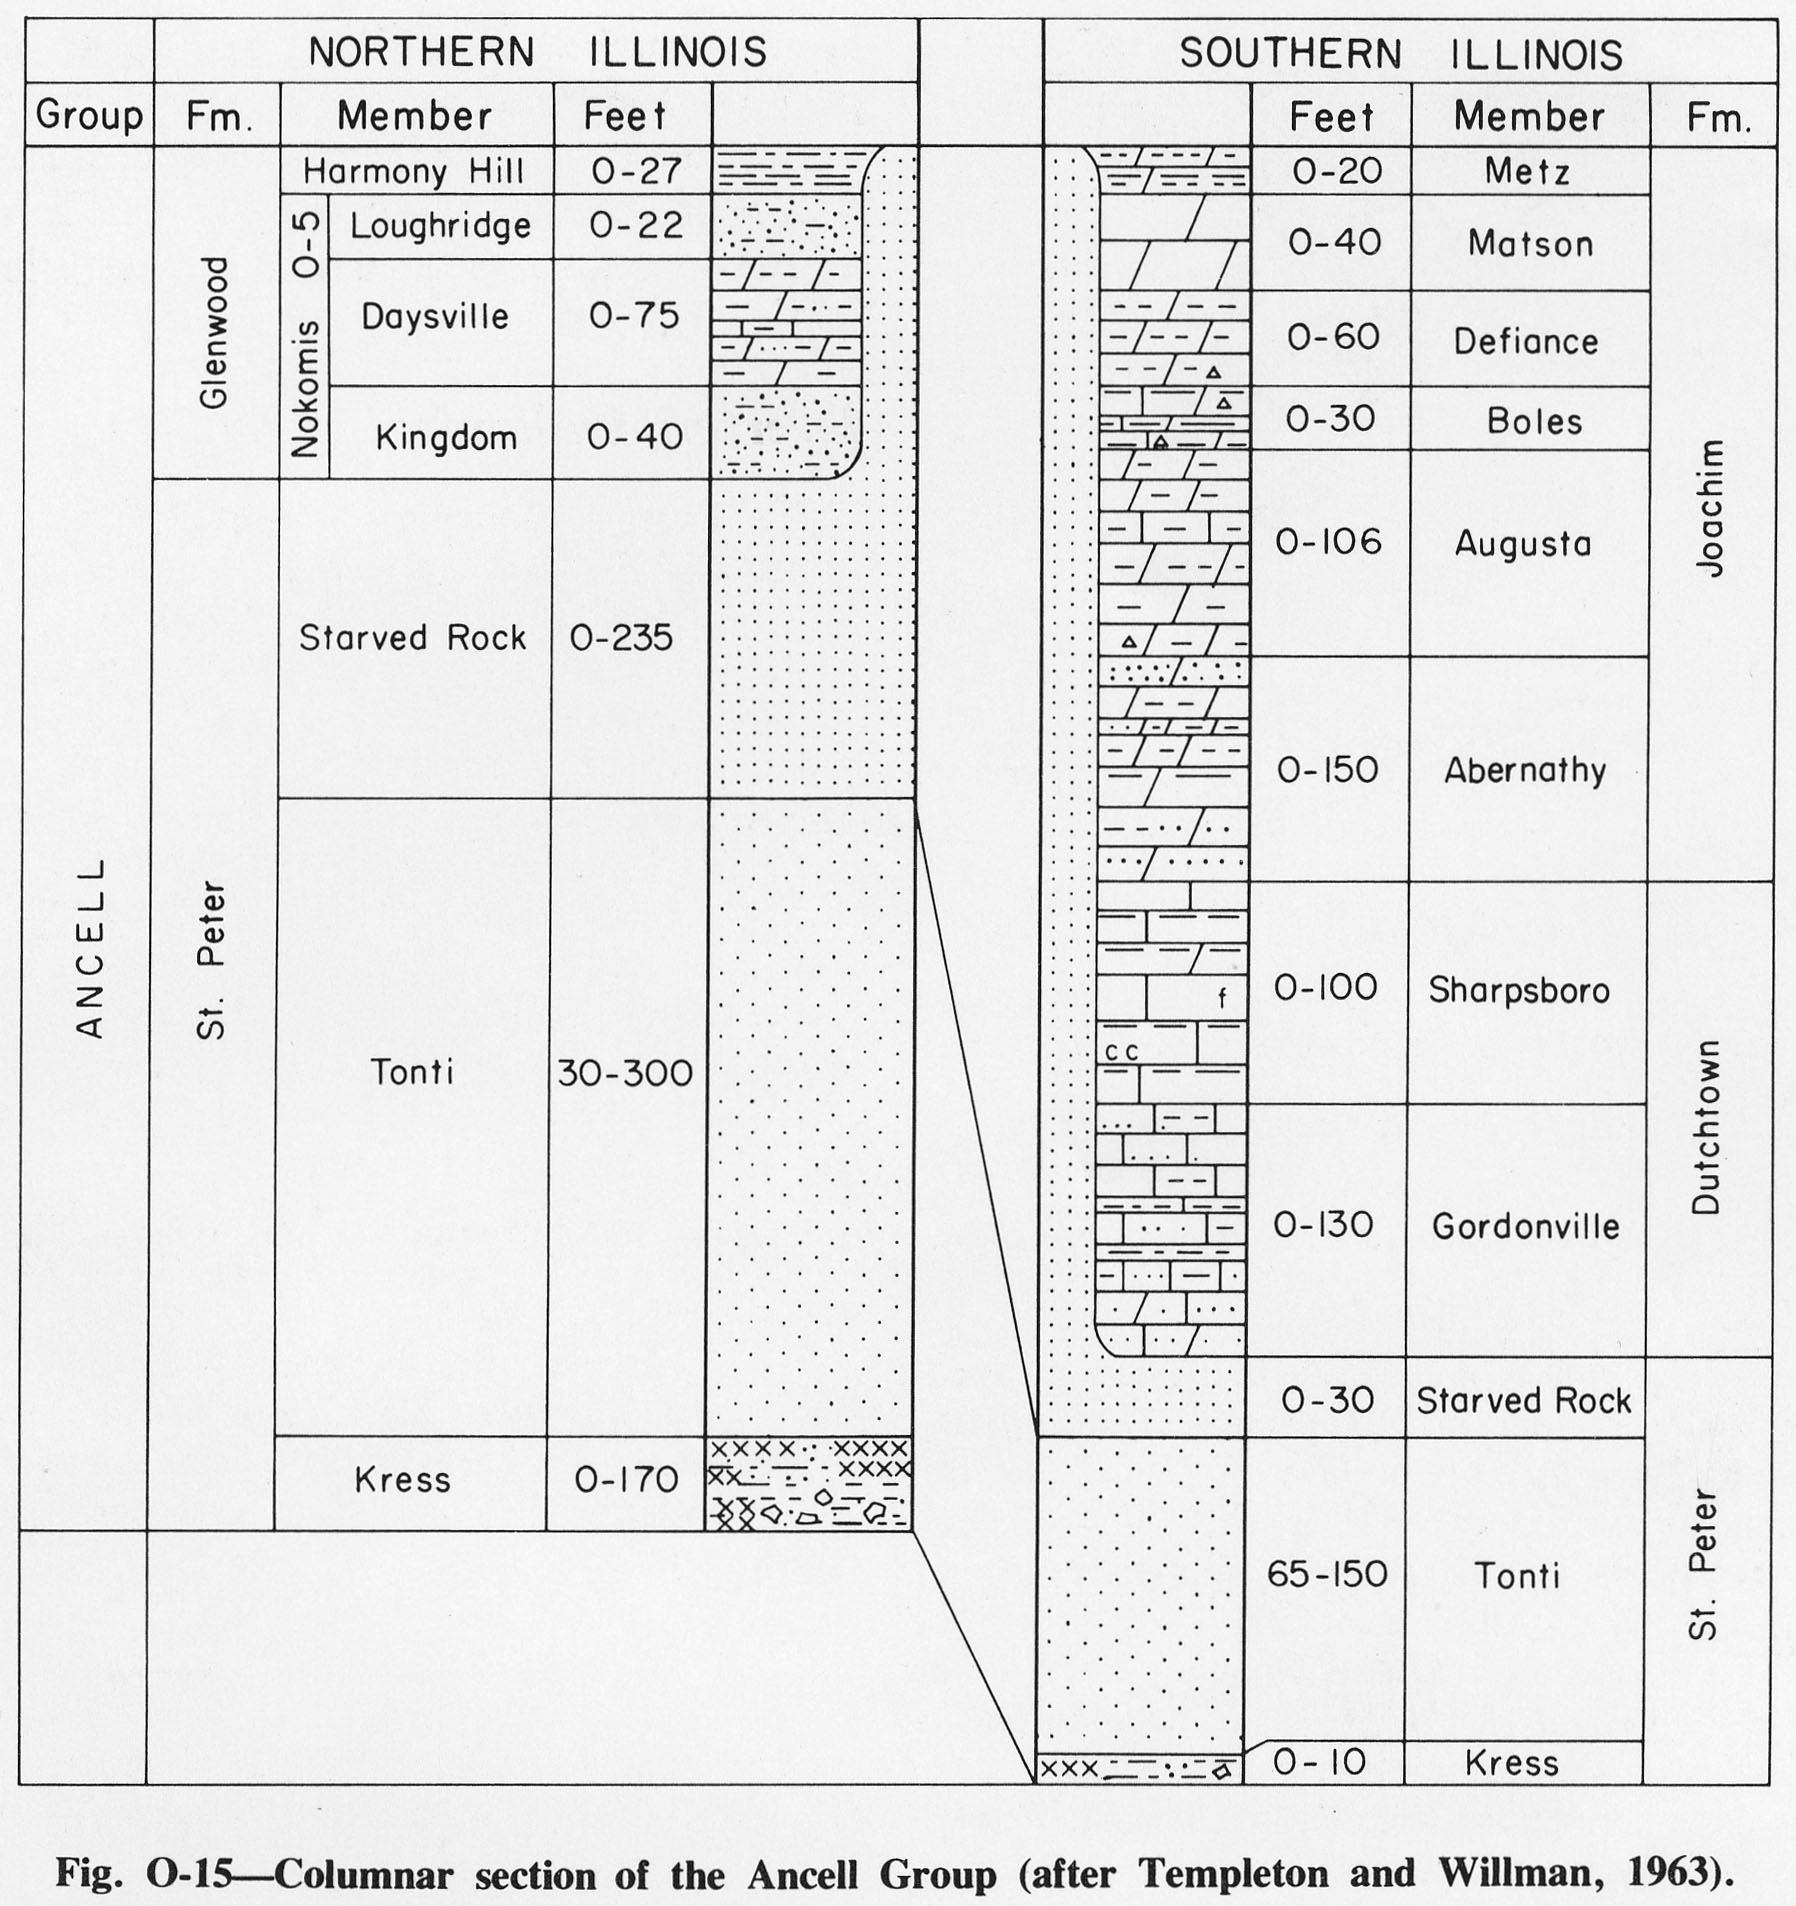
| 14:55, 4 April 2016 | Figure O-15.jpg (file) |  |
388 KB | Alan.Myers | Fig. O-15 -- Columnar section of the Ancell Group (after Templeton and Willman, 1963). | 1 |
| 14:54, 4 April 2016 | Figure O-14.jpg (file) |  |
330 KB | Alan.Myers | Fig. O-14 -- Thickness of the Ottawa Limestone Megagroup. | 1 |
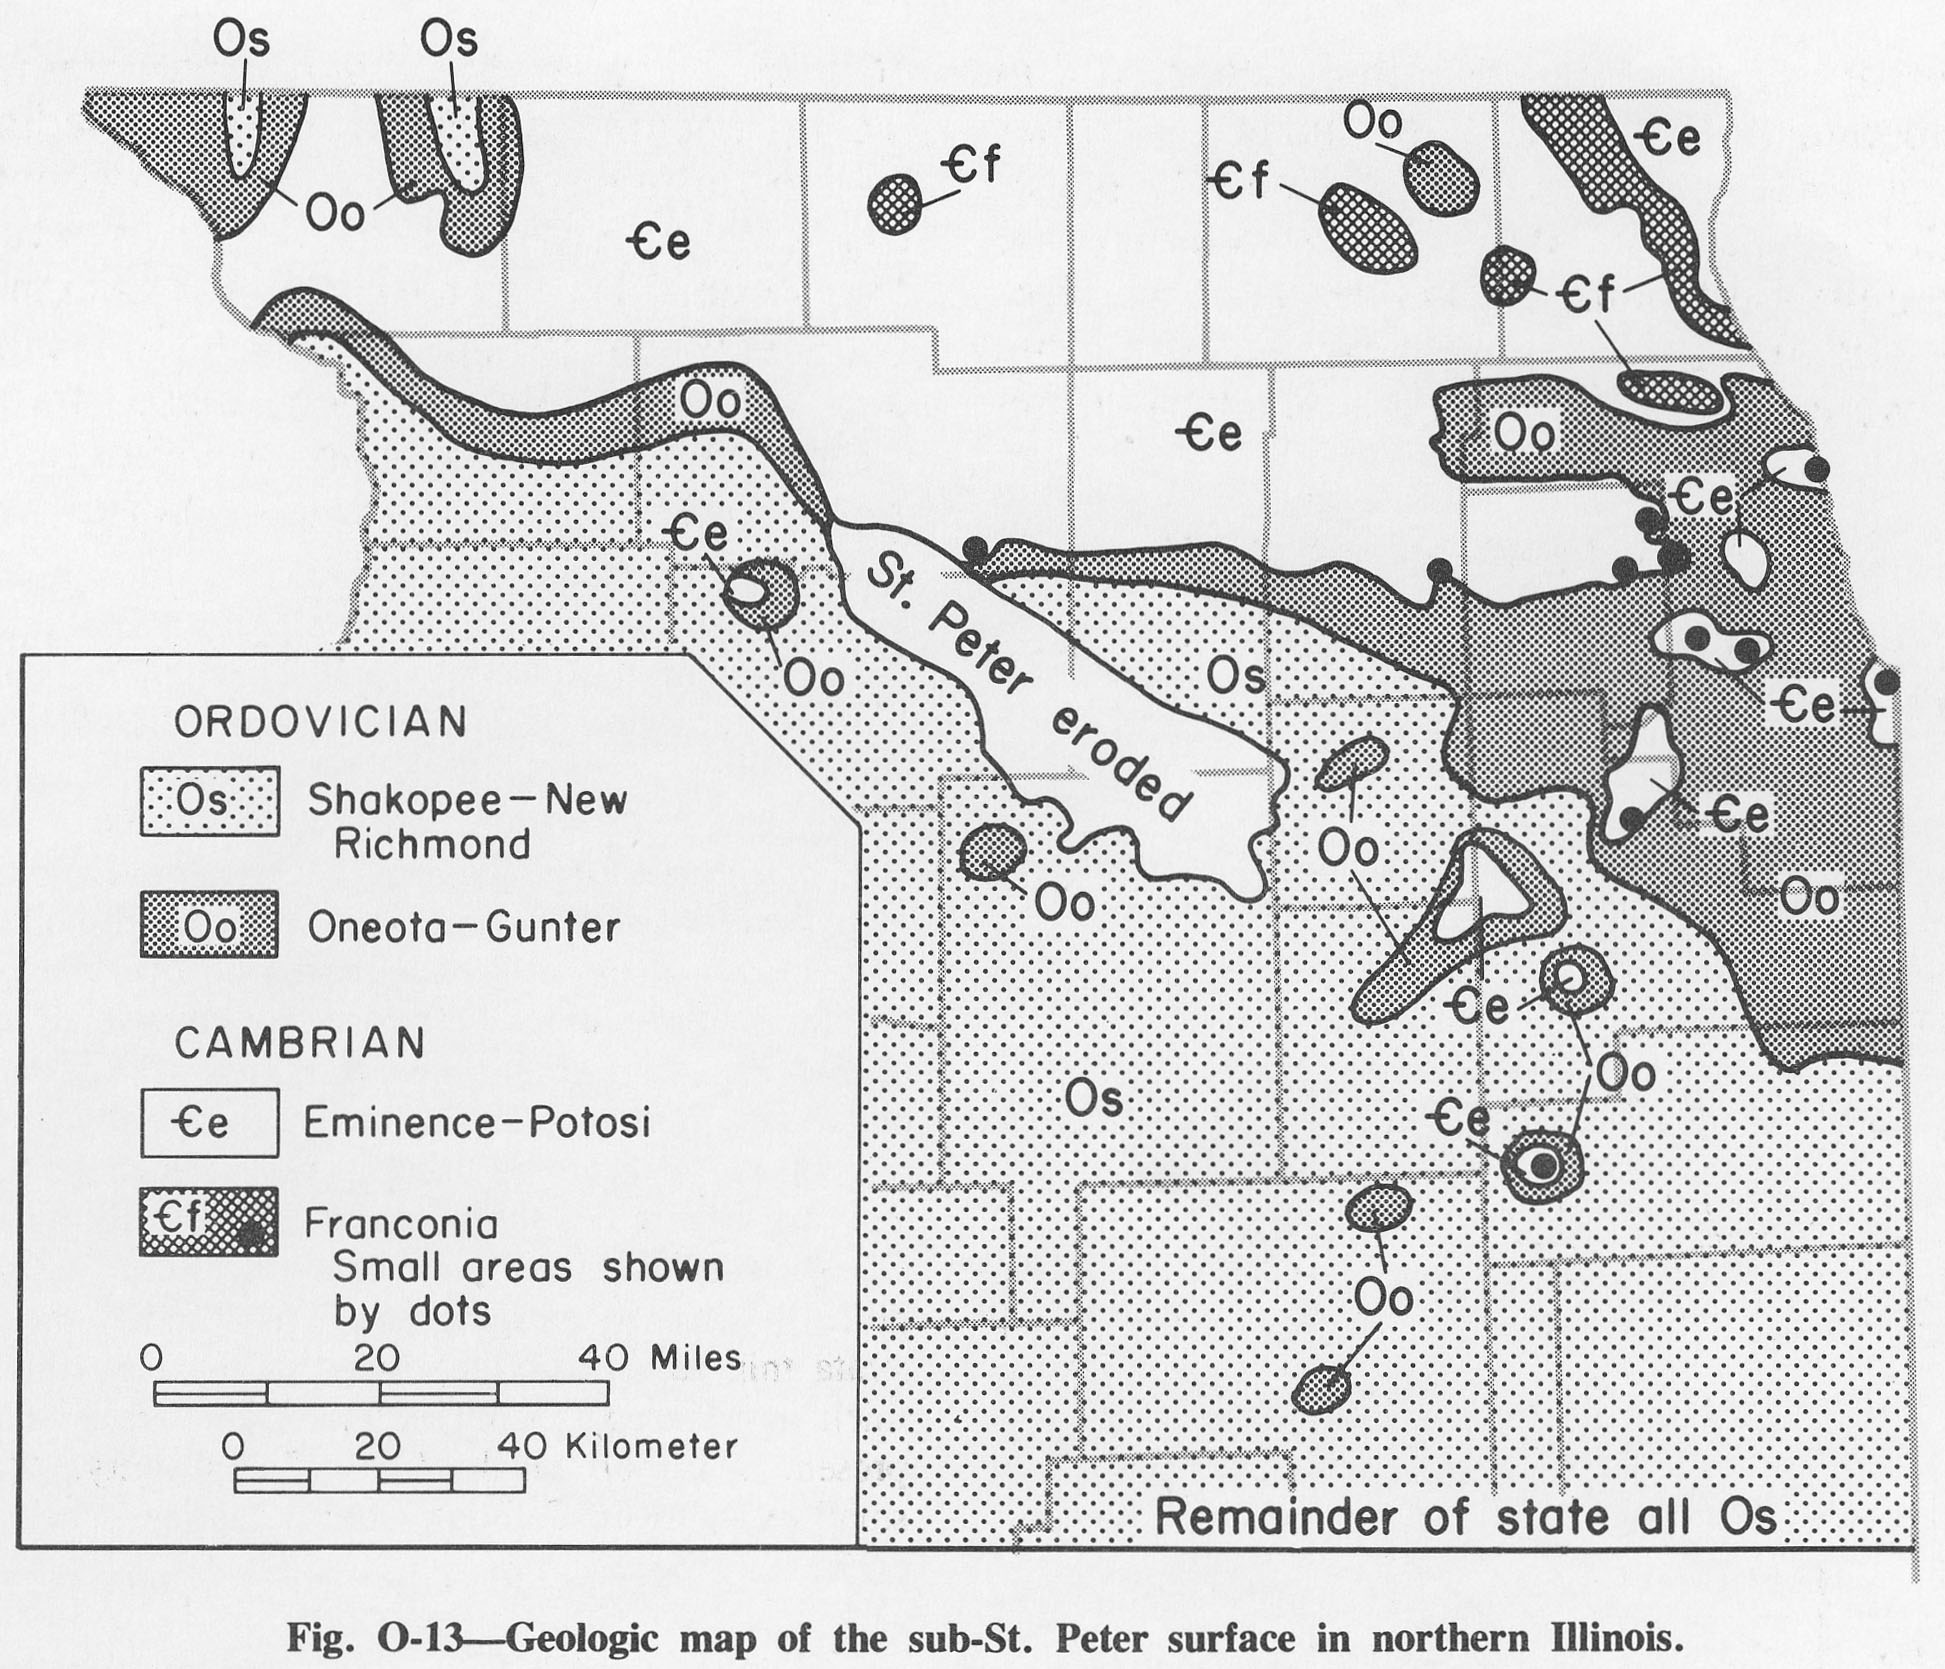
| 14:53, 4 April 2016 | Figure O-13.jpg (file) |  |
639 KB | Alan.Myers | Fig. O-13 -- Geologic map of the sub-St. Peter surface in northern Illinois. | 1 |
| 14:52, 4 April 2016 | Figure O-12.jpg (file) |  |
583 KB | Alan.Myers | Fig. O-12 -- Development of the classification of the Champlainian Series. | 1 |
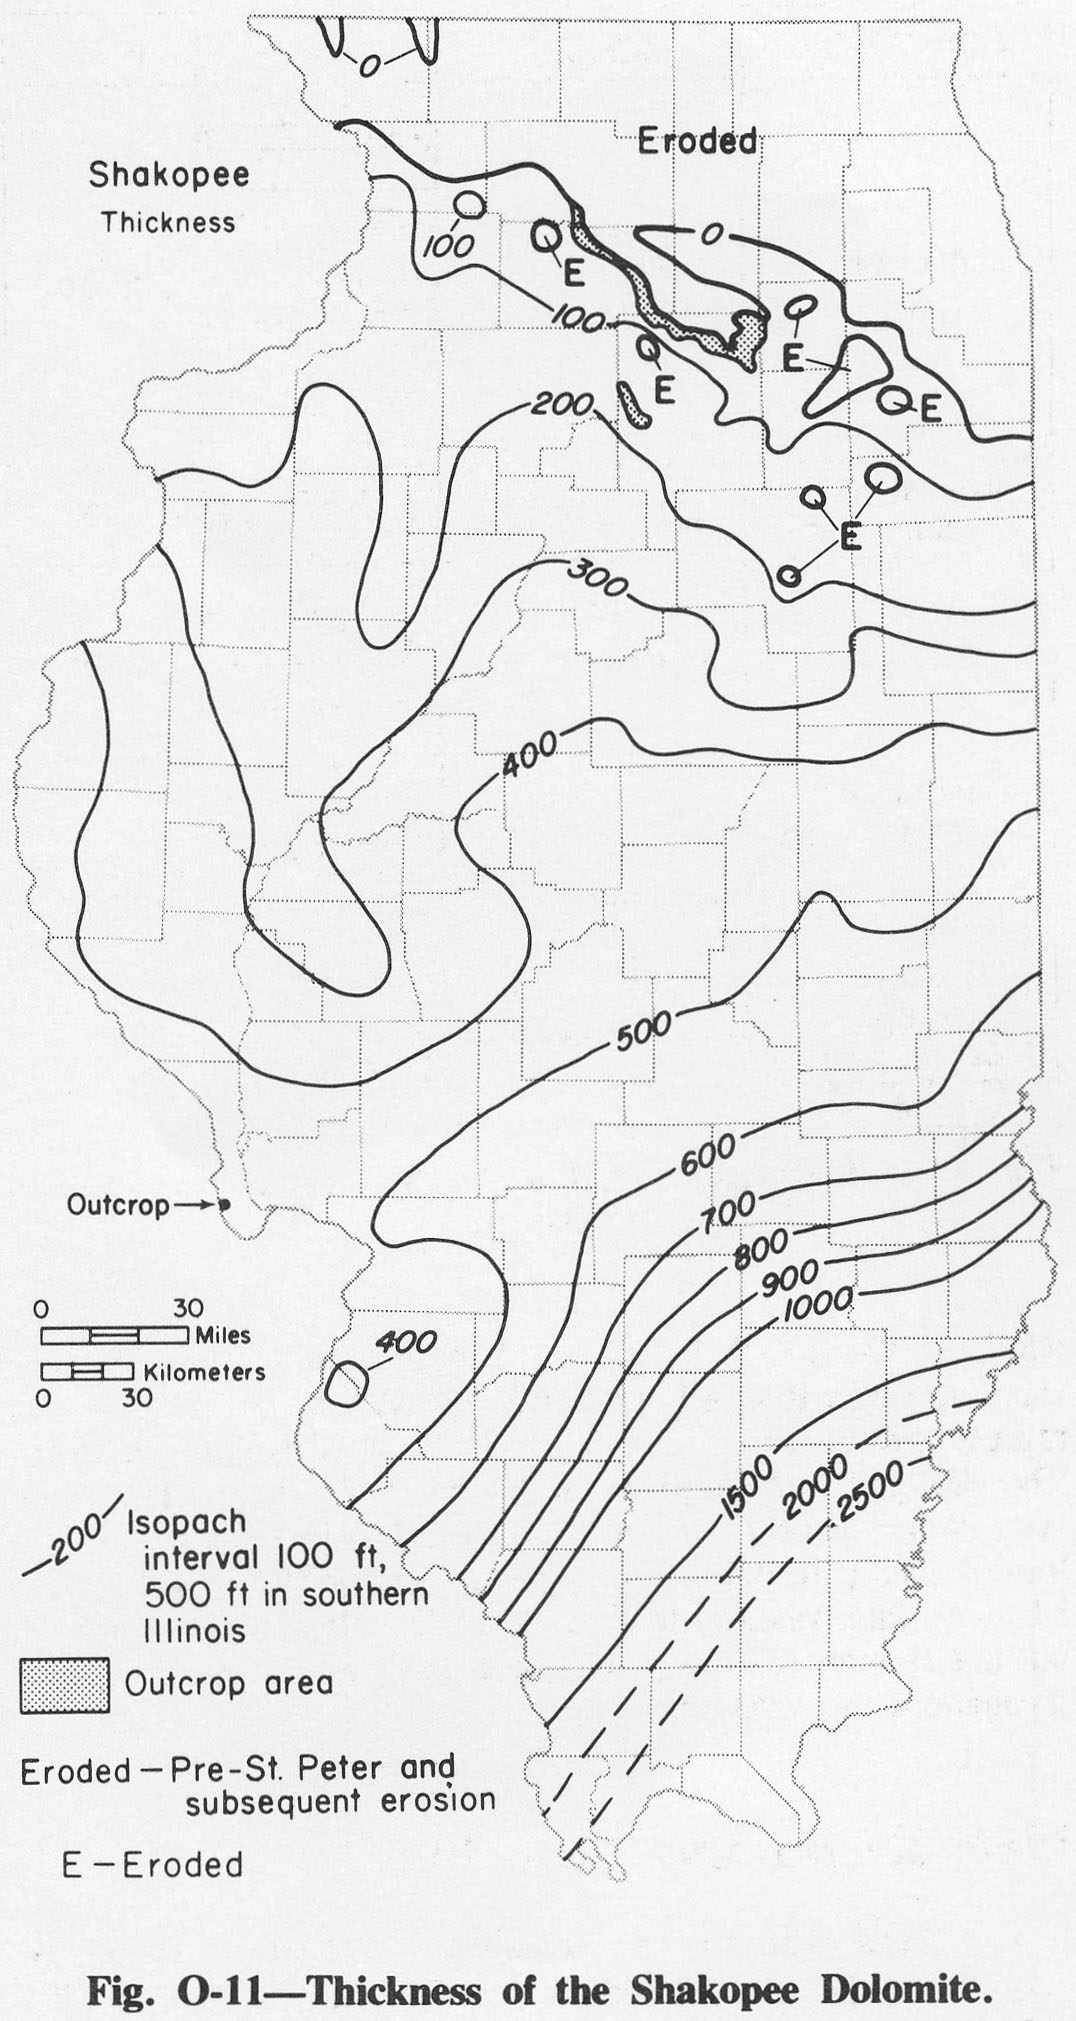
| 14:51, 4 April 2016 | Figure O-11.jpg (file) |  |
306 KB | Alan.Myers | Fig. O-11 -- Thickness of the Shakoppe Dolomite. | 1 |
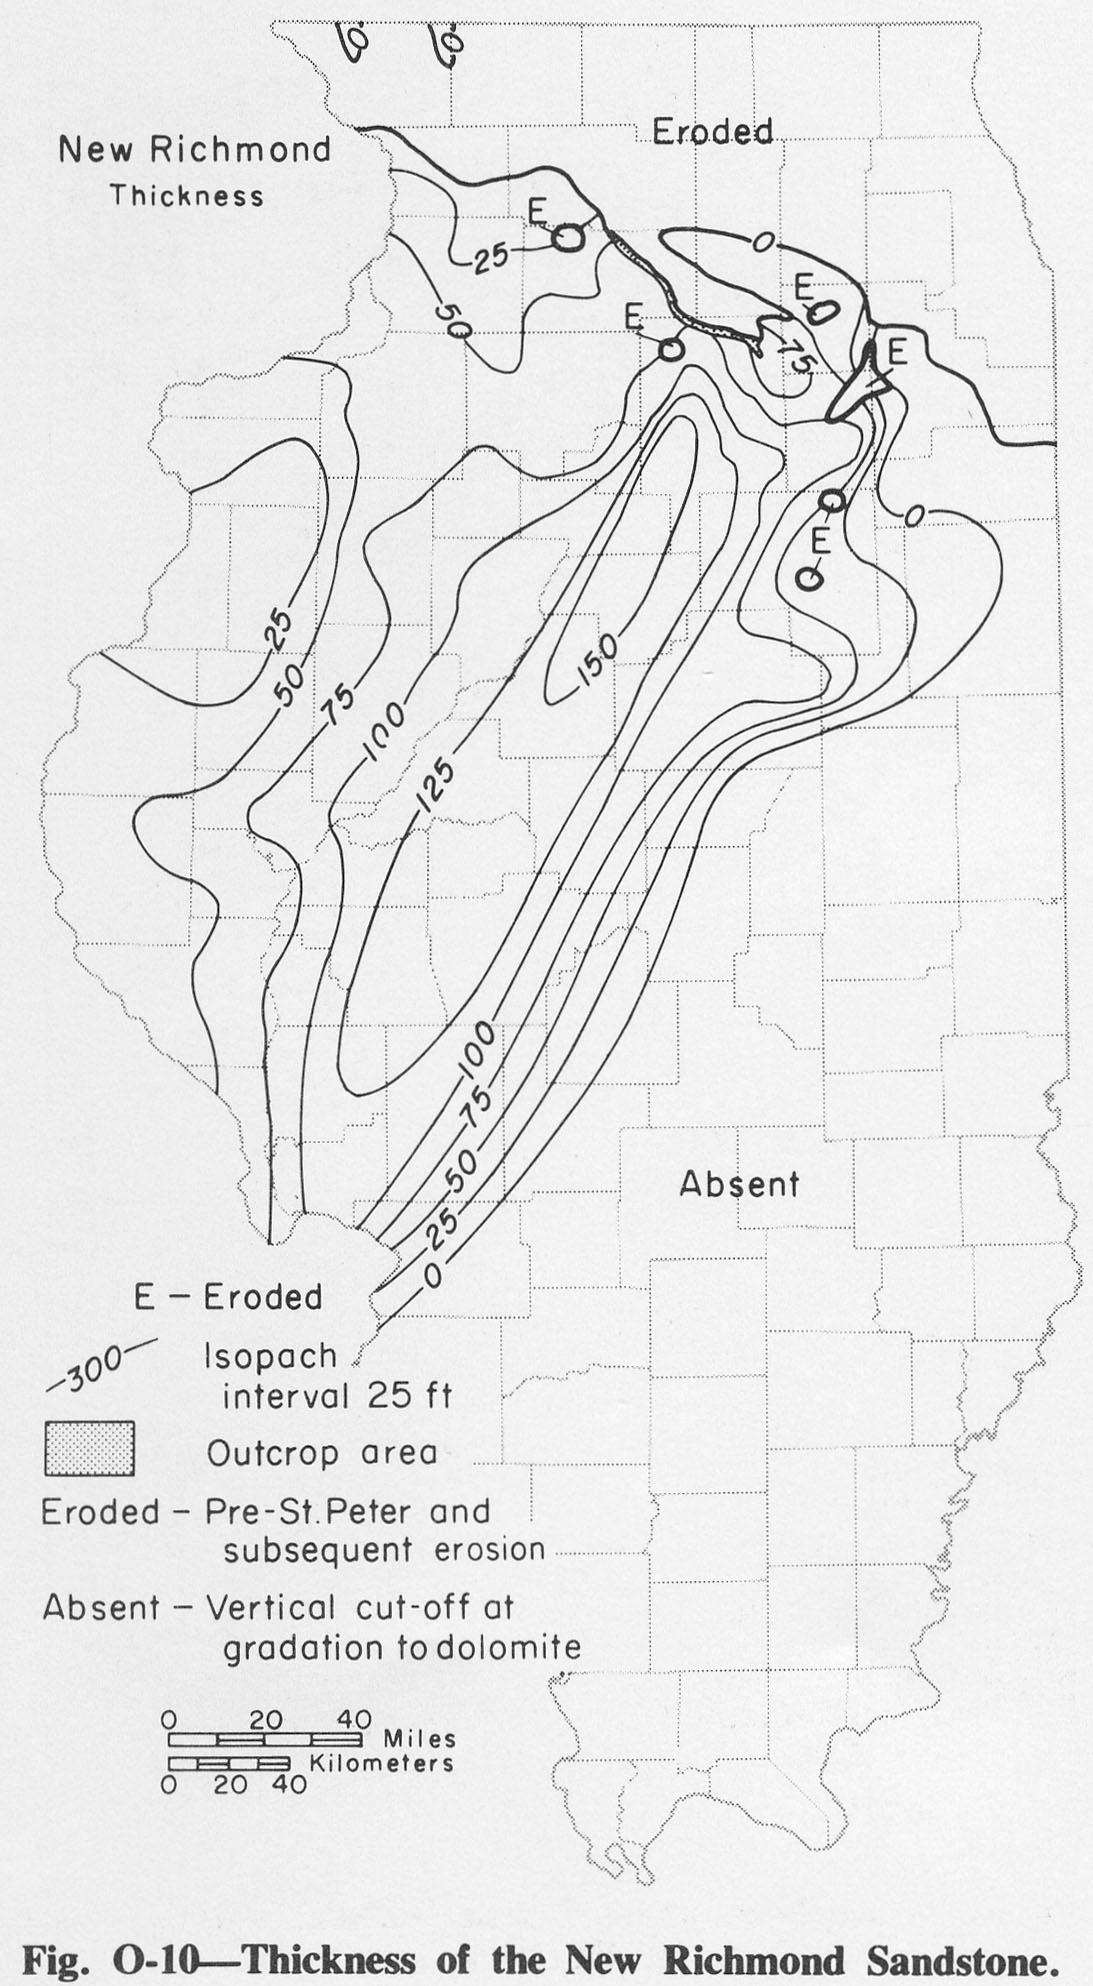
| 14:51, 4 April 2016 | Figure O-10.jpg (file) |  |
287 KB | Alan.Myers | Fig. O-10 -- Thickness of the New Richmond Sandstone. | 1 |
| 14:50, 4 April 2016 | Figure O-9.jpg (file) |  |
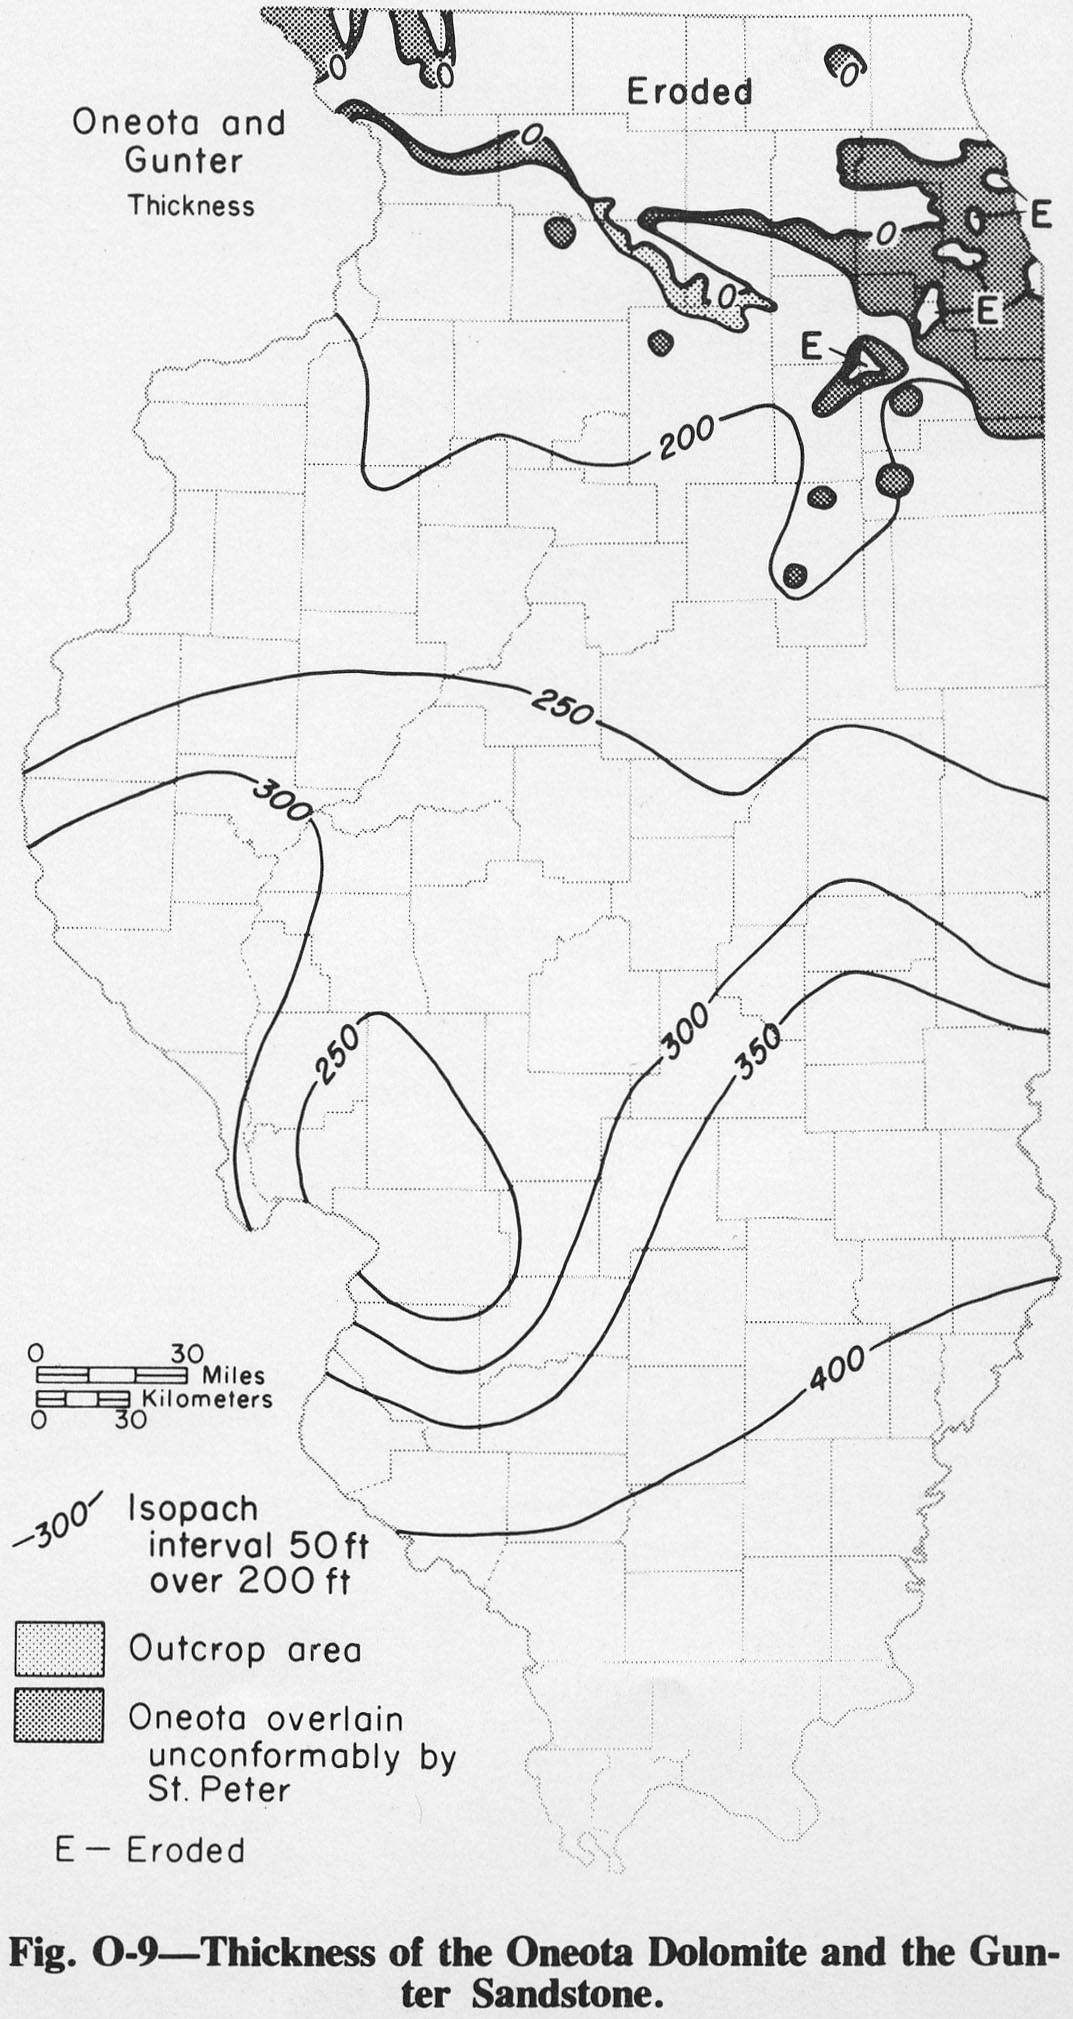
291 KB | Alan.Myers | Fig. O-9 -- Thickness of the Oneota Dolomite and the Gunter Sandstone. | 1 |
| 14:49, 4 April 2016 | Figure O-8.jpg (file) |  |
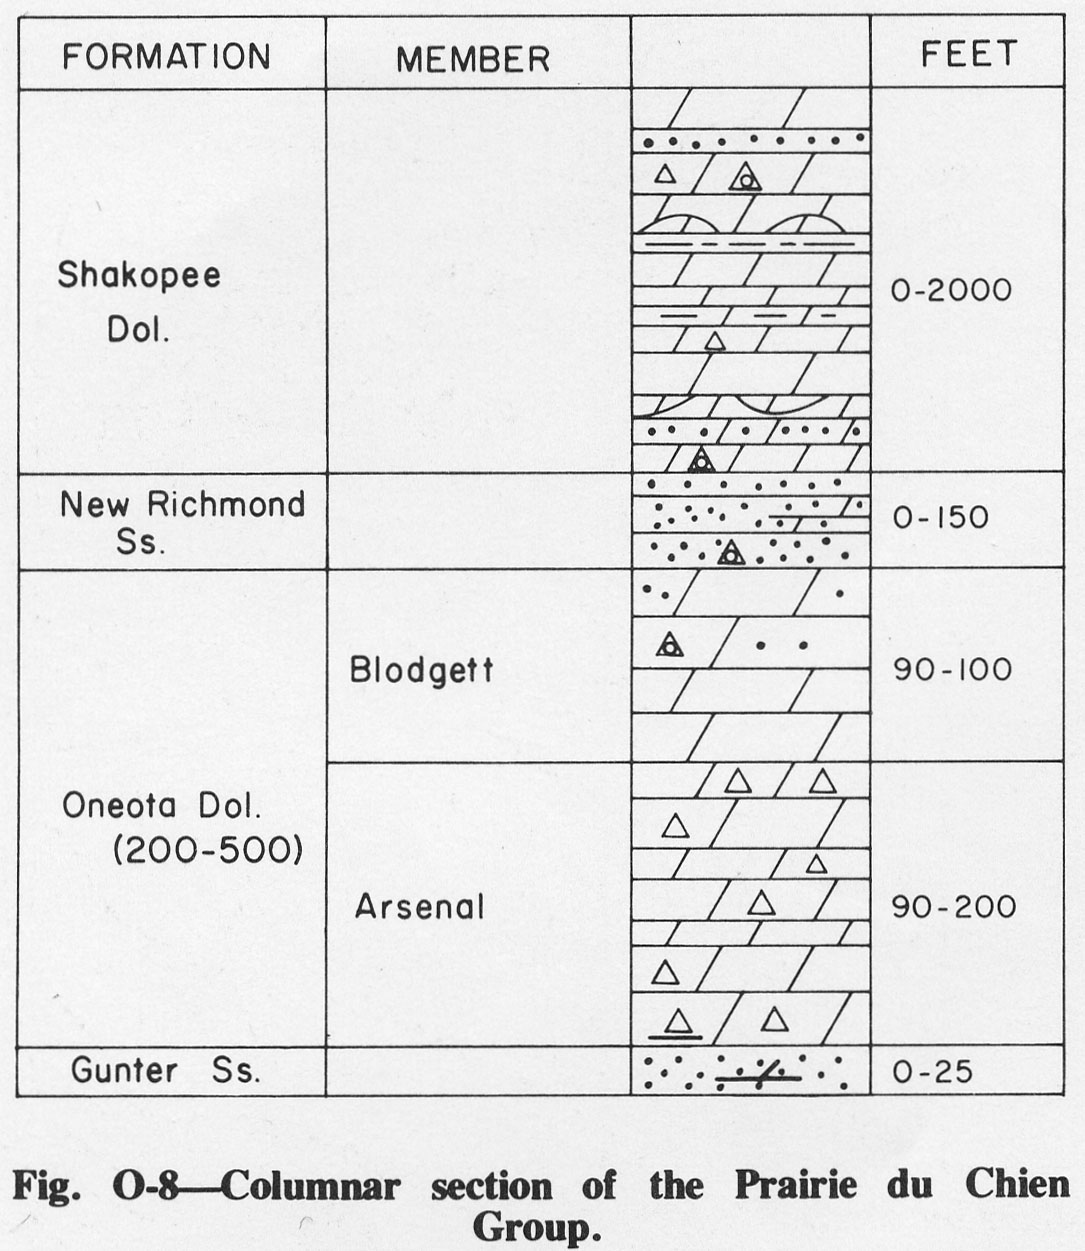
225 KB | Alan.Myers | Fig. O-8 -- Columnar section of the Prairie du Chien Group. | 1 |
| 14:48, 4 April 2016 | Figure O-7.jpg (file) |  |
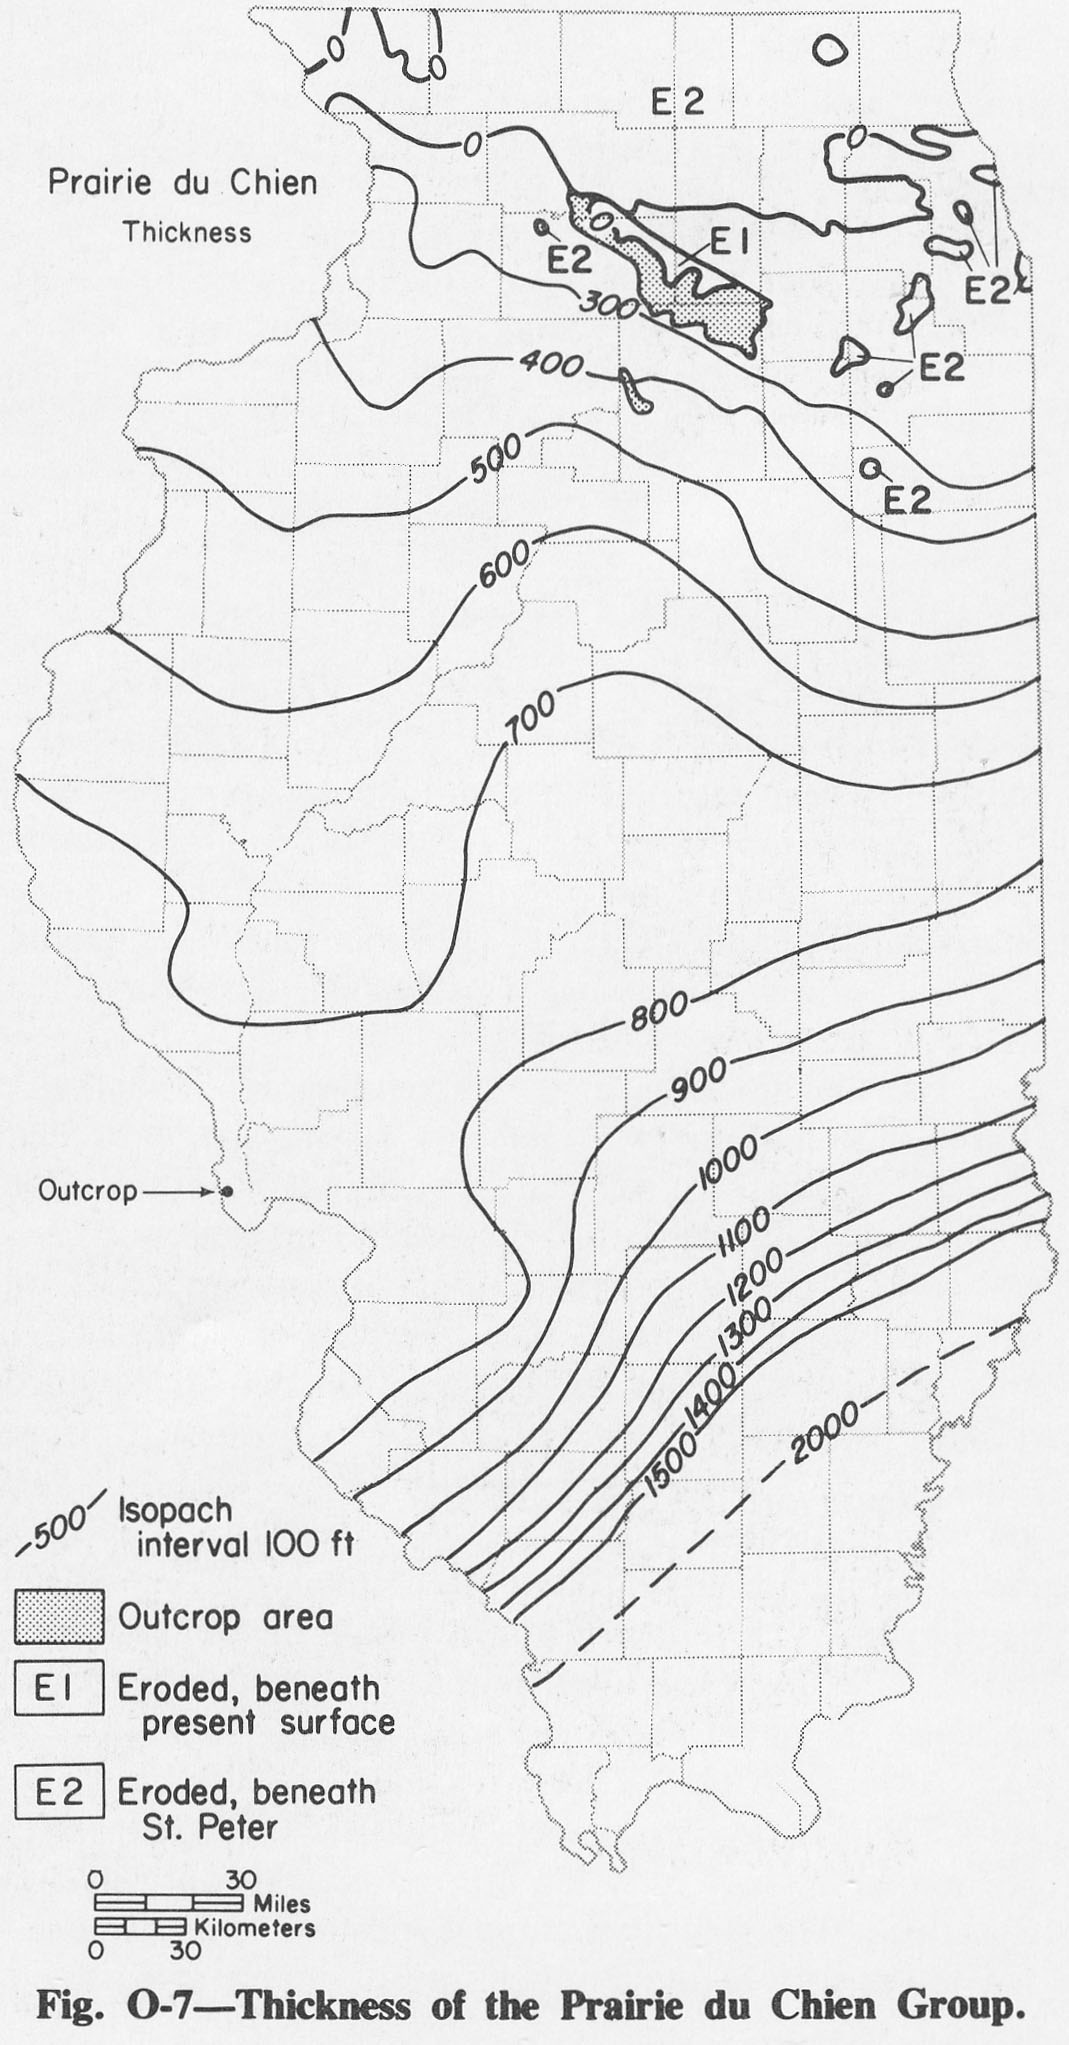
289 KB | Alan.Myers | Fig. O-7 -- Thickness of the Prairie du Chien Group. | 1 |
| 14:47, 4 April 2016 | Figure O-6.jpg (file) |  |
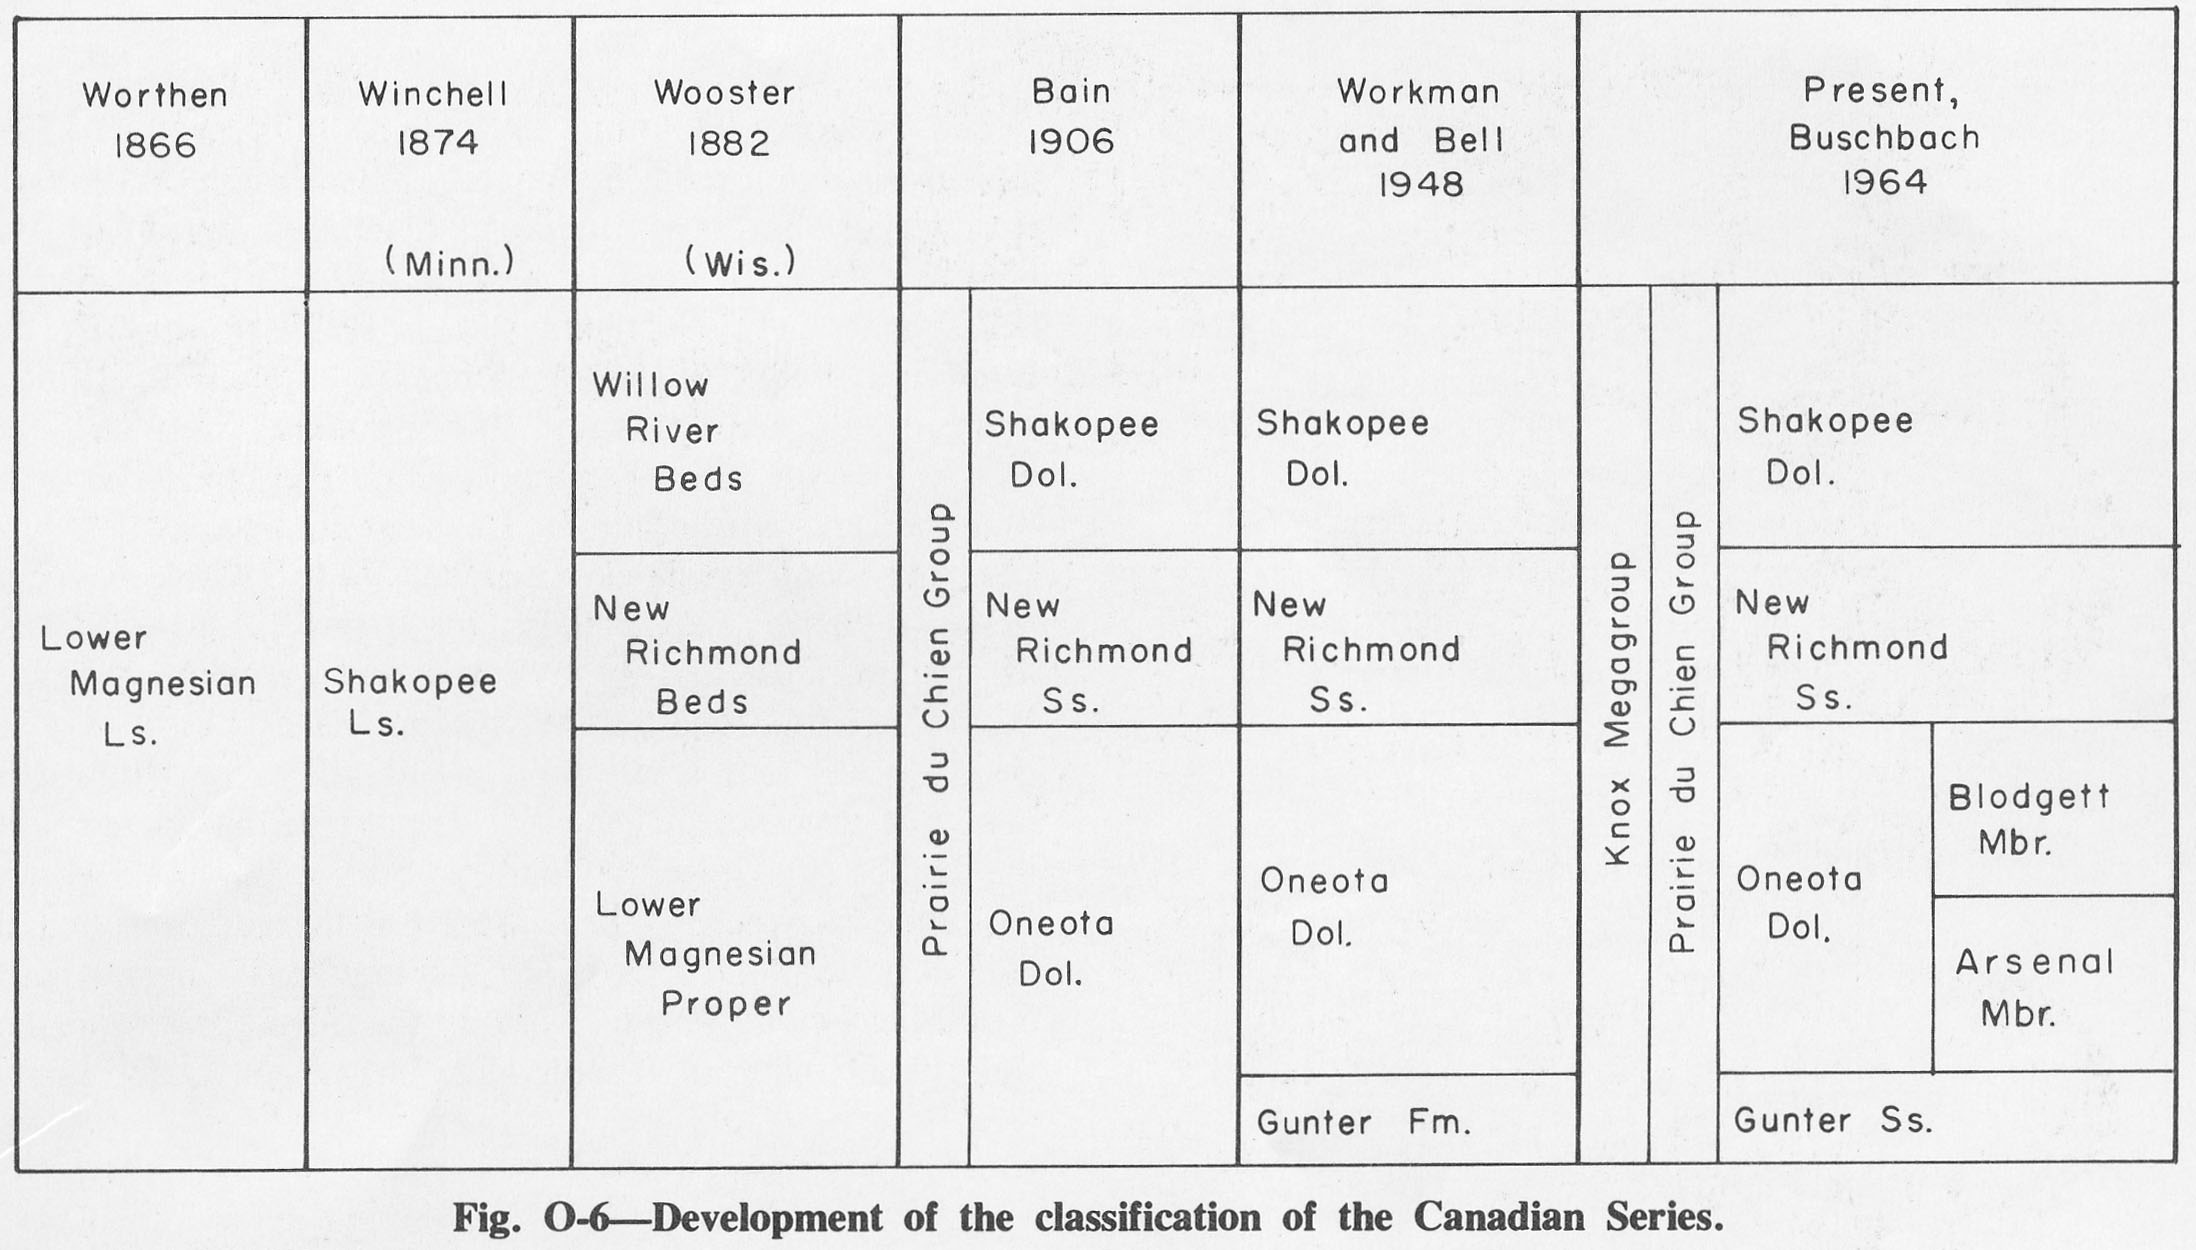
251 KB | Alan.Myers | Fig. O-6 -- Development of the Classification of the Canadian Series. | 1 |
| 14:46, 4 April 2016 | Figure O-5.jpg (file) |  |
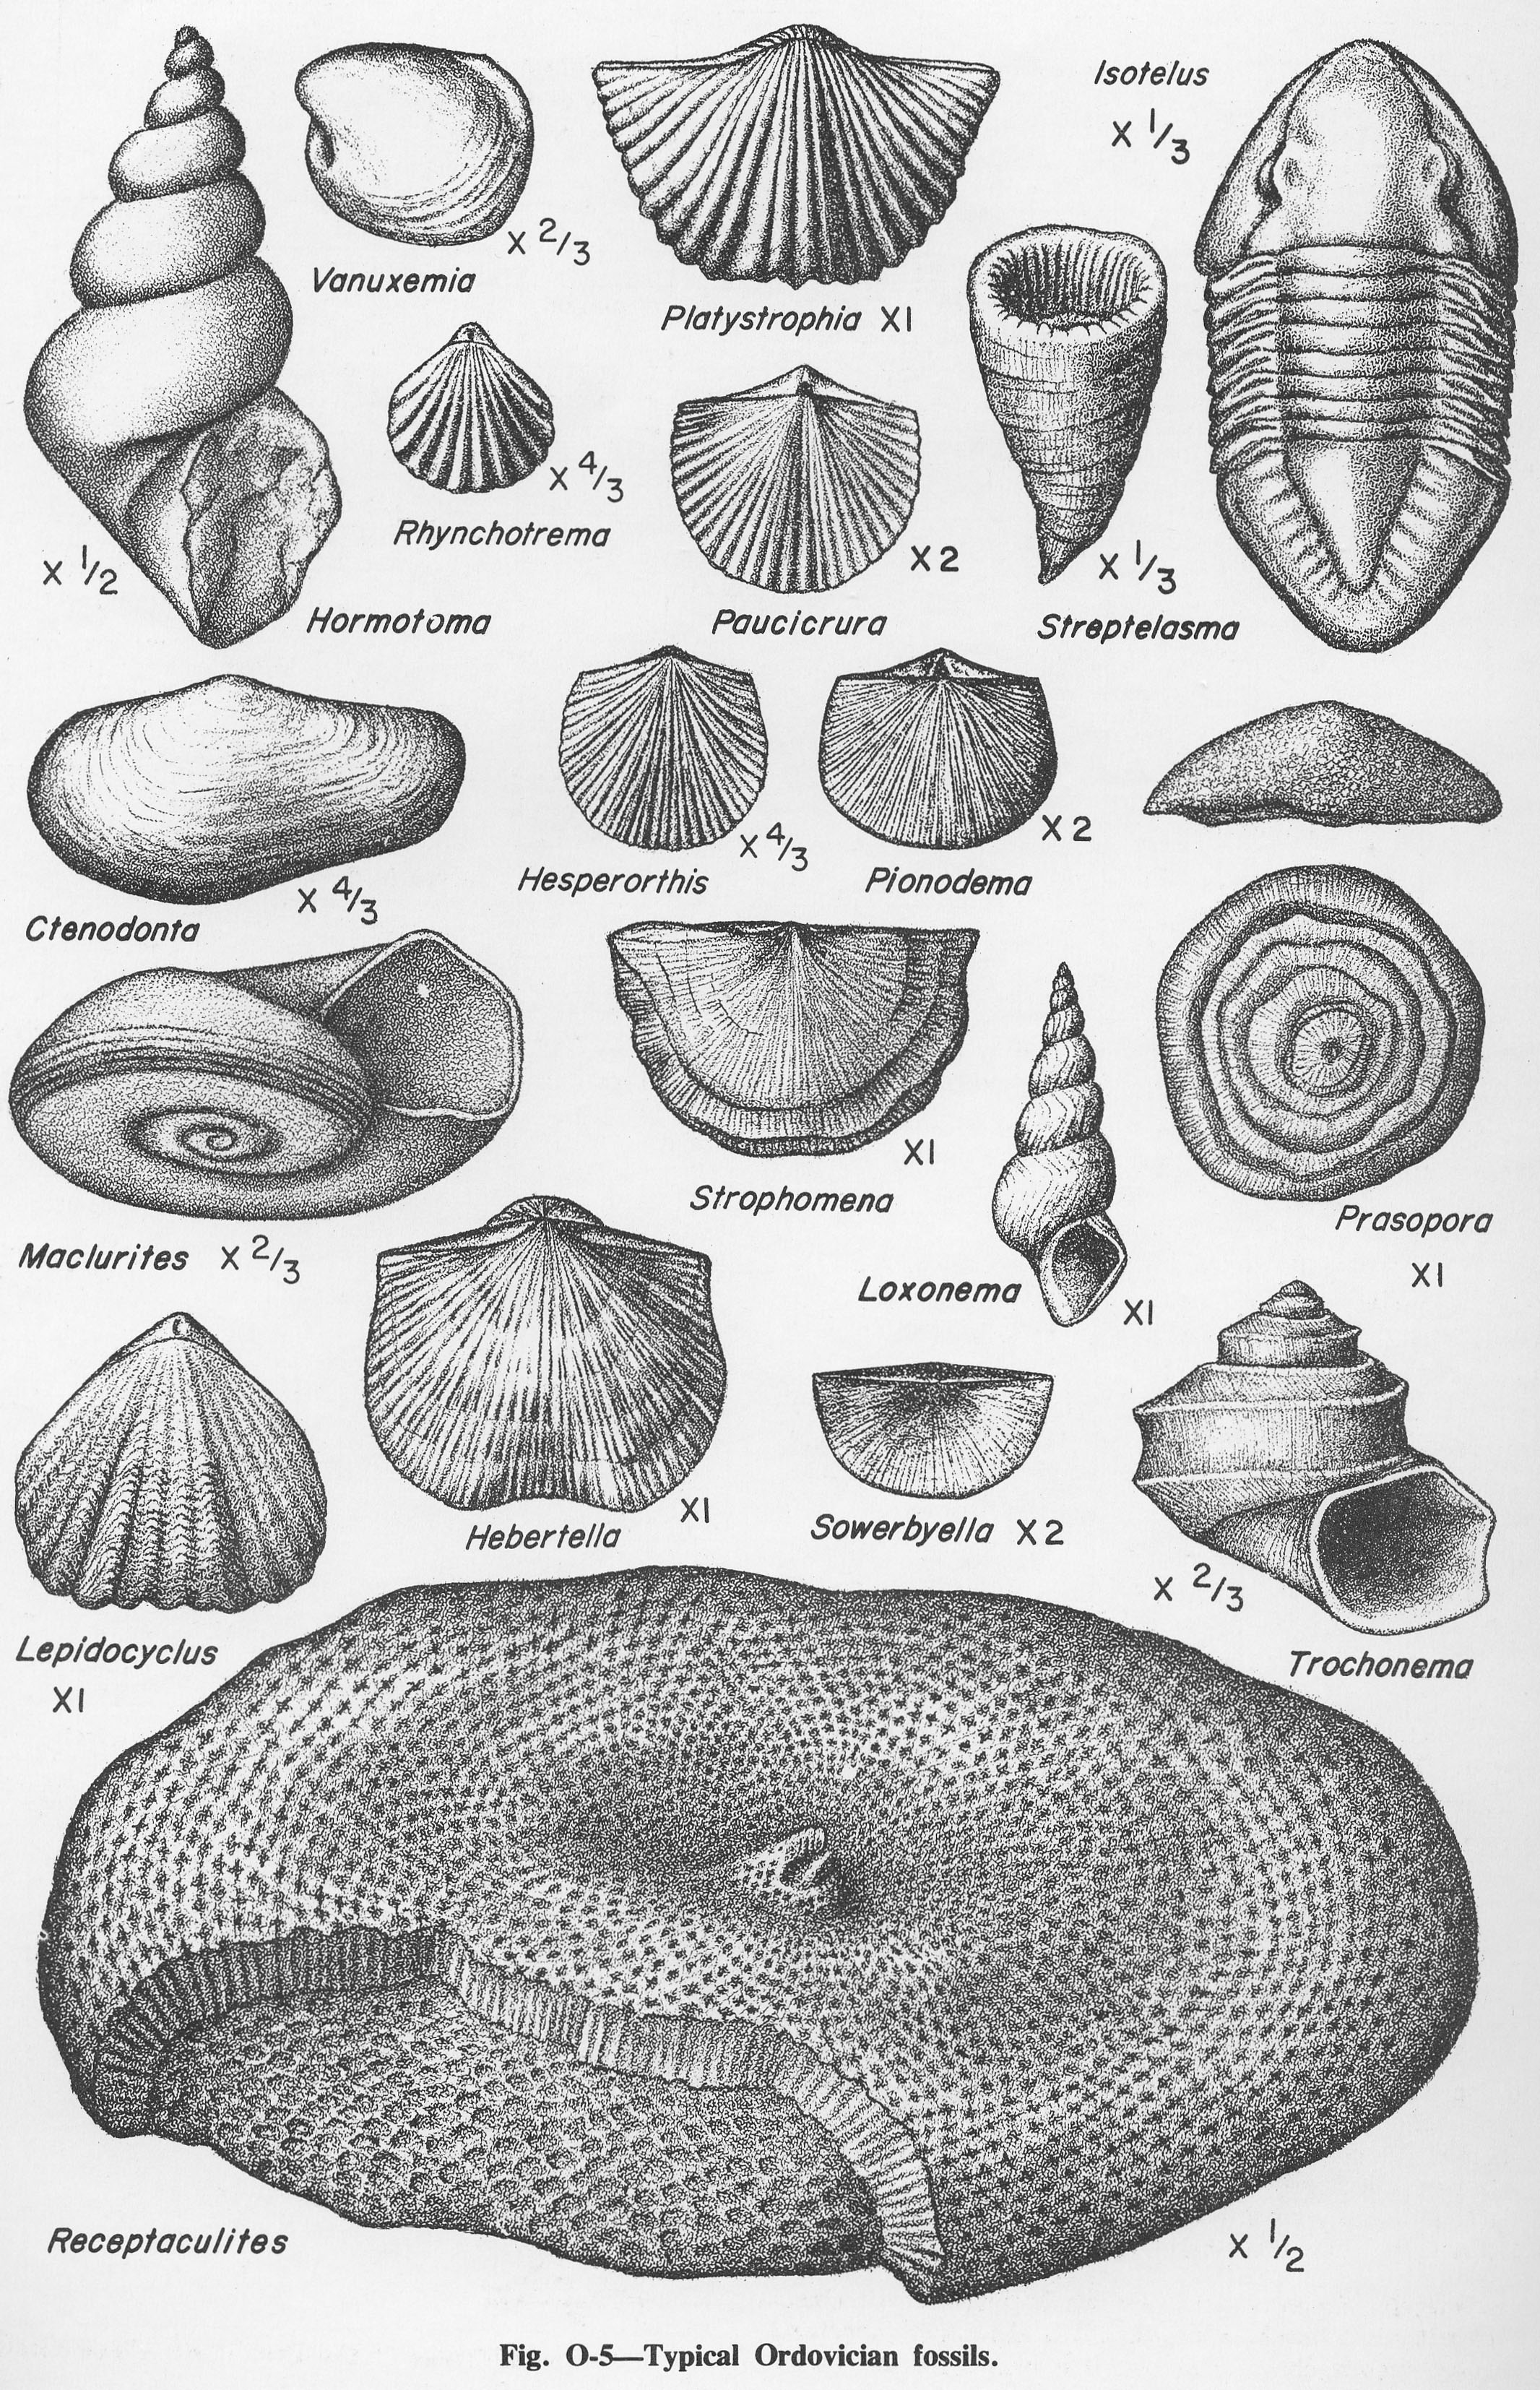
1.9 MB | Alan.Myers | Fig. O-5 -- Typical Ordovician fossils | 1 |
| 14:45, 4 April 2016 | Figure O-4.jpg (file) |  |
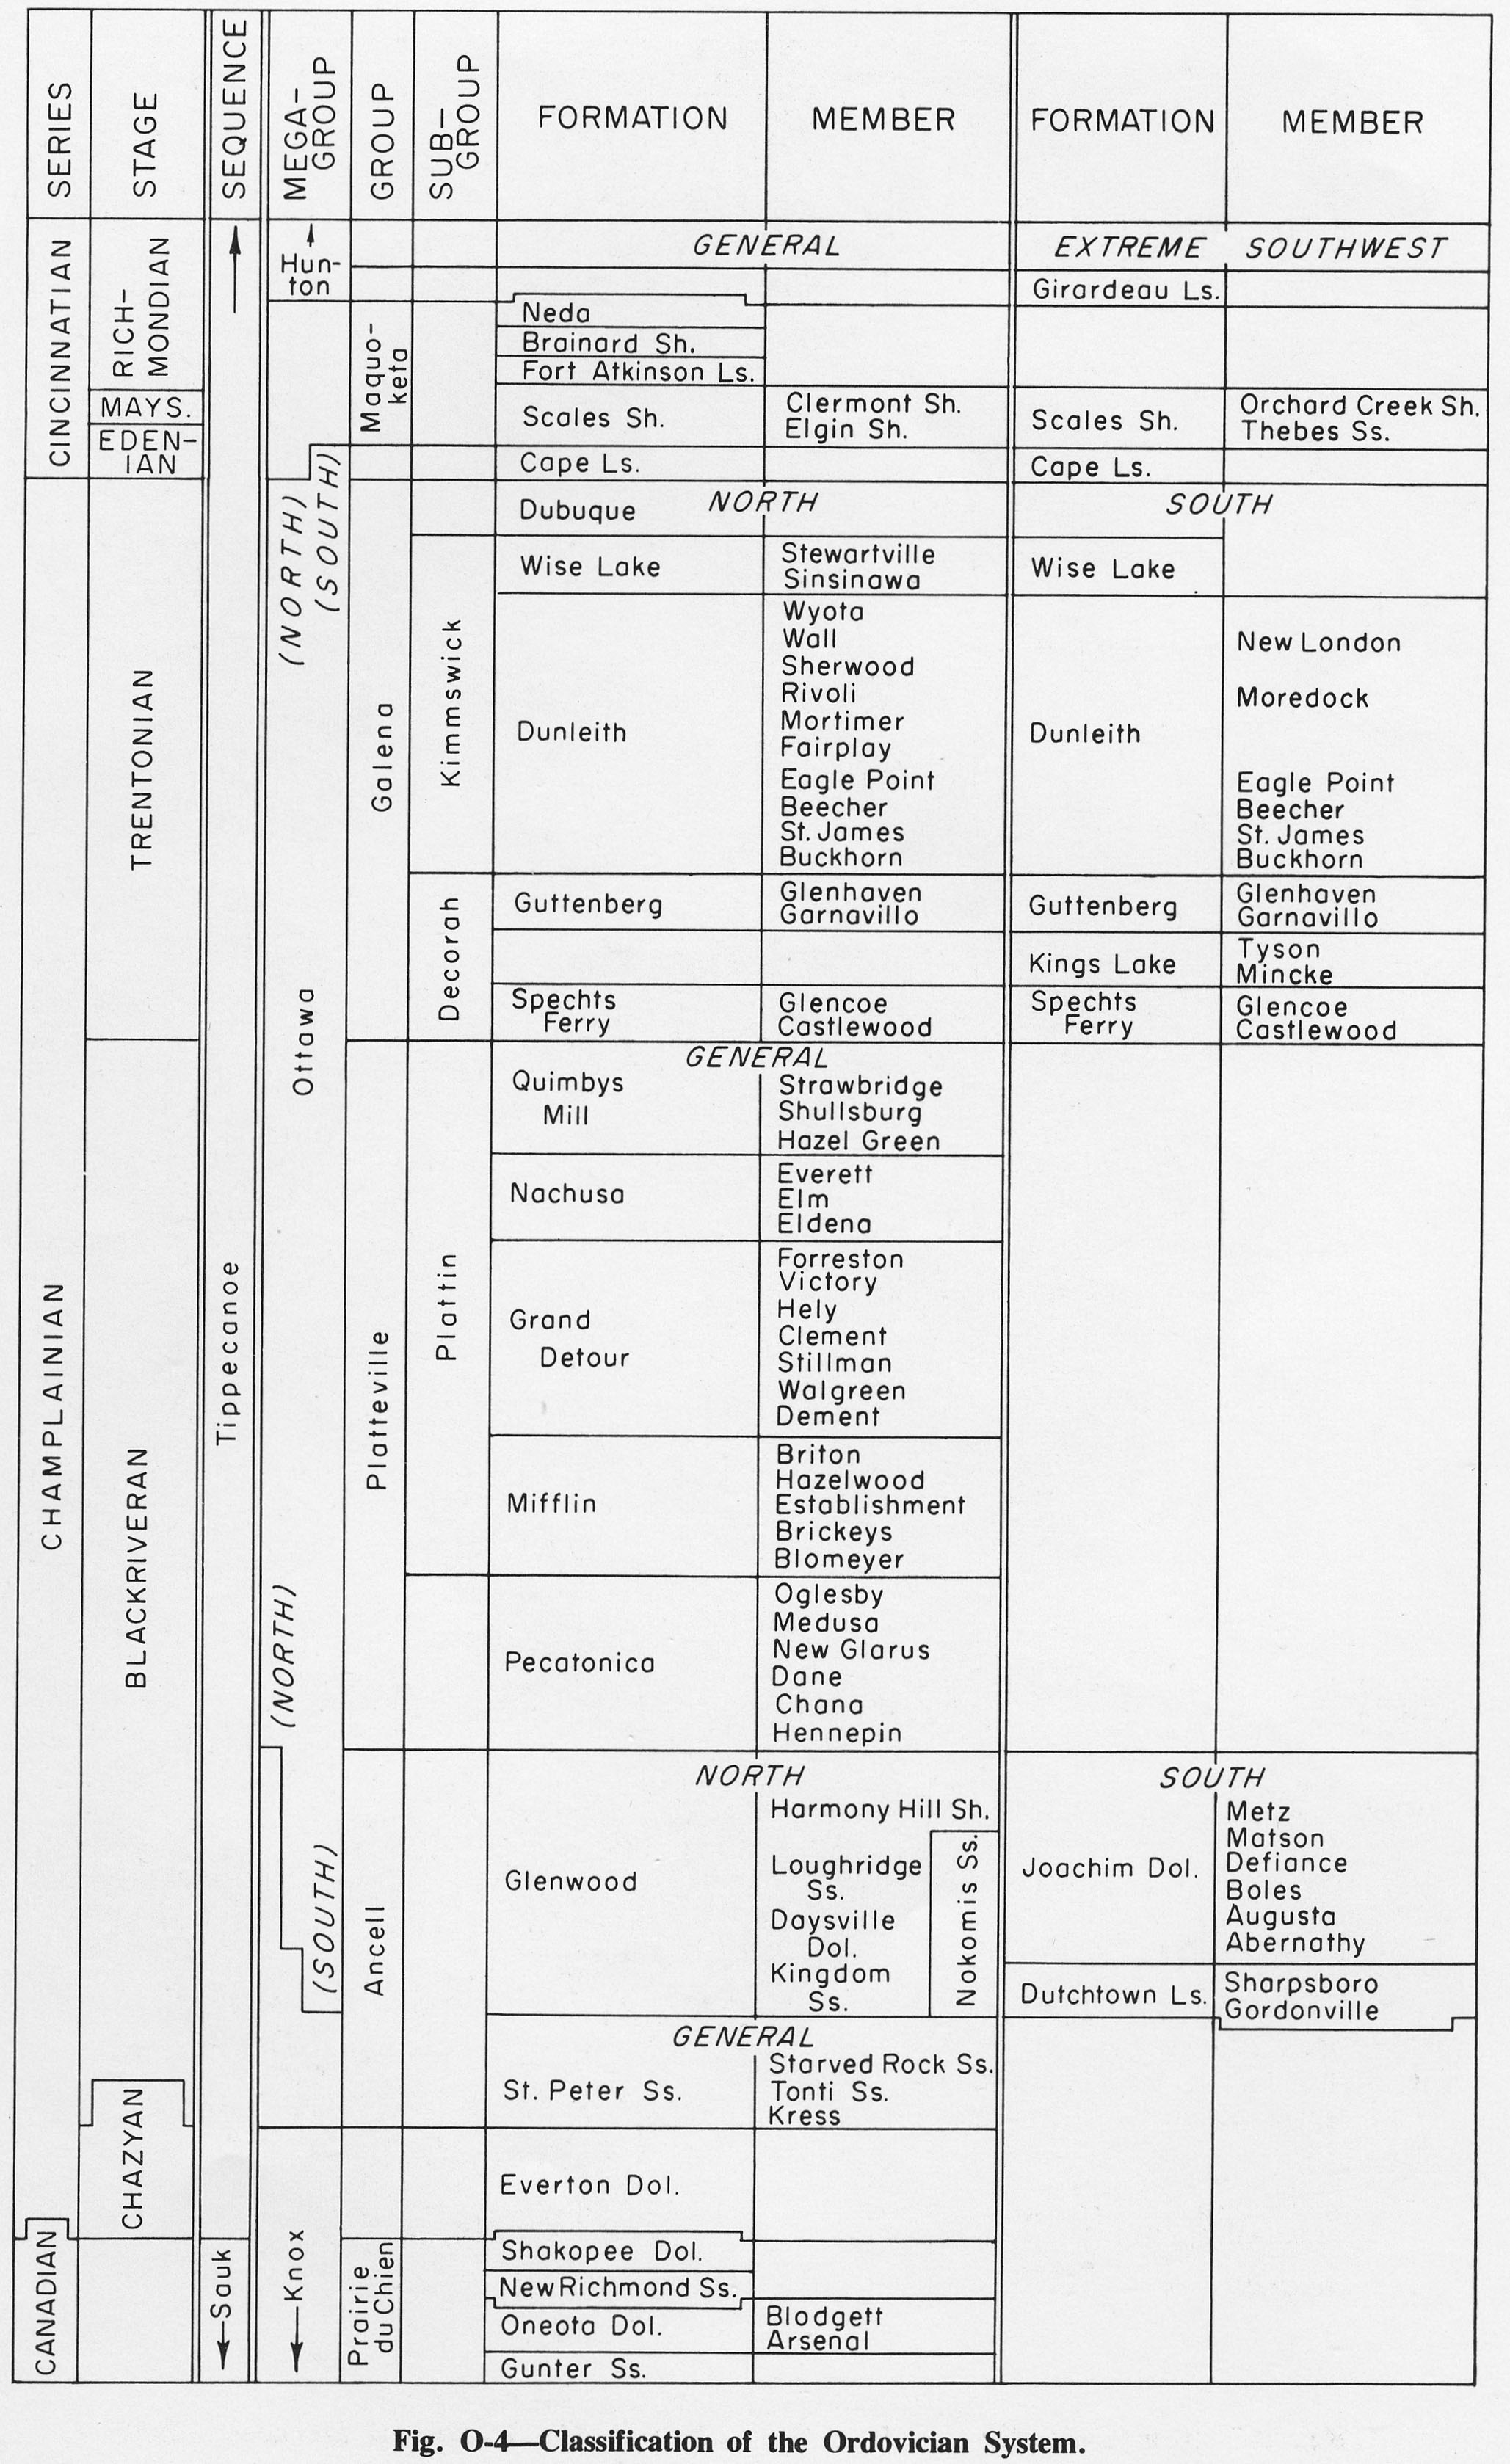
799 KB | Alan.Myers | Fig. O-4 -- Classification of the Ordovician System. | 1 |
| 14:45, 4 April 2016 | Figure O-3.jpg (file) |  |
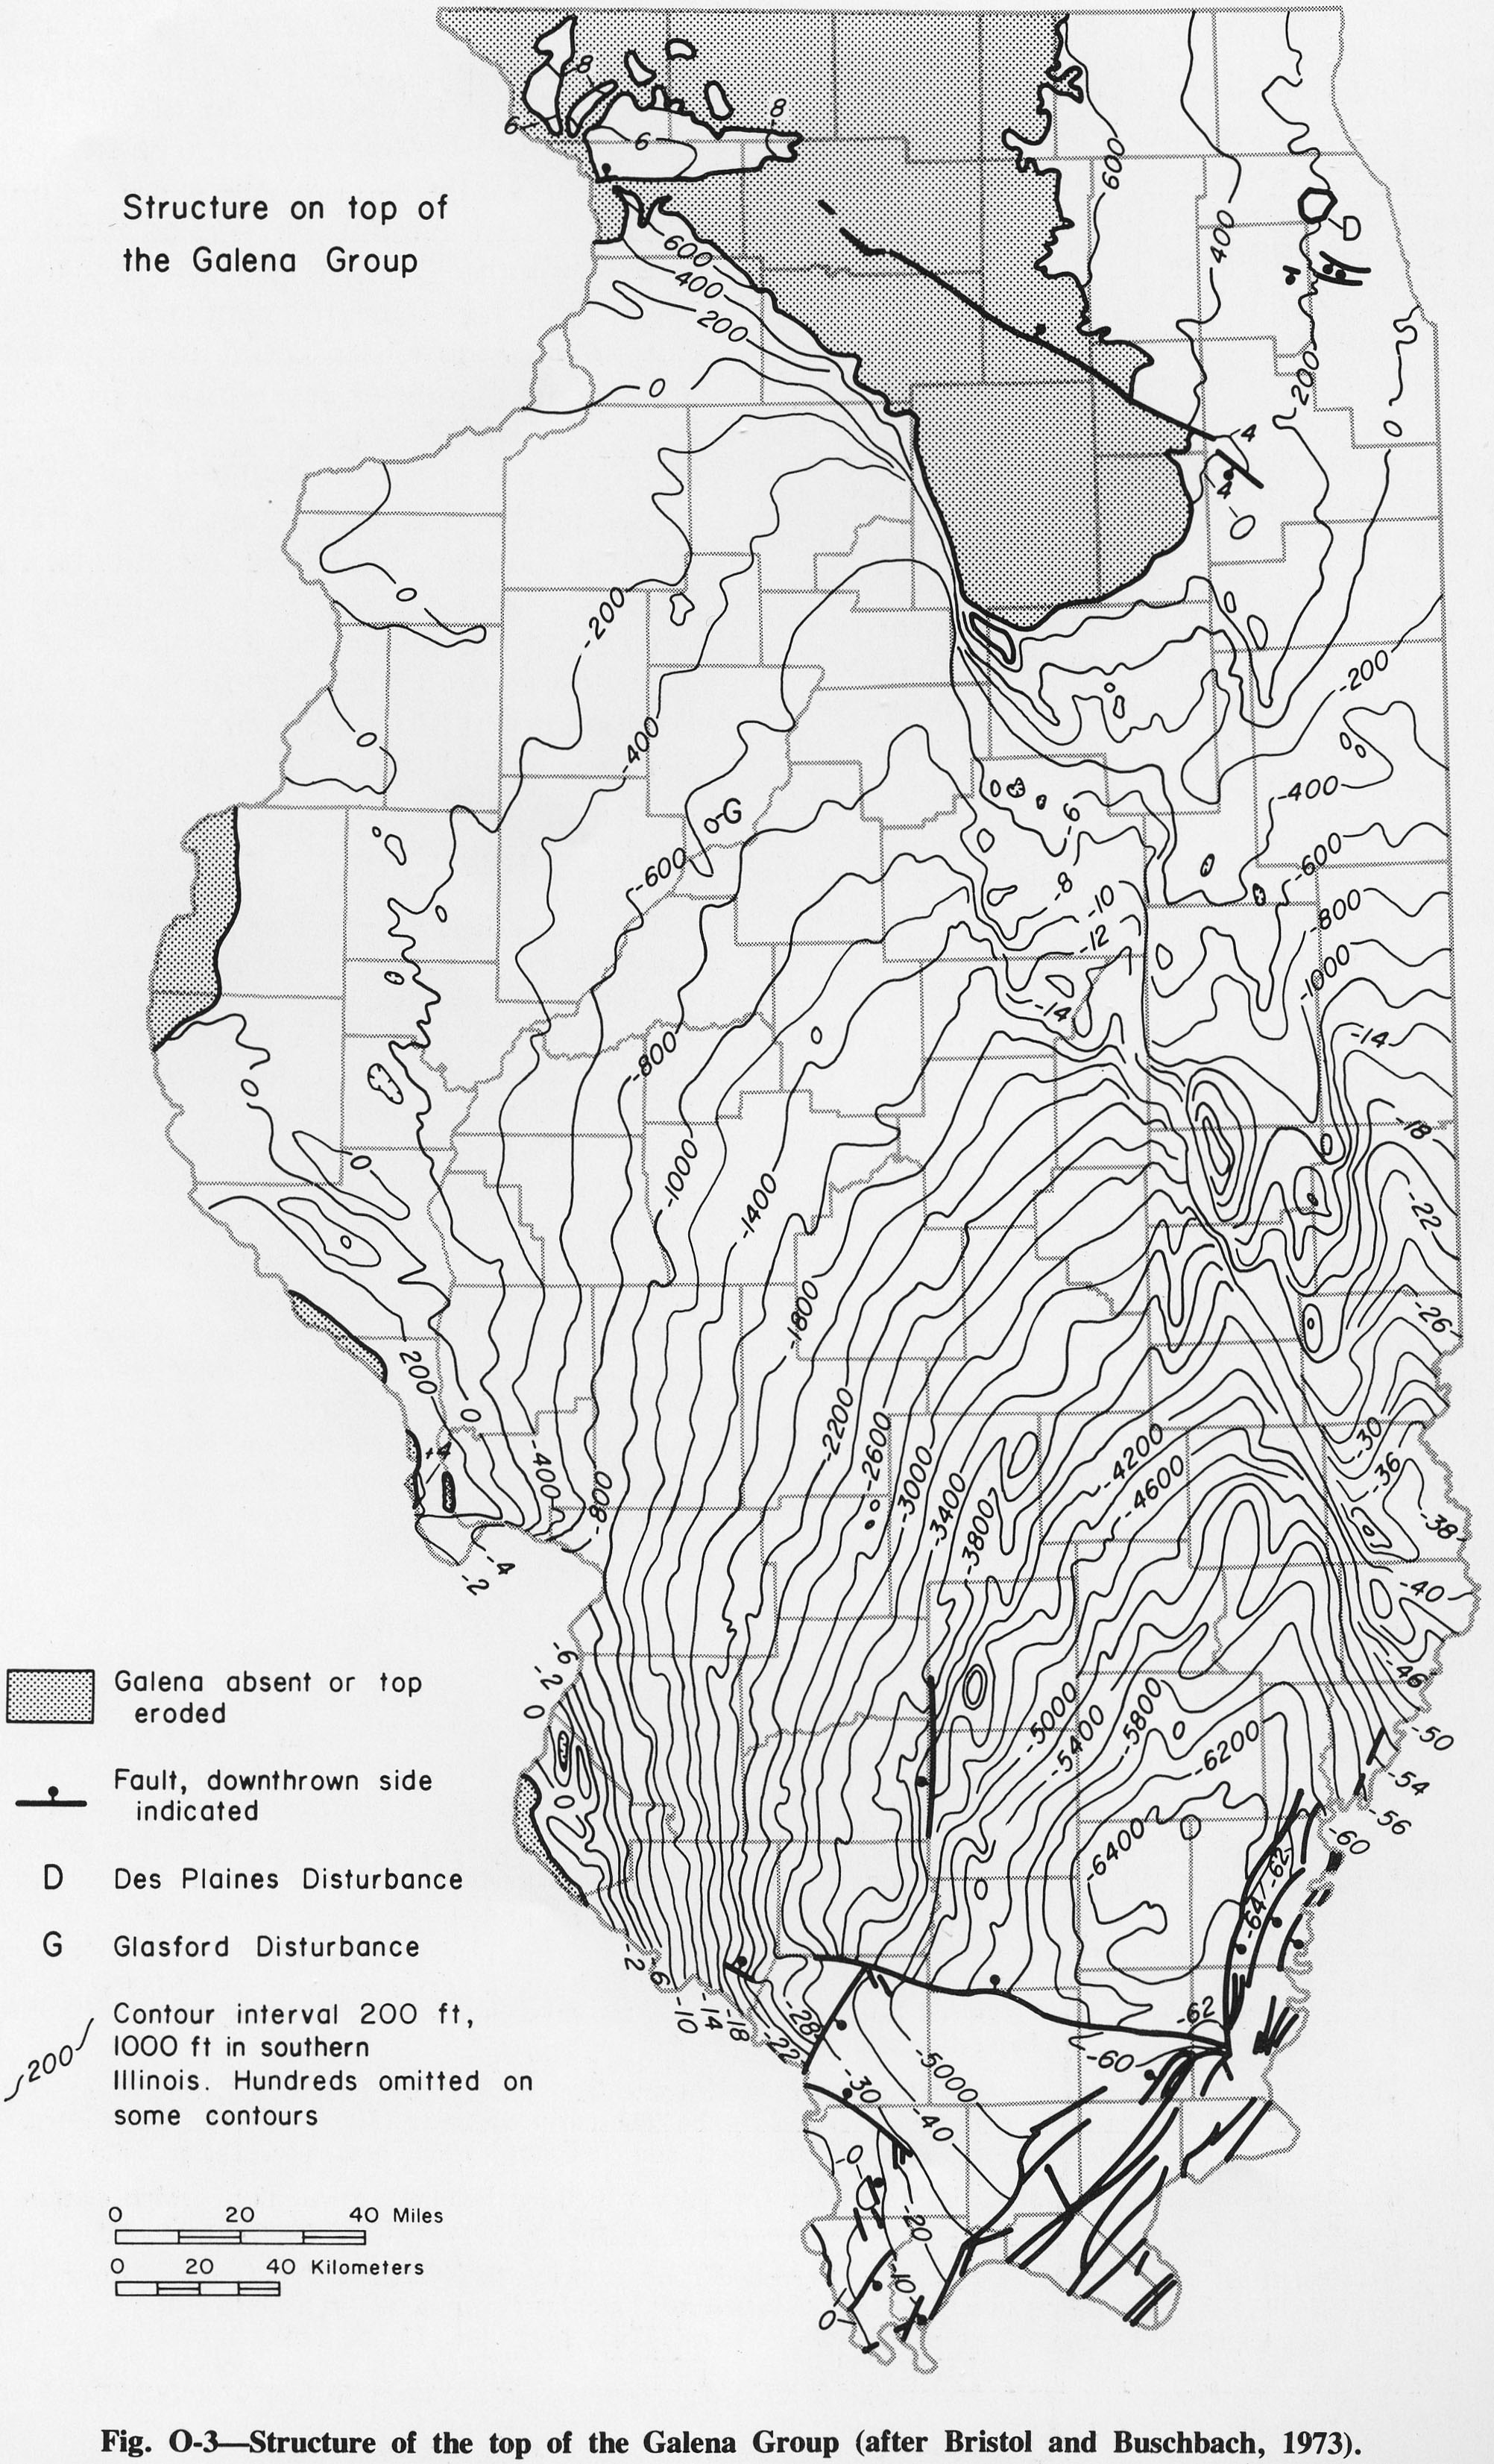
1.04 MB | Alan.Myers | Fig O-3 -- Structure of the top of the Galena Group (after Bristol and Buschbach, 1973). | 1 |
| 14:43, 4 April 2016 | Figure O-1.jpg (file) |  |
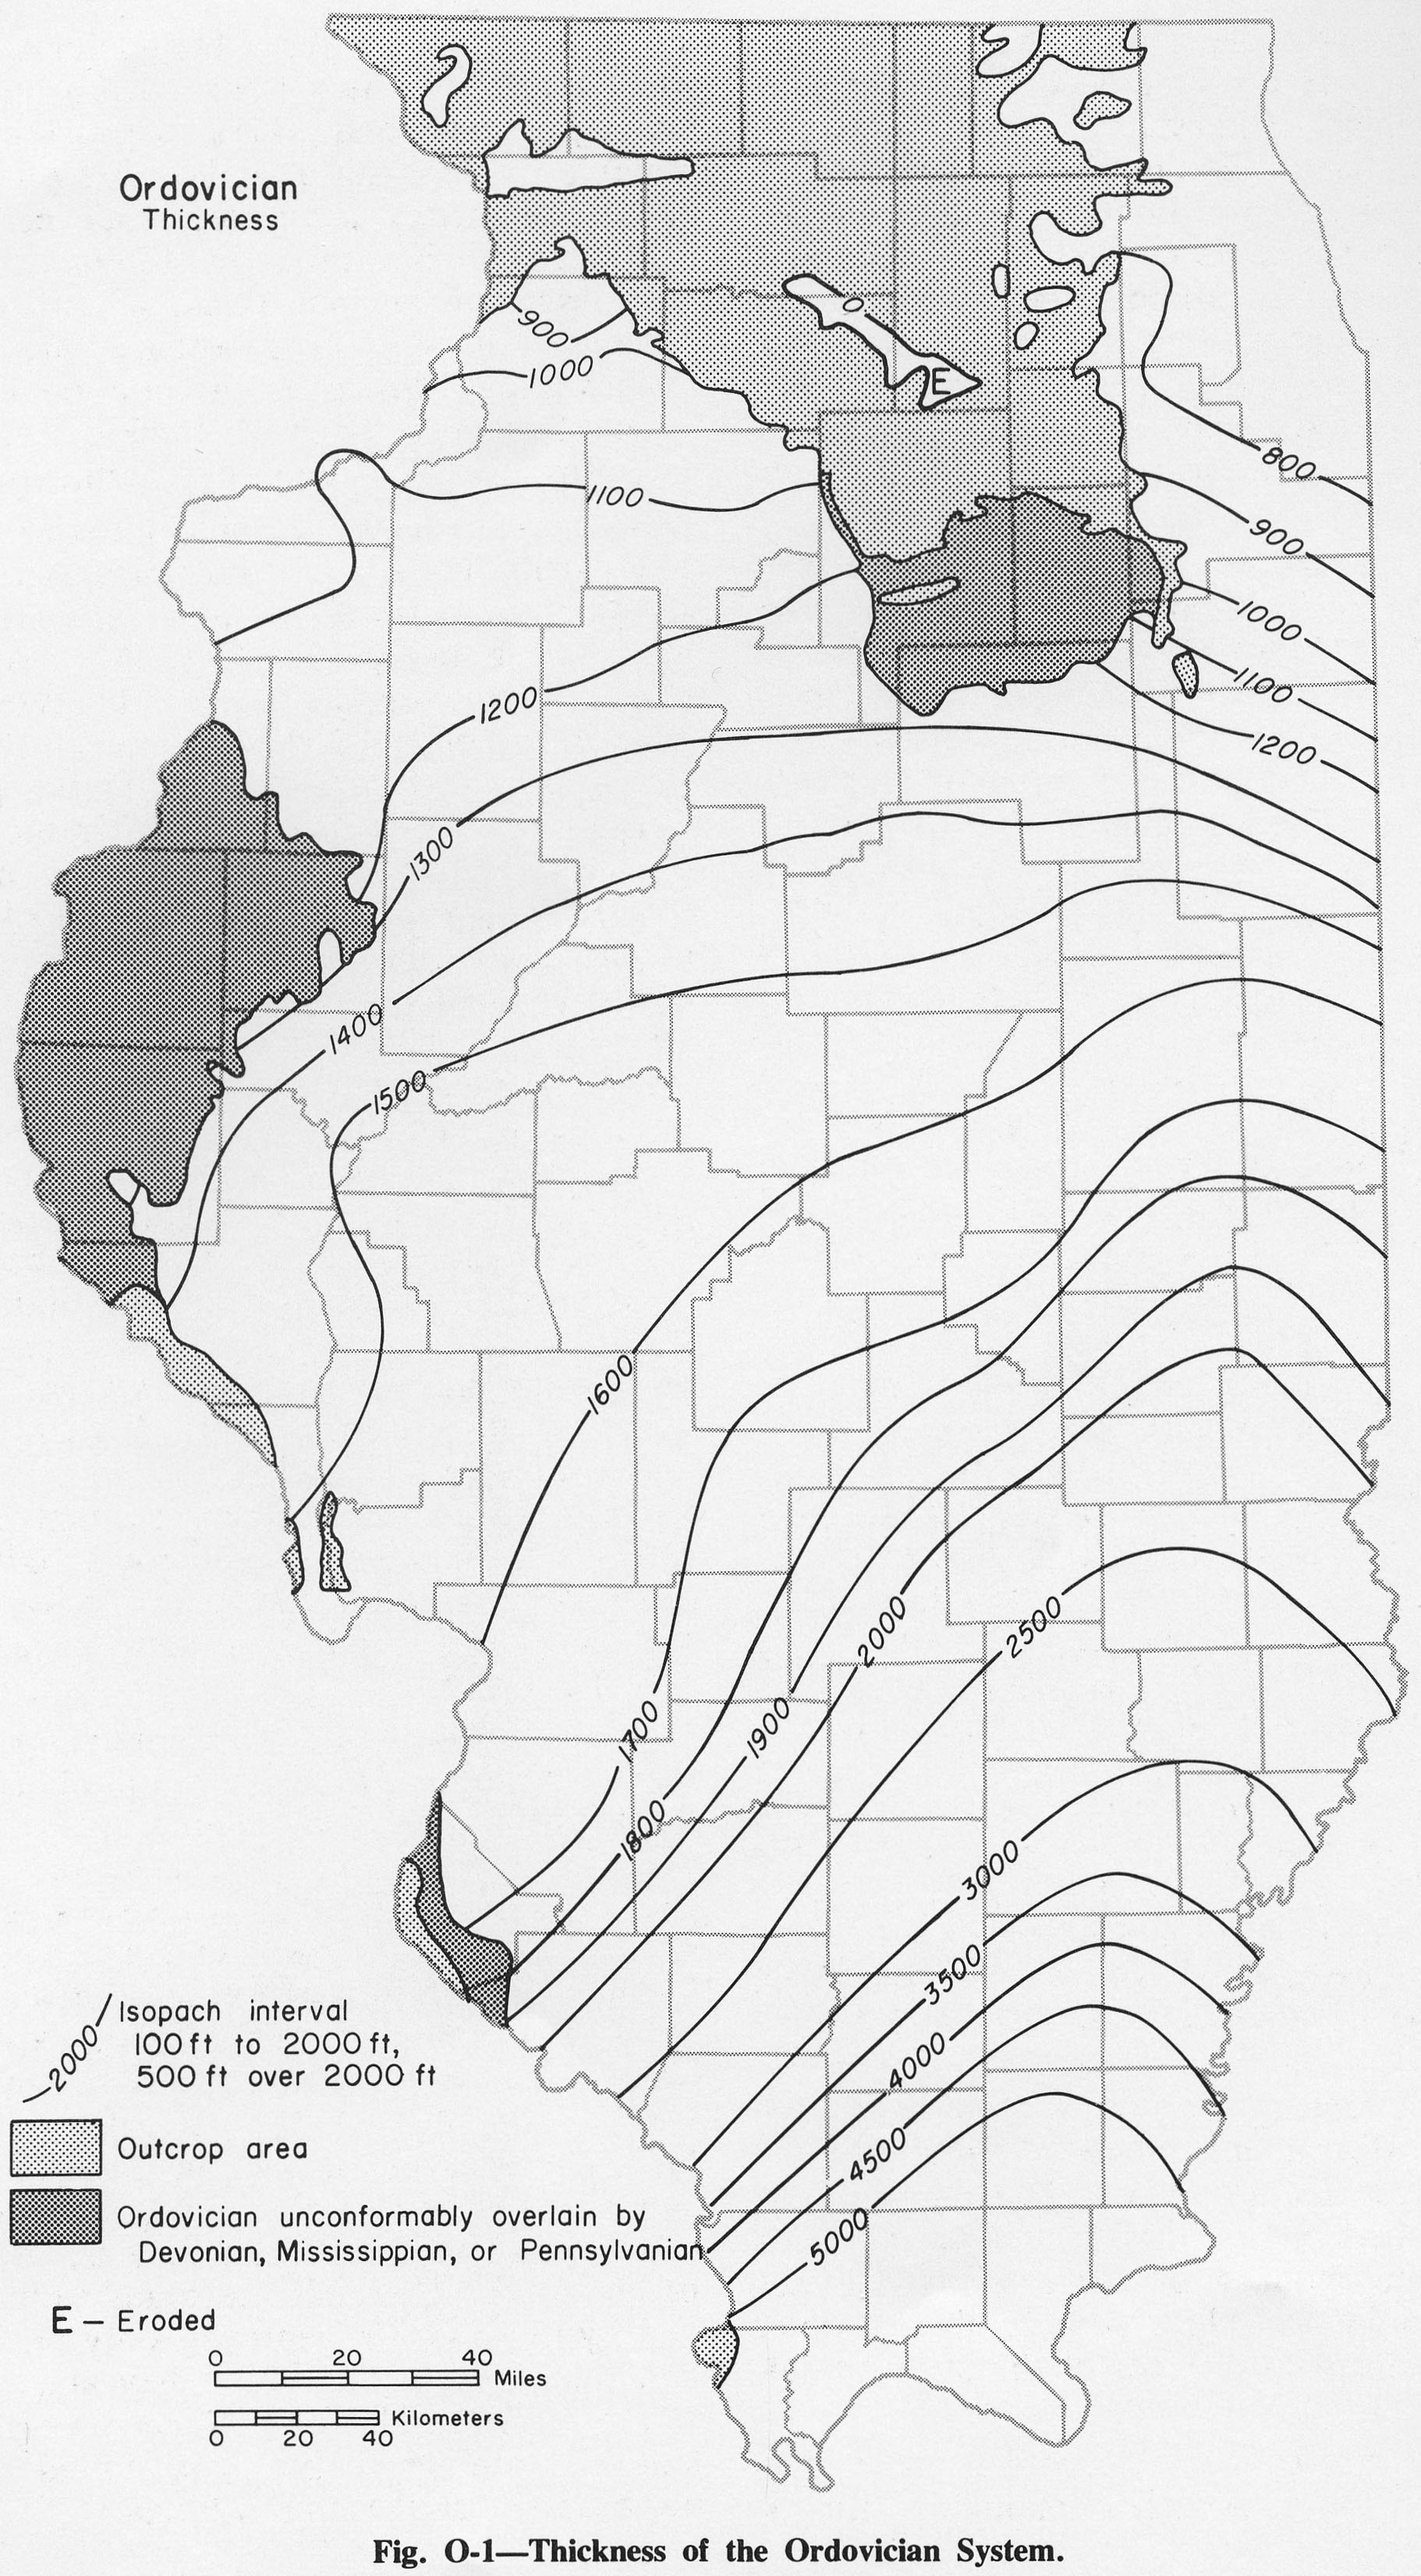
929 KB | Alan.Myers | Fig O-1 -- Thickness of Ordovician System. | 1 |
| 14:29, 4 April 2016 | Figure M-50.jpg (file) |  |
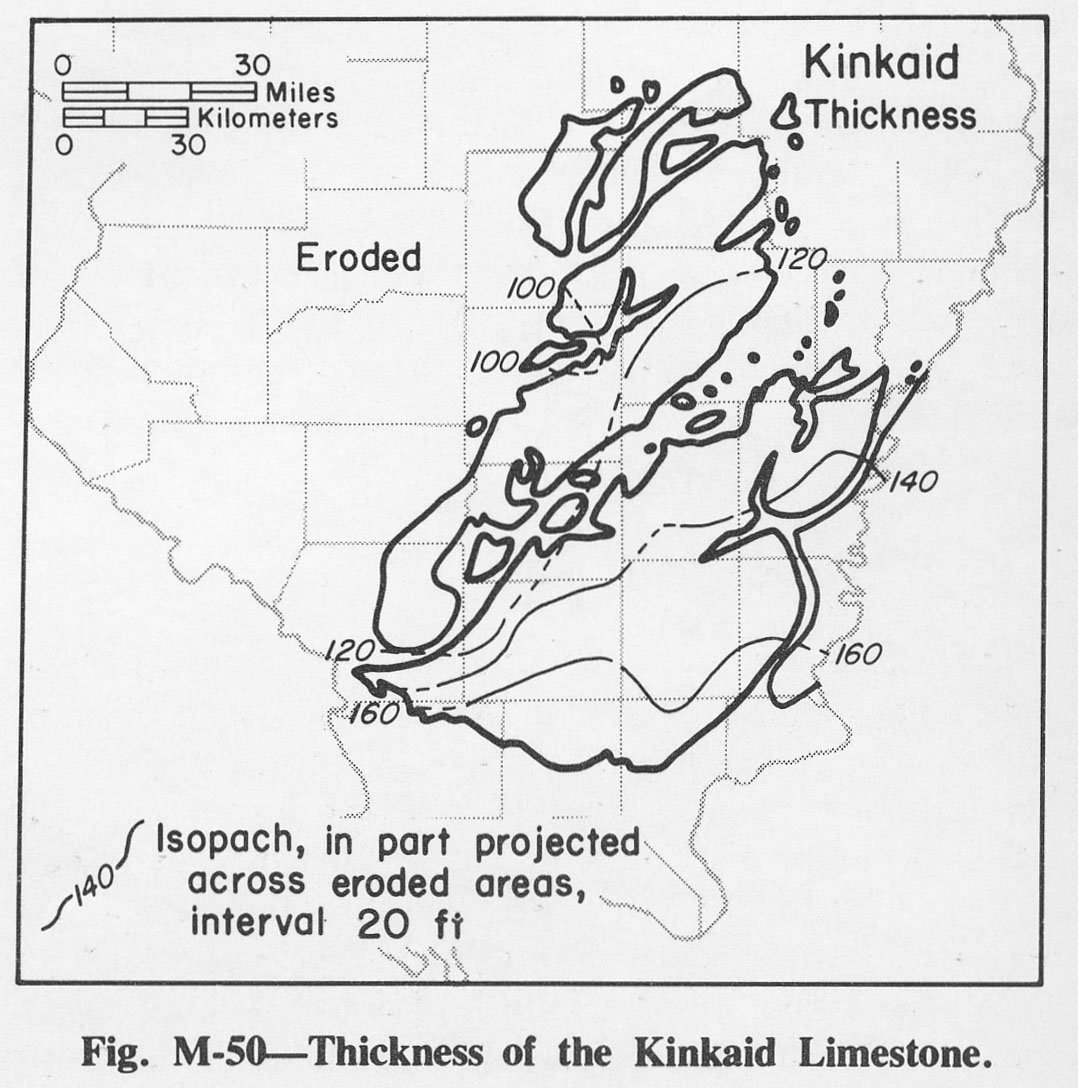
223 KB | Alan.Myers | Fig. M-50 -- Thickness of the Kinkaid Limestone. | 1 |
| 14:29, 4 April 2016 | Figure M-49.jpg (file) |  |
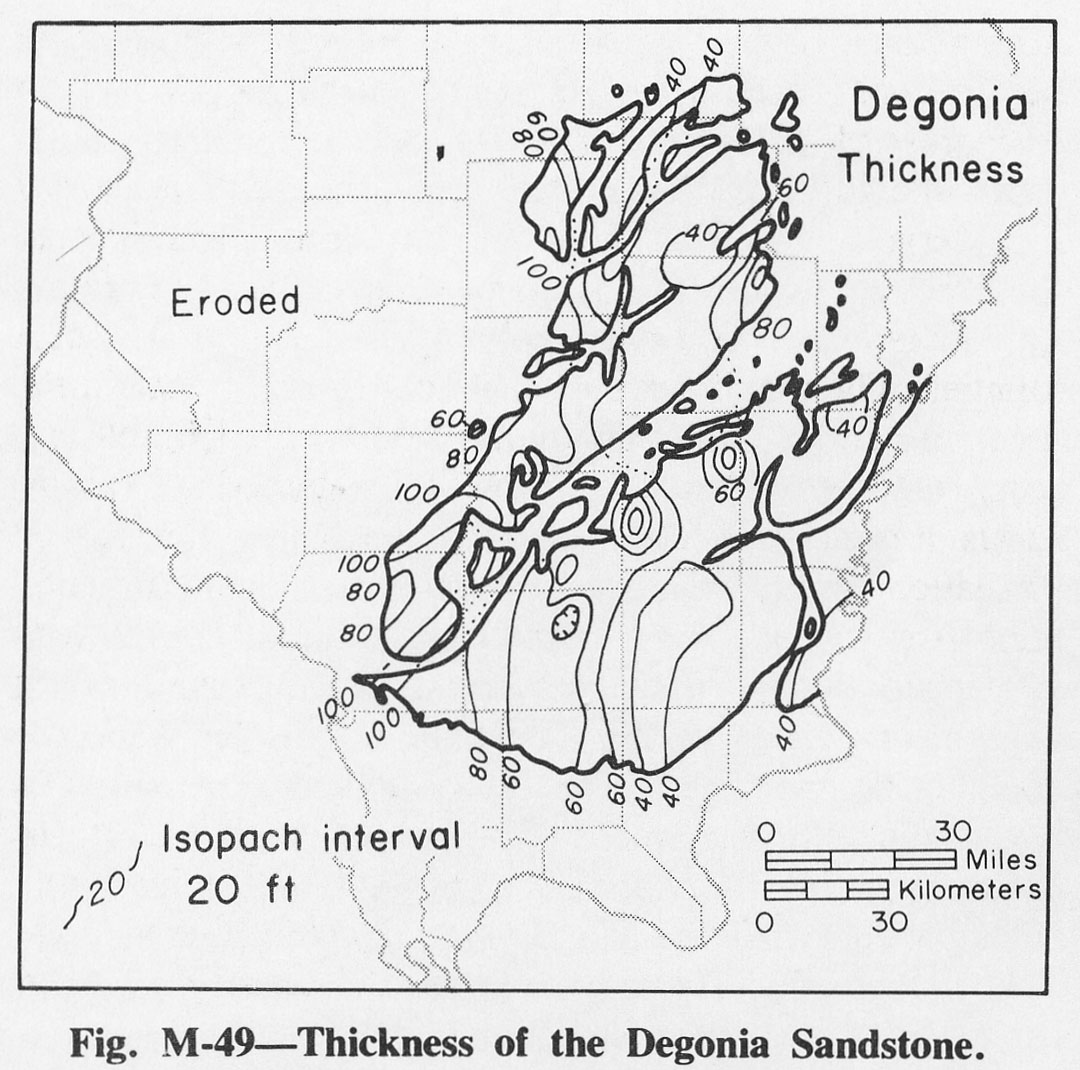
228 KB | Alan.Myers | Fig. M-49 -- Thickness of the Degonia Sandstone. | 1 |
| 14:28, 4 April 2016 | Figure M-48.jpg (file) |  |
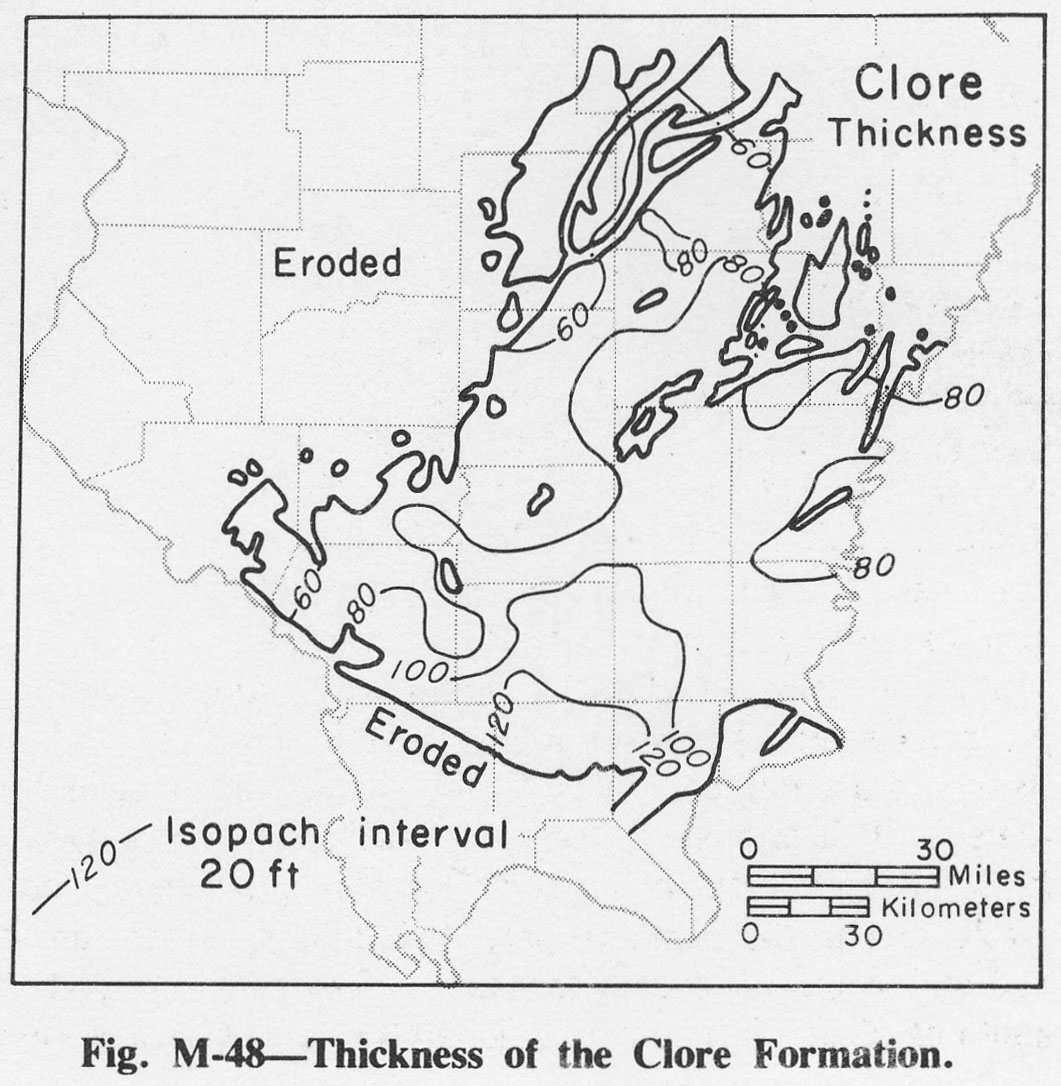
233 KB | Alan.Myers | Fig. M-48 -- Thickness of the Clore Formation. | 1 |
| 14:27, 4 April 2016 | Figure M-47.jpg (file) |  |
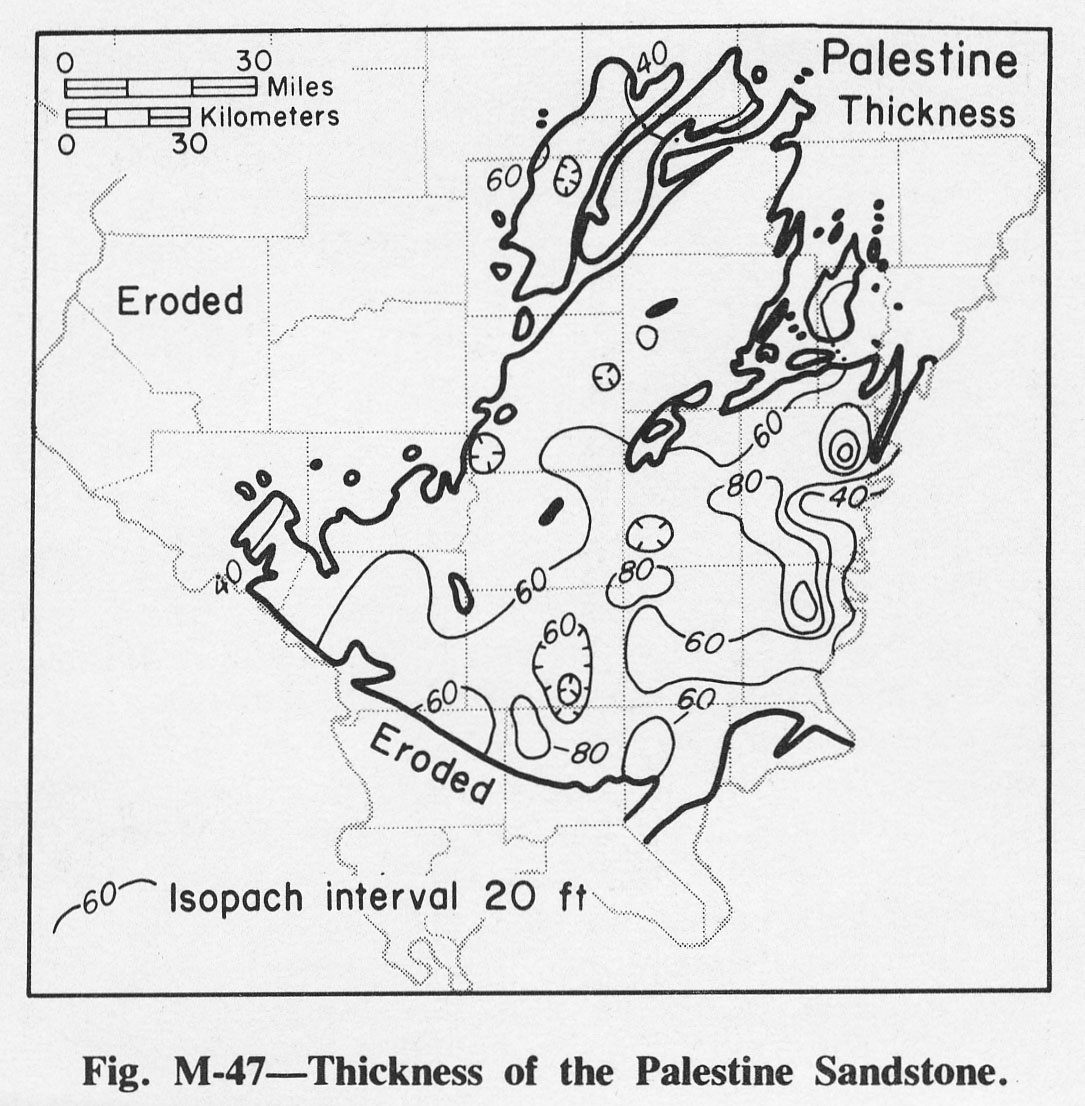
249 KB | Alan.Myers | Fig. M-47 -- Thickness of the Palestine Sandstone. | 1 |
| 14:26, 4 April 2016 | Figure M-46.jpg (file) |  |
239 KB | Alan.Myers | Fig. M-46 -- Thickness of the Menard Limestone. | 1 |
| 14:26, 4 April 2016 | Figure M-45.jpg (file) |  |
234 KB | Alan.Myers | Fig. M-45 -- Thickness of the Waltersburg Sandstone. | 1 |
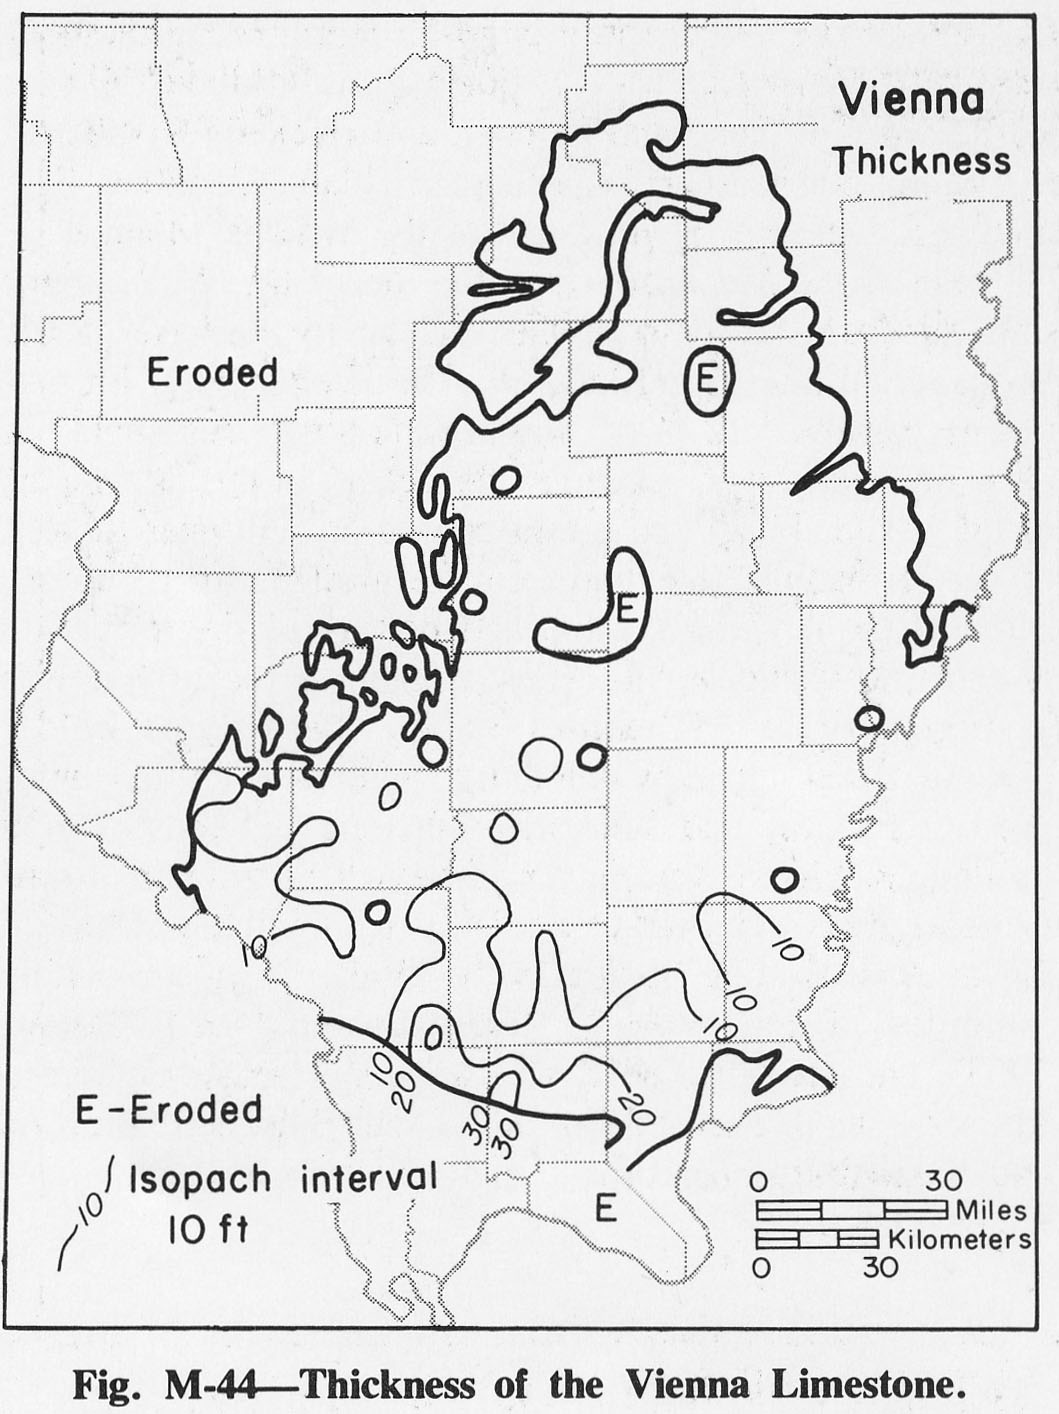
| 14:25, 4 April 2016 | Figure M-44.jpg (file) |  |
220 KB | Alan.Myers | Fig. M-44 -- Thickness of the Vienna Limestone. | 1 |
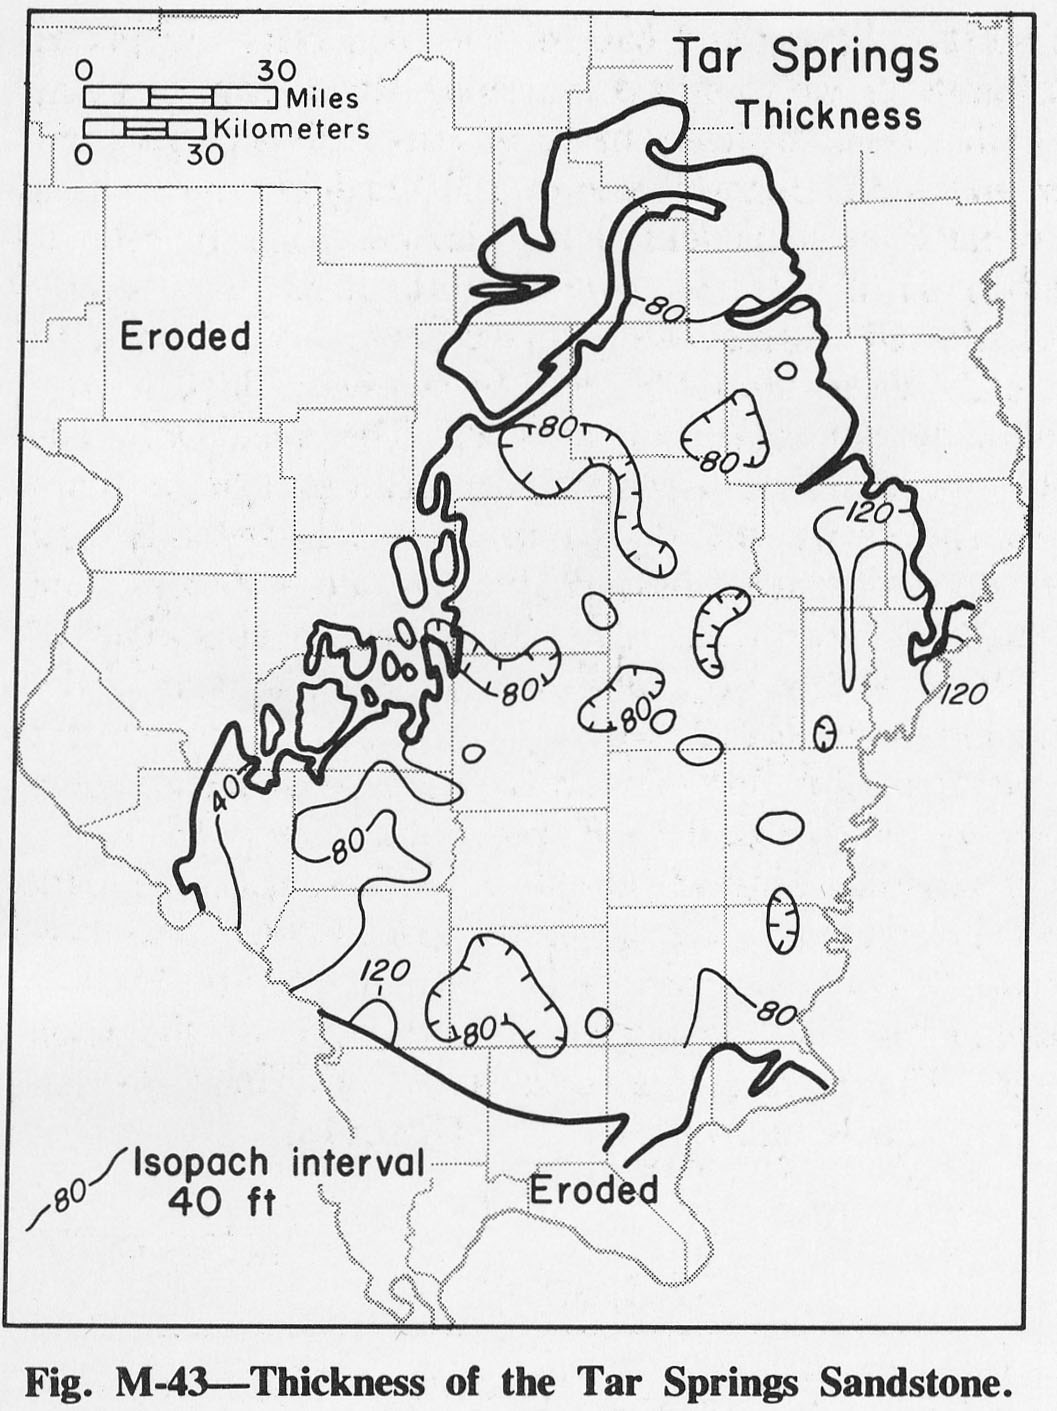
| 14:24, 4 April 2016 | Figure M-43.jpg (file) |  |
228 KB | Alan.Myers | Fig. M-43 -- Thickness of the Tar Springs Sandstone. | 1 |
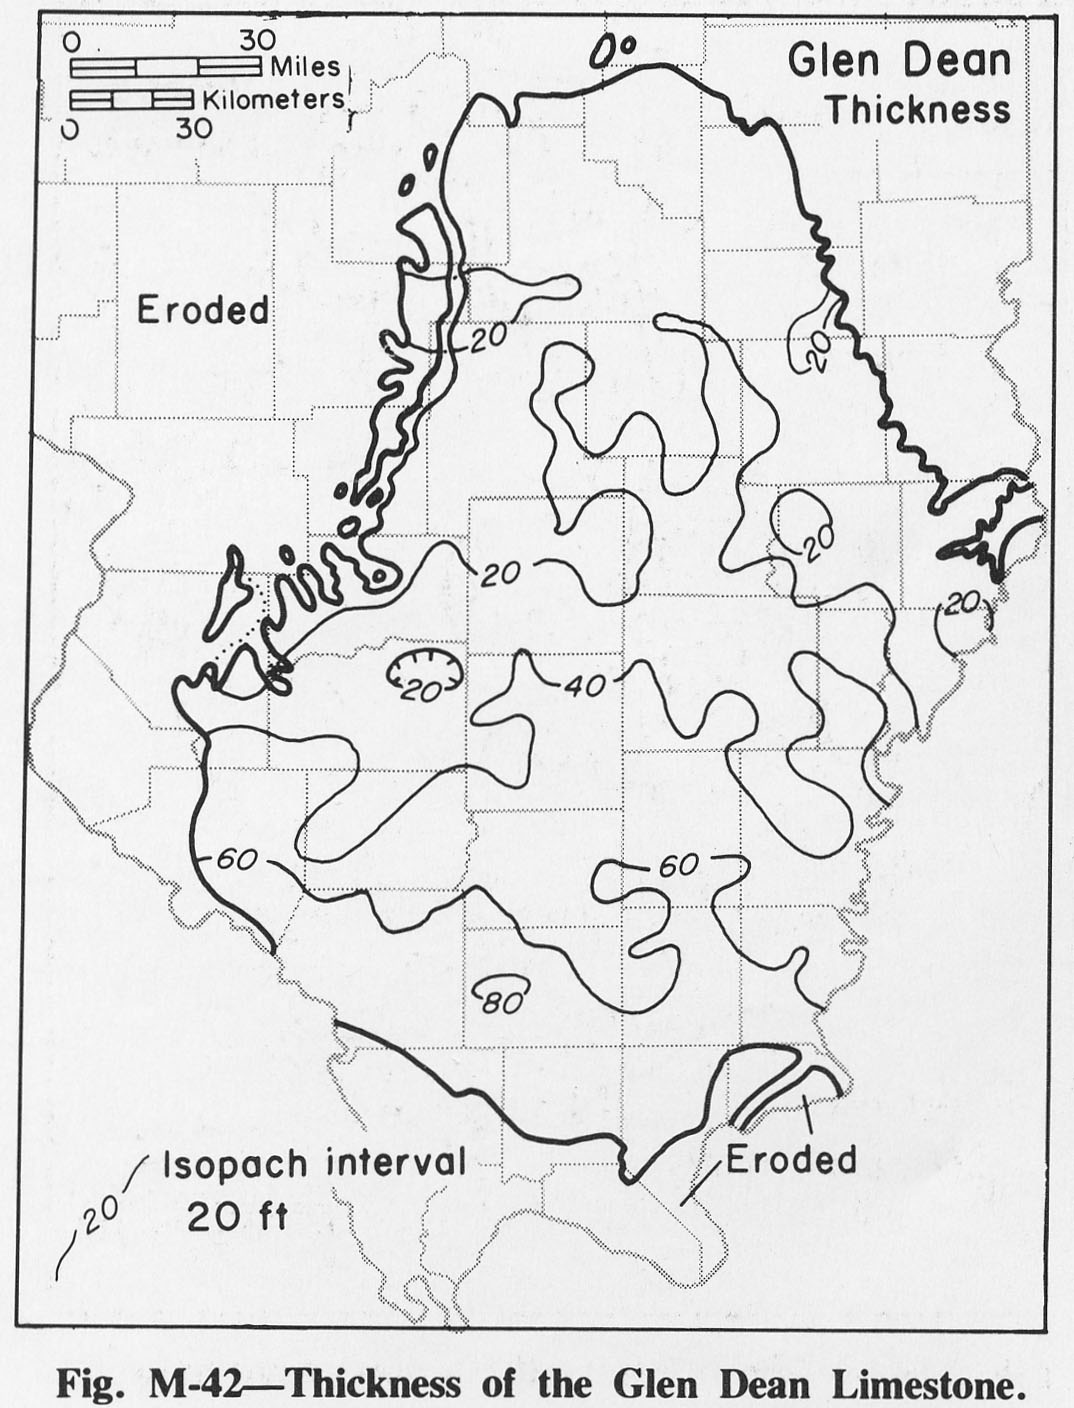
| 14:24, 4 April 2016 | Figure M-42.jpg (file) |  |
226 KB | Alan.Myers | Fig. M-42 -- Thickness of the Glen Dean Limestone. | 1 |
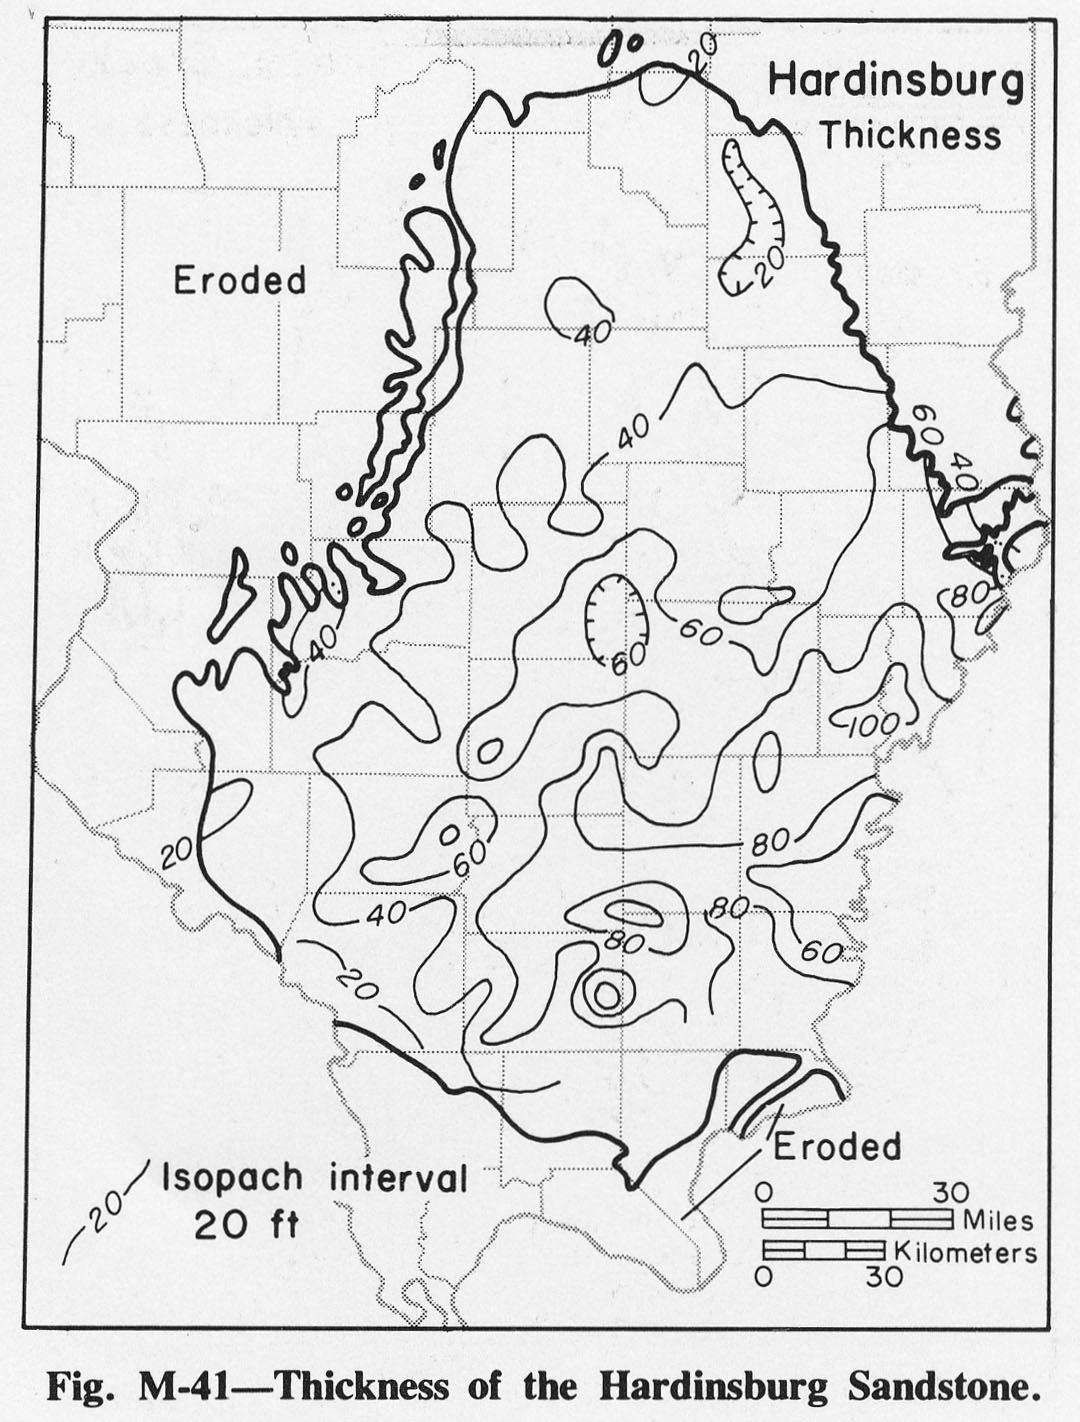
| 14:23, 4 April 2016 | Figure M-41.jpg (file) |  |
249 KB | Alan.Myers | Fig. M-41 -- Thickness of the Hardinsburg Sandstone. | 1 |
| 14:22, 4 April 2016 | Figure M-40.jpg (file) |  |
235 KB | Alan.Myers | Fig. M-40 -- Thickness of the Haney Limestone. | 1 |
| 14:22, 4 April 2016 | Figure M-39.jpg (file) |  |
210 KB | Alan.Myers | Fig. M-39 -- Thickness of the Fraileys Shale. | 1 |
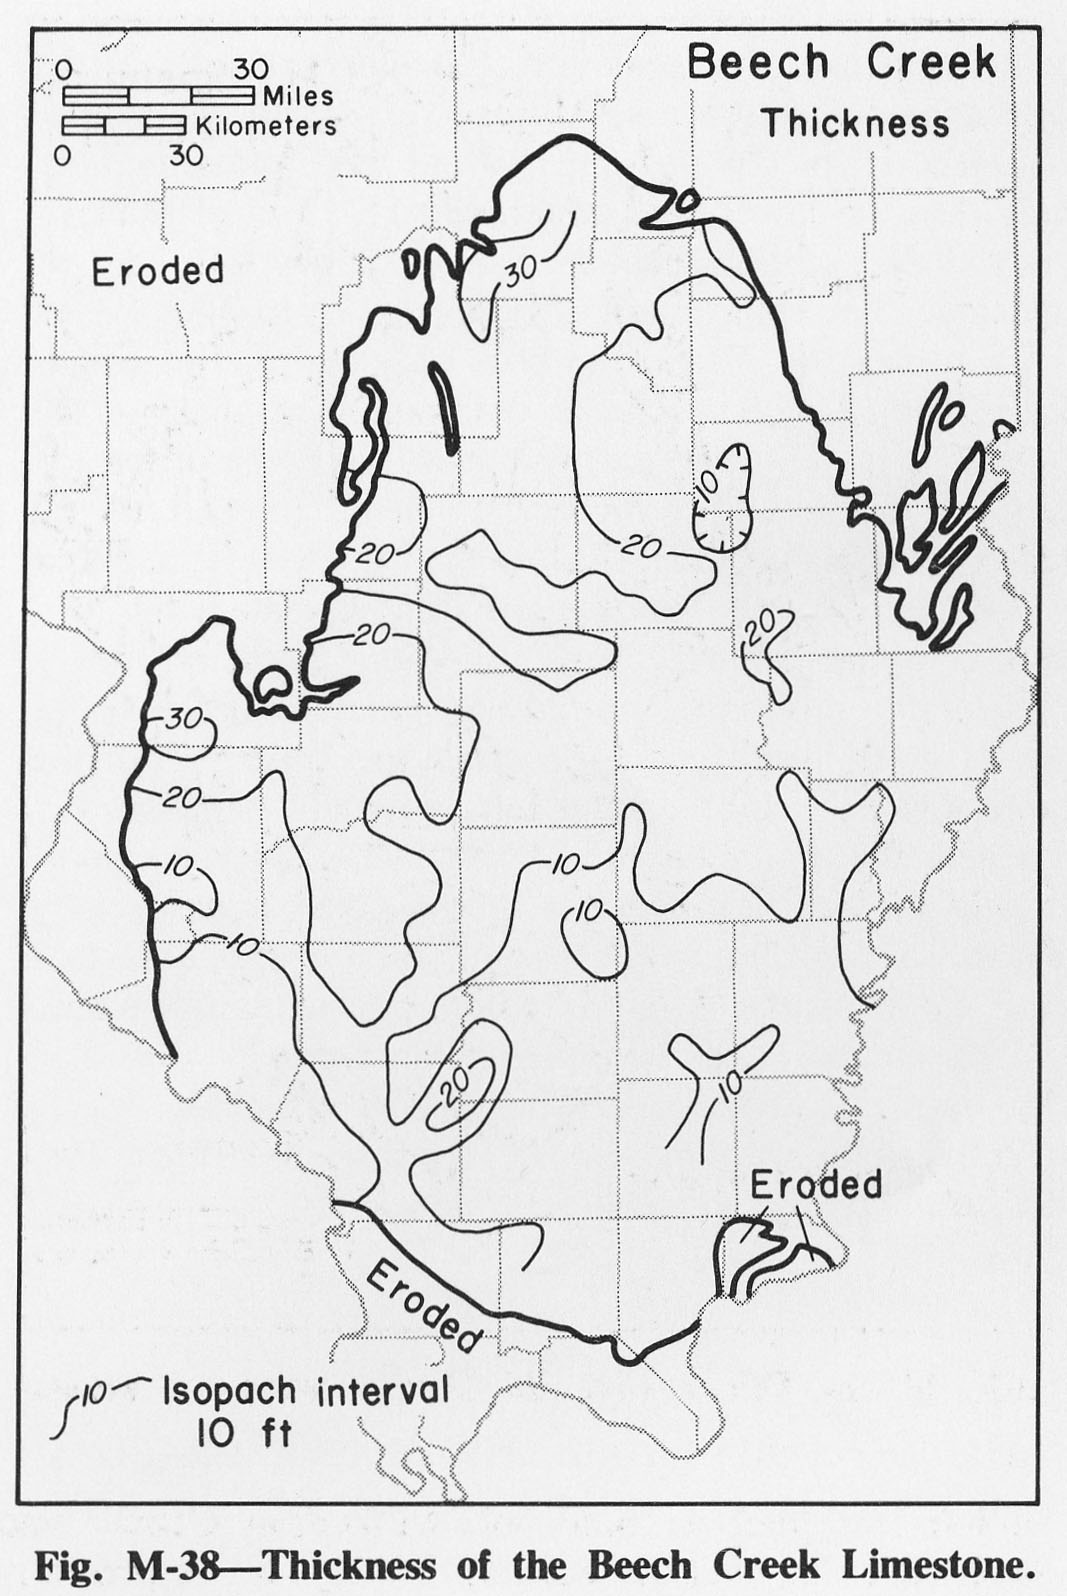
| 14:21, 4 April 2016 | Figure M-38.jpg (file) |  |
245 KB | Alan.Myers | Fig. M-38 -- Thickness of the Beech Creek Limestone. | 1 |
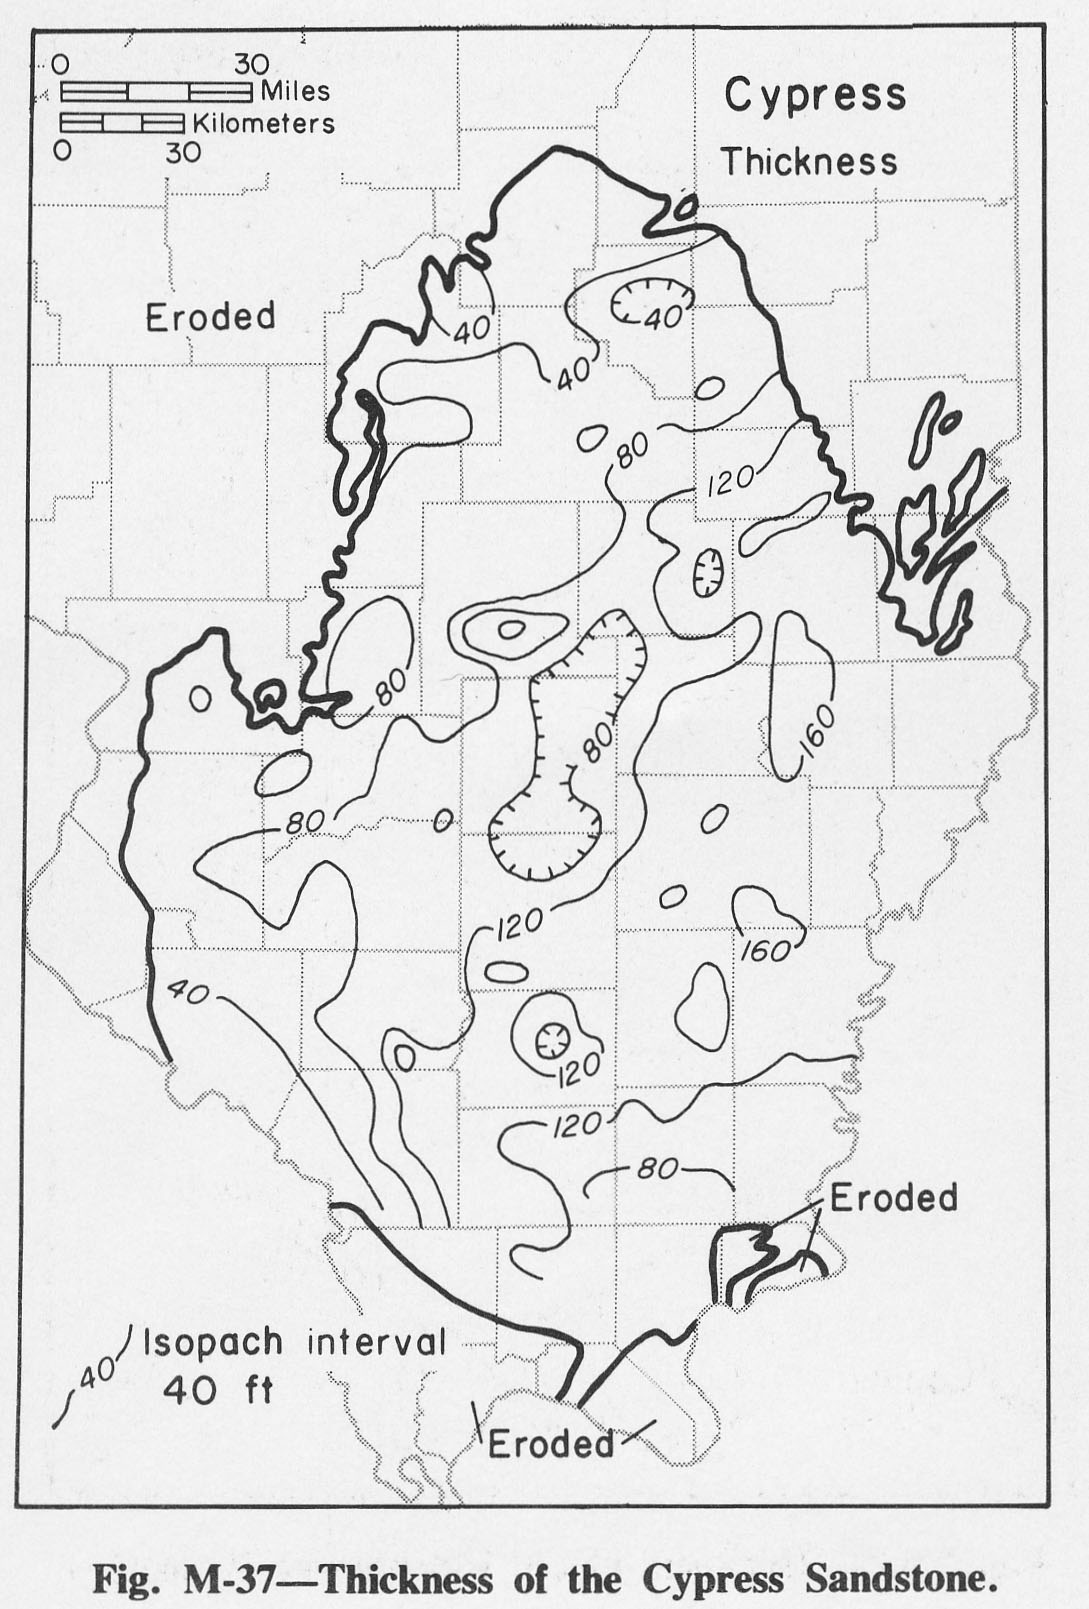
| 14:20, 4 April 2016 | Figure M-37.jpg (file) |  |
256 KB | Alan.Myers | Fig. M-37 -- Thickness of the Cypress Sandstone. | 1 |
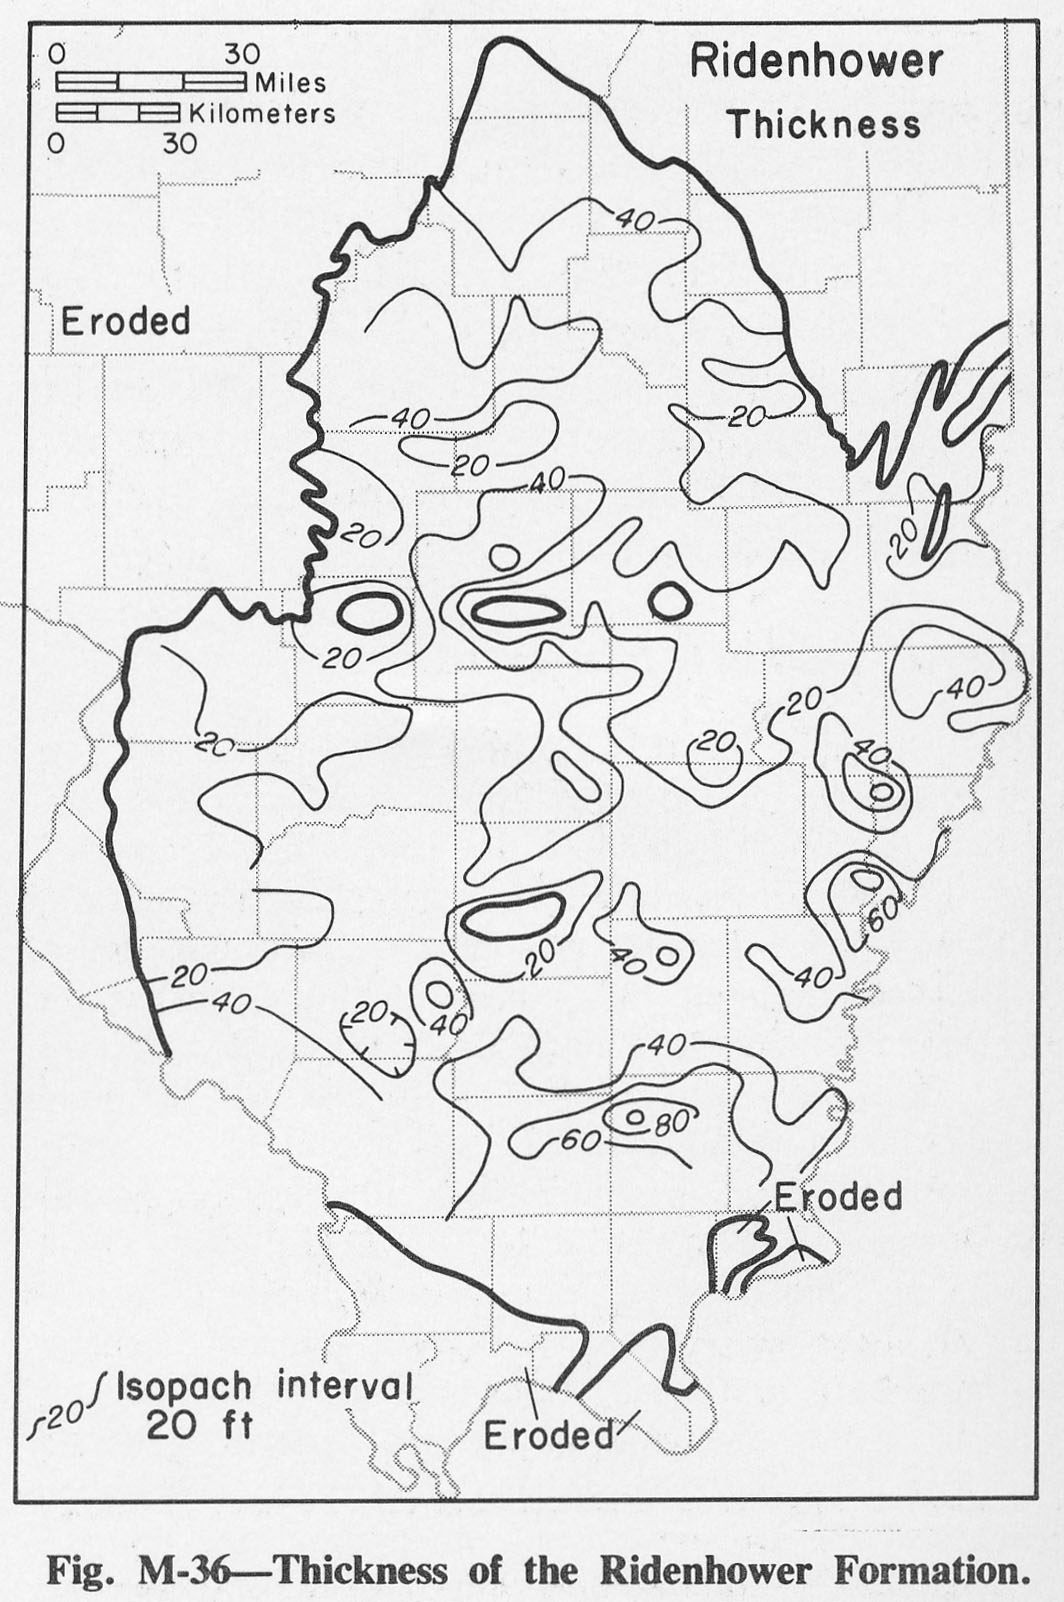
| 14:19, 4 April 2016 | Figure M-36.jpg (file) |  |
264 KB | Alan.Myers | Fig. M-36 -- Thickness of the Ridenhower Formation. | 1 |
| 14:19, 4 April 2016 | Figure M-35.jpg (file) |  |
258 KB | Alan.Myers | Fig. M-35 -- Thickness of the Bethel Sandstone. | 1 |
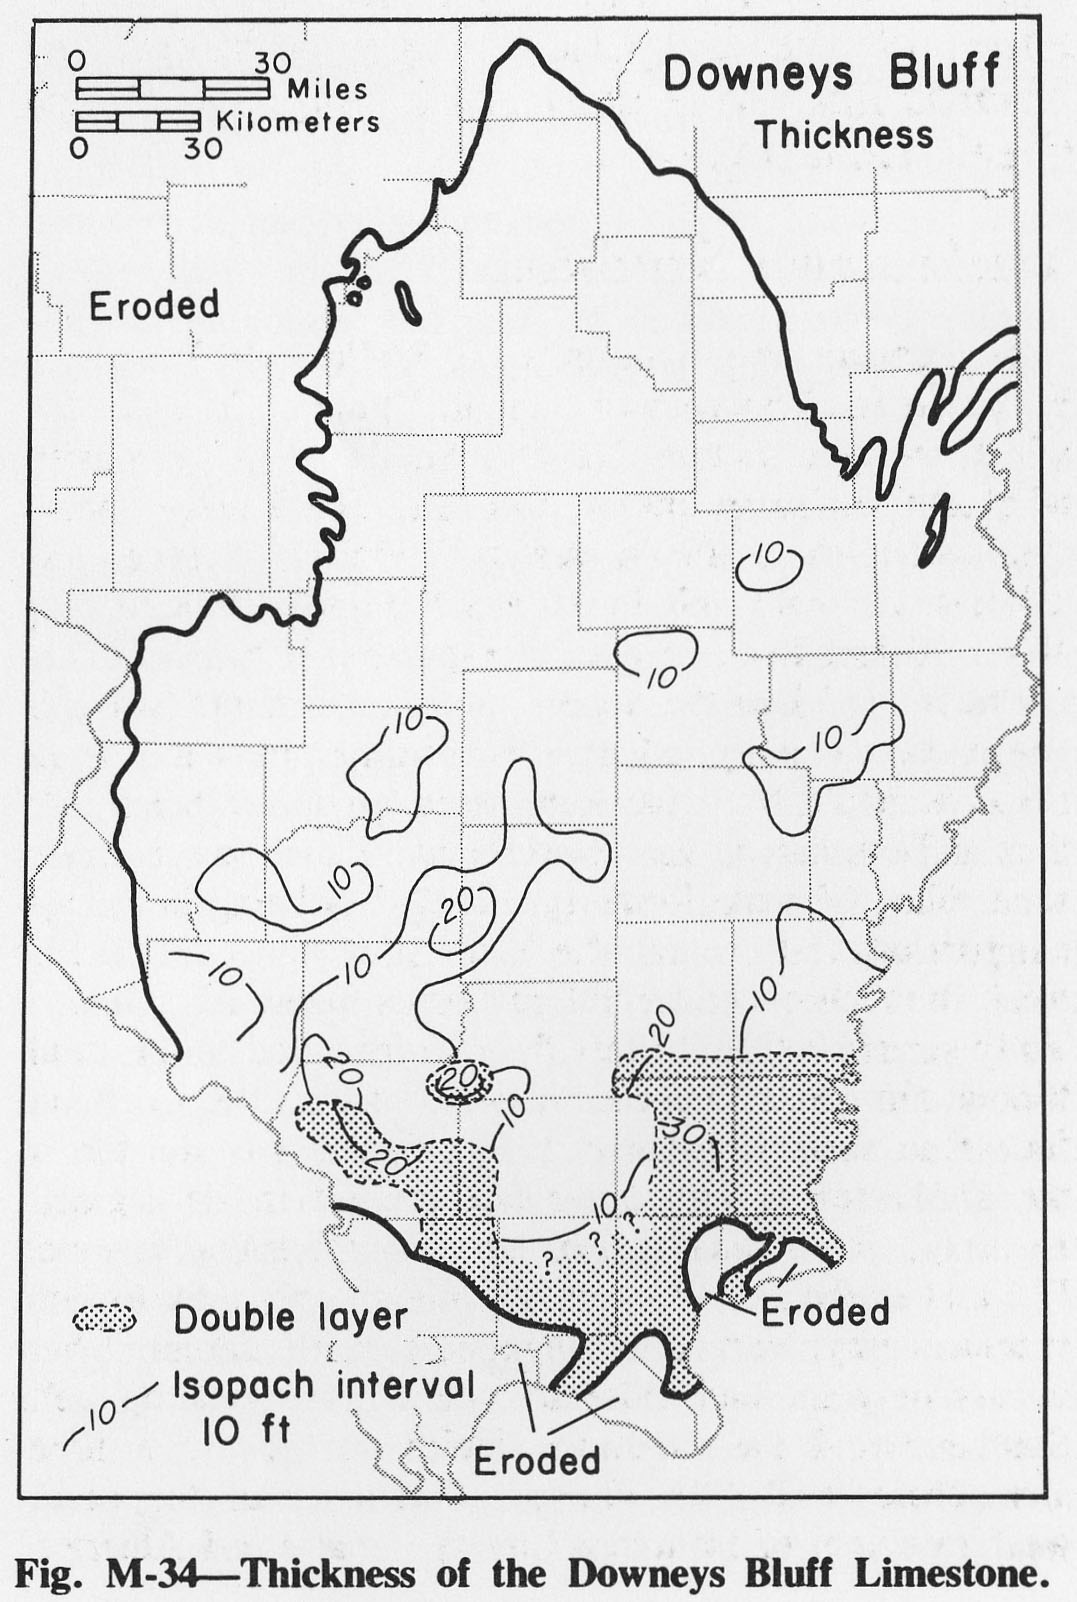
| 14:18, 4 April 2016 | Figure M-34.jpg (file) |  |
267 KB | Alan.Myers | Fig. M-34 -- Thickness of the Downeys Bluff Limestone. | 1 |
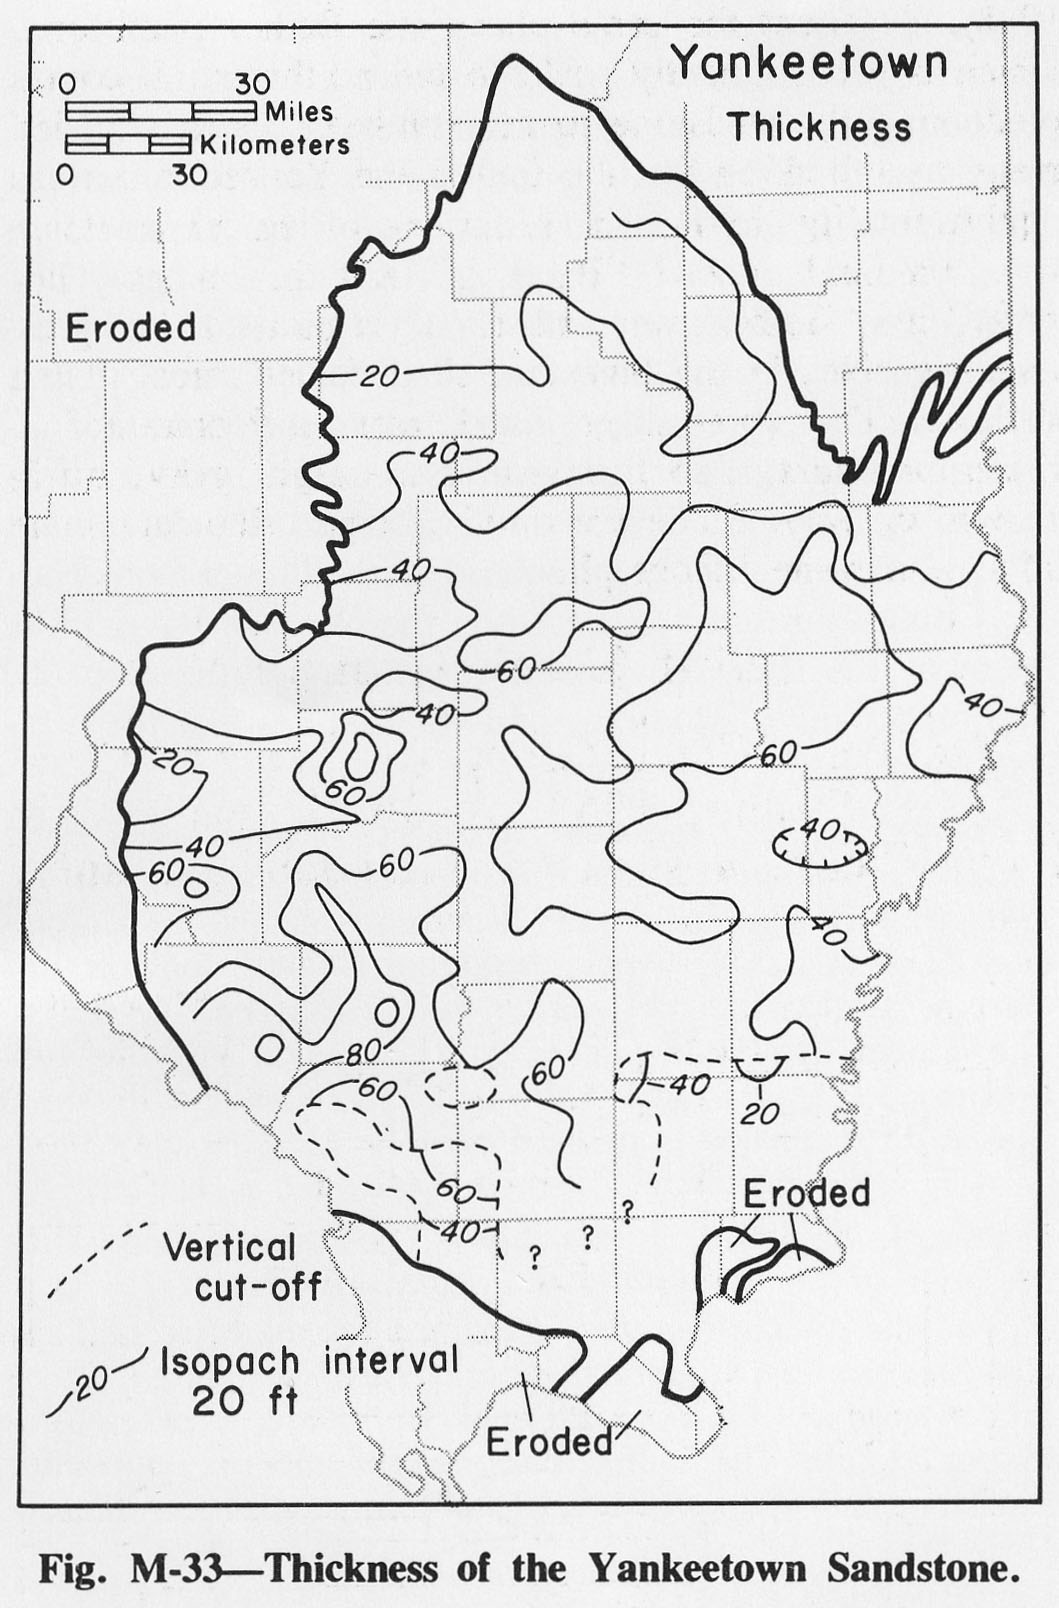
| 14:17, 4 April 2016 | Figure M-33.jpg (file) |  |
261 KB | Alan.Myers | Fig. M-33 -- Thickness of the Yankeetown Sandstone. | 1 |
| 14:17, 4 April 2016 | Figure M-32.jpg (file) |  |
299 KB | Alan.Myers | Fig. M-32 -- Changes in position of the shoreline and the position of the Michigan River during late Valmeyeran and Chesterian times (after Swann, 1963). | 1 |
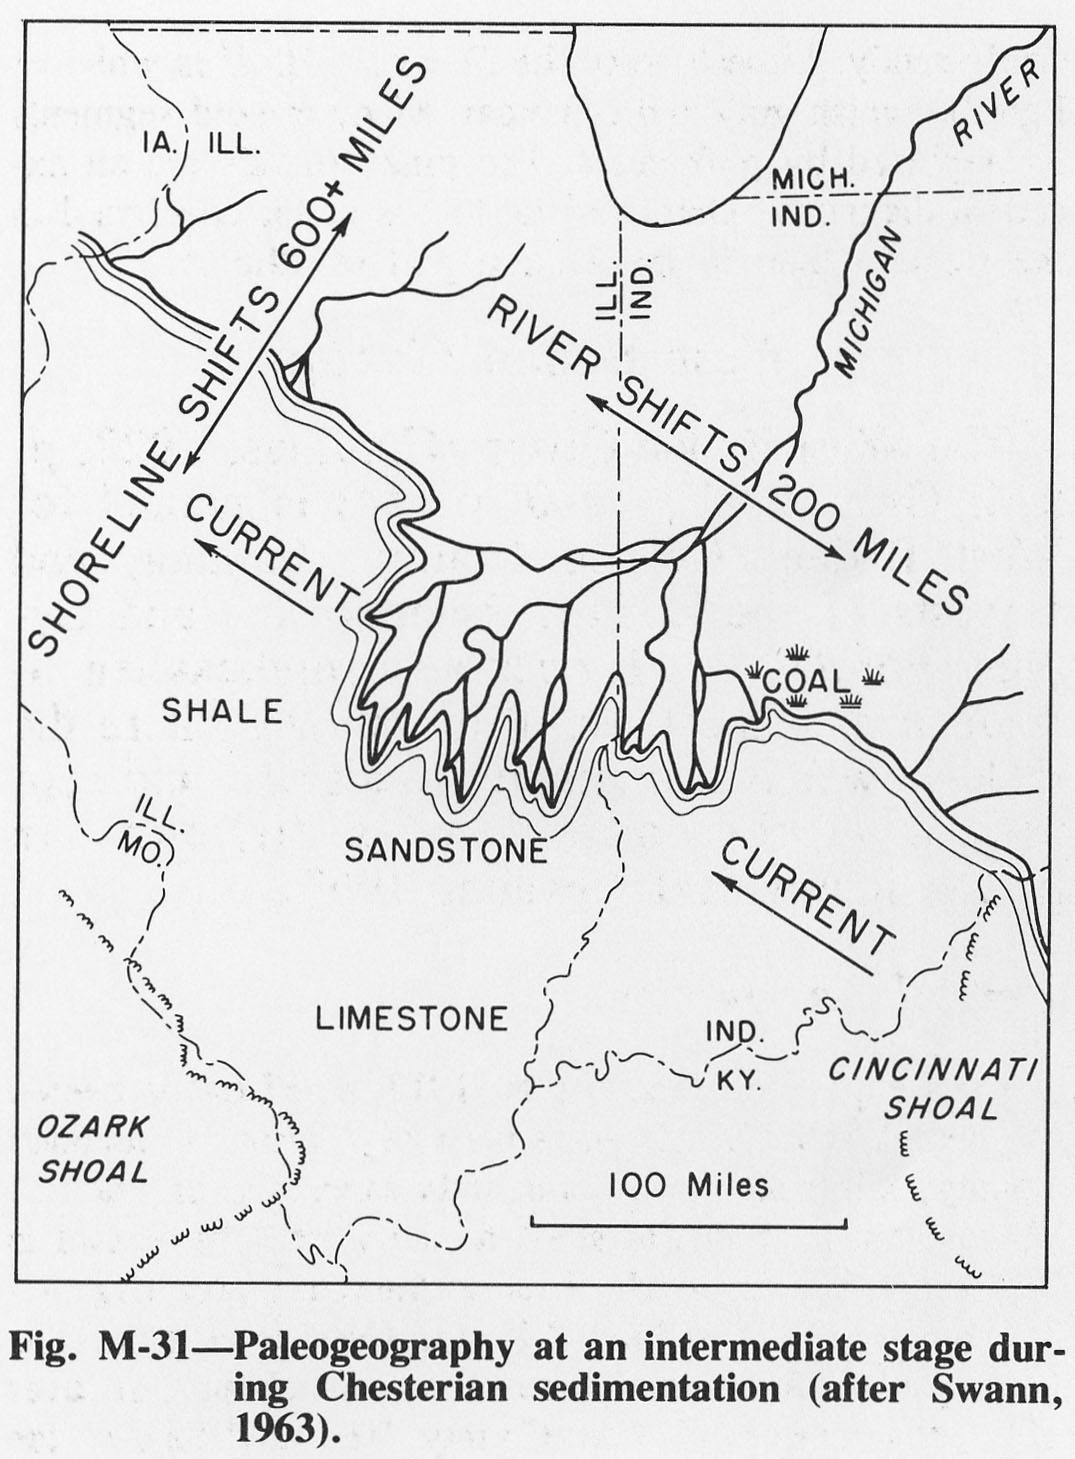
| 14:15, 4 April 2016 | Figure M-31.jpg (file) |  |
219 KB | Alan.Myers | Fig. M-31 -- Paleogeography at an intermediate state during the Chesterian sedimentation (after Swann, 1963). | 1 |
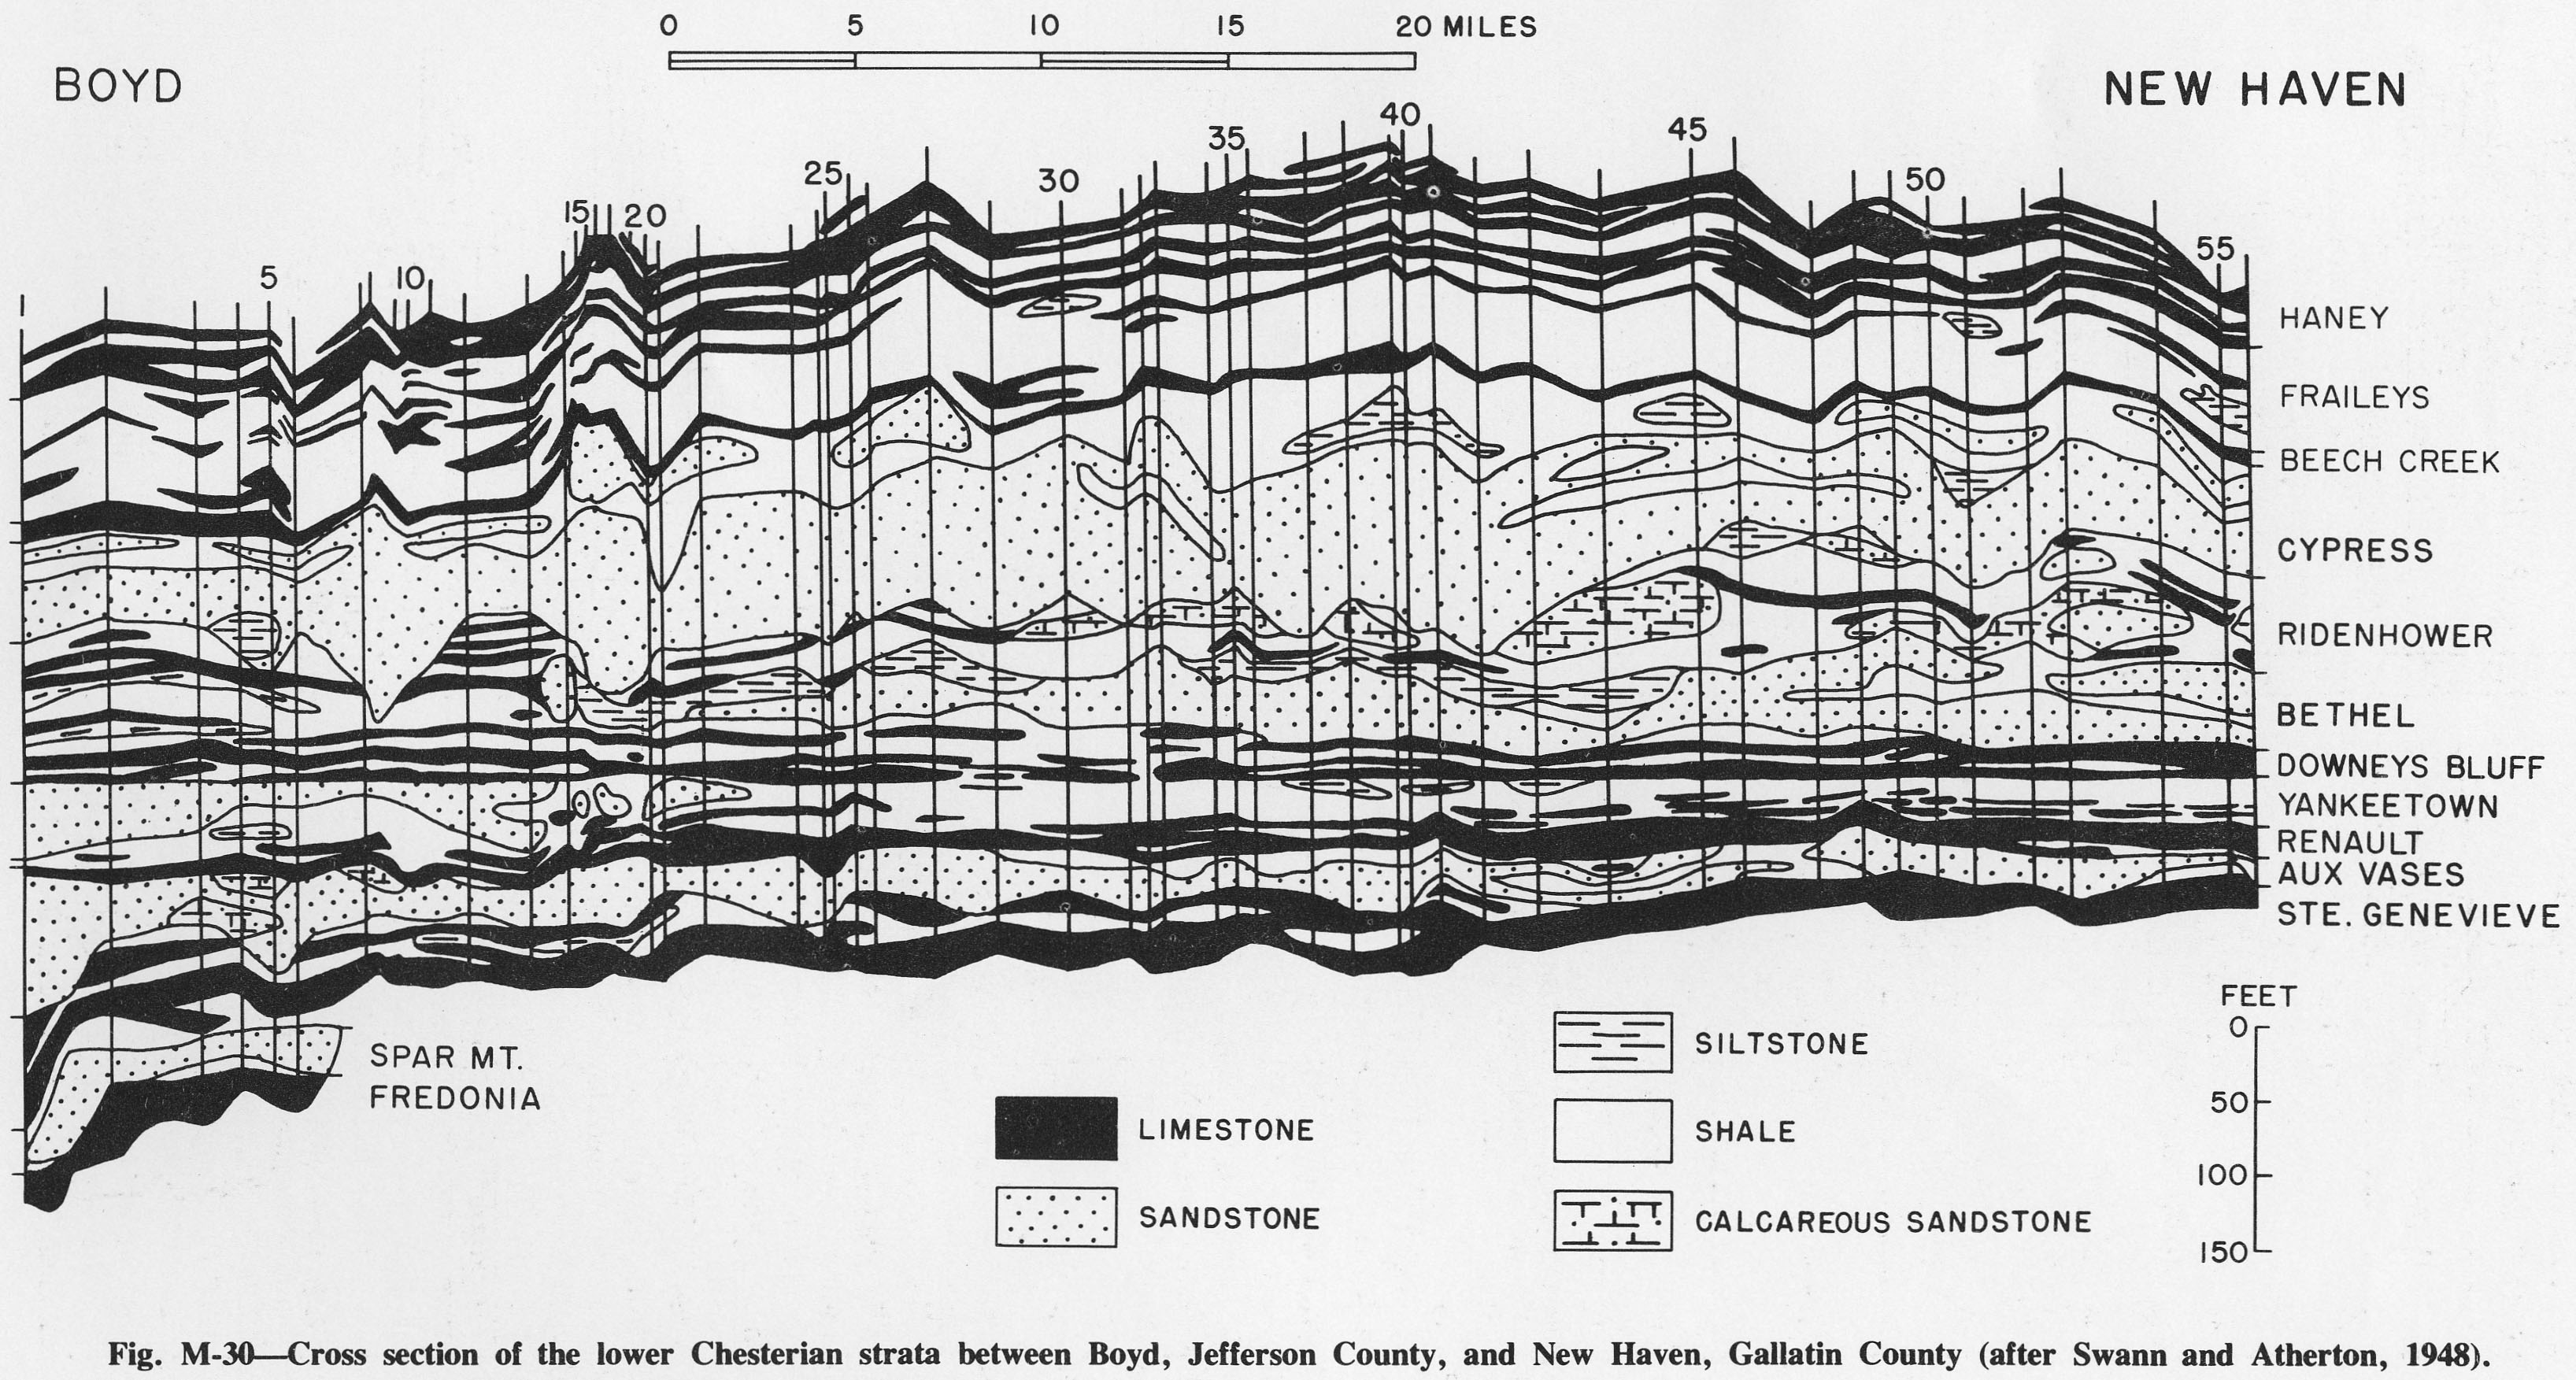
| 14:14, 4 April 2016 | Figure M-30.jpg (file) |  |
891 KB | Alan.Myers | Fig. M-30 -- Cross section of the lower Chesterian strata between Boyd, Jefferson County, and New Haven, Gallatin County (after Swann and Atherton, 1948). | 1 |
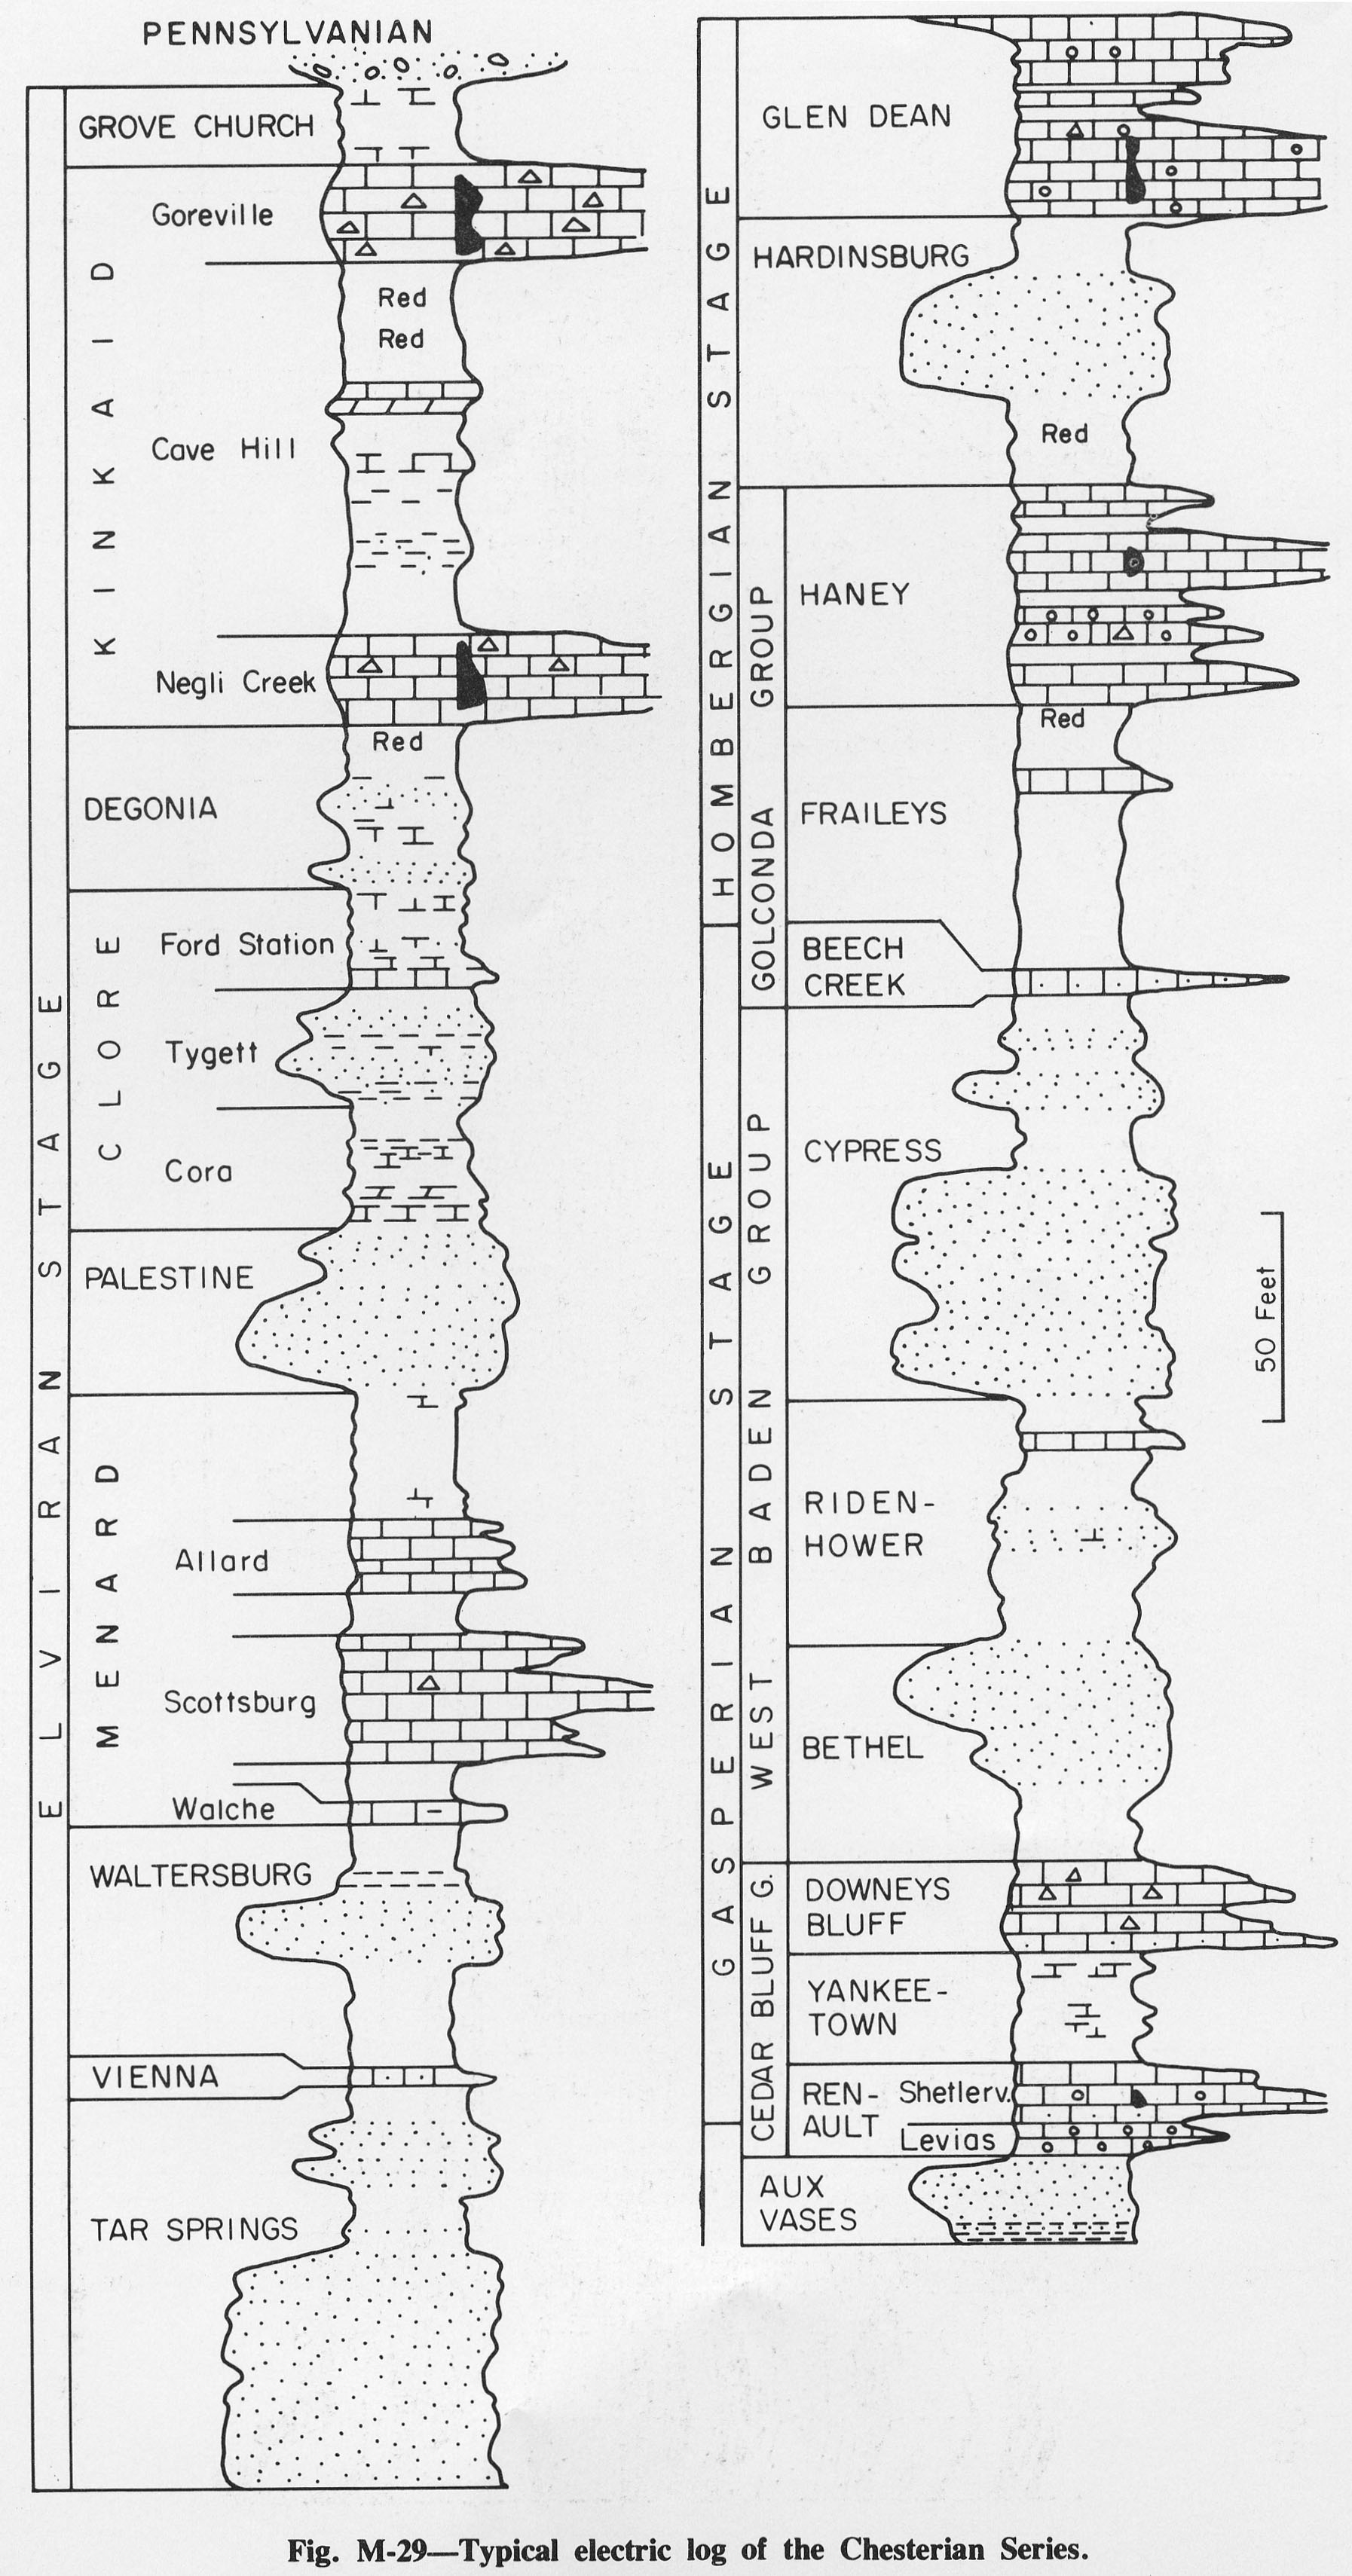
| 14:12, 4 April 2016 | Figure M-29.jpg (file) |  |
687 KB | Alan.Myers | Fig. M-29 -- Typical electric log of the Chesterian Series. | 1 |
| 14:12, 4 April 2016 | Figure M-28.jpg (file) |  |
718 KB | Alan.Myers | Fig. M-28 -- Development of the classification of the Chesterian Series in southwestern Illinois -- the Chester District (after Swann, 1963). | 1 |
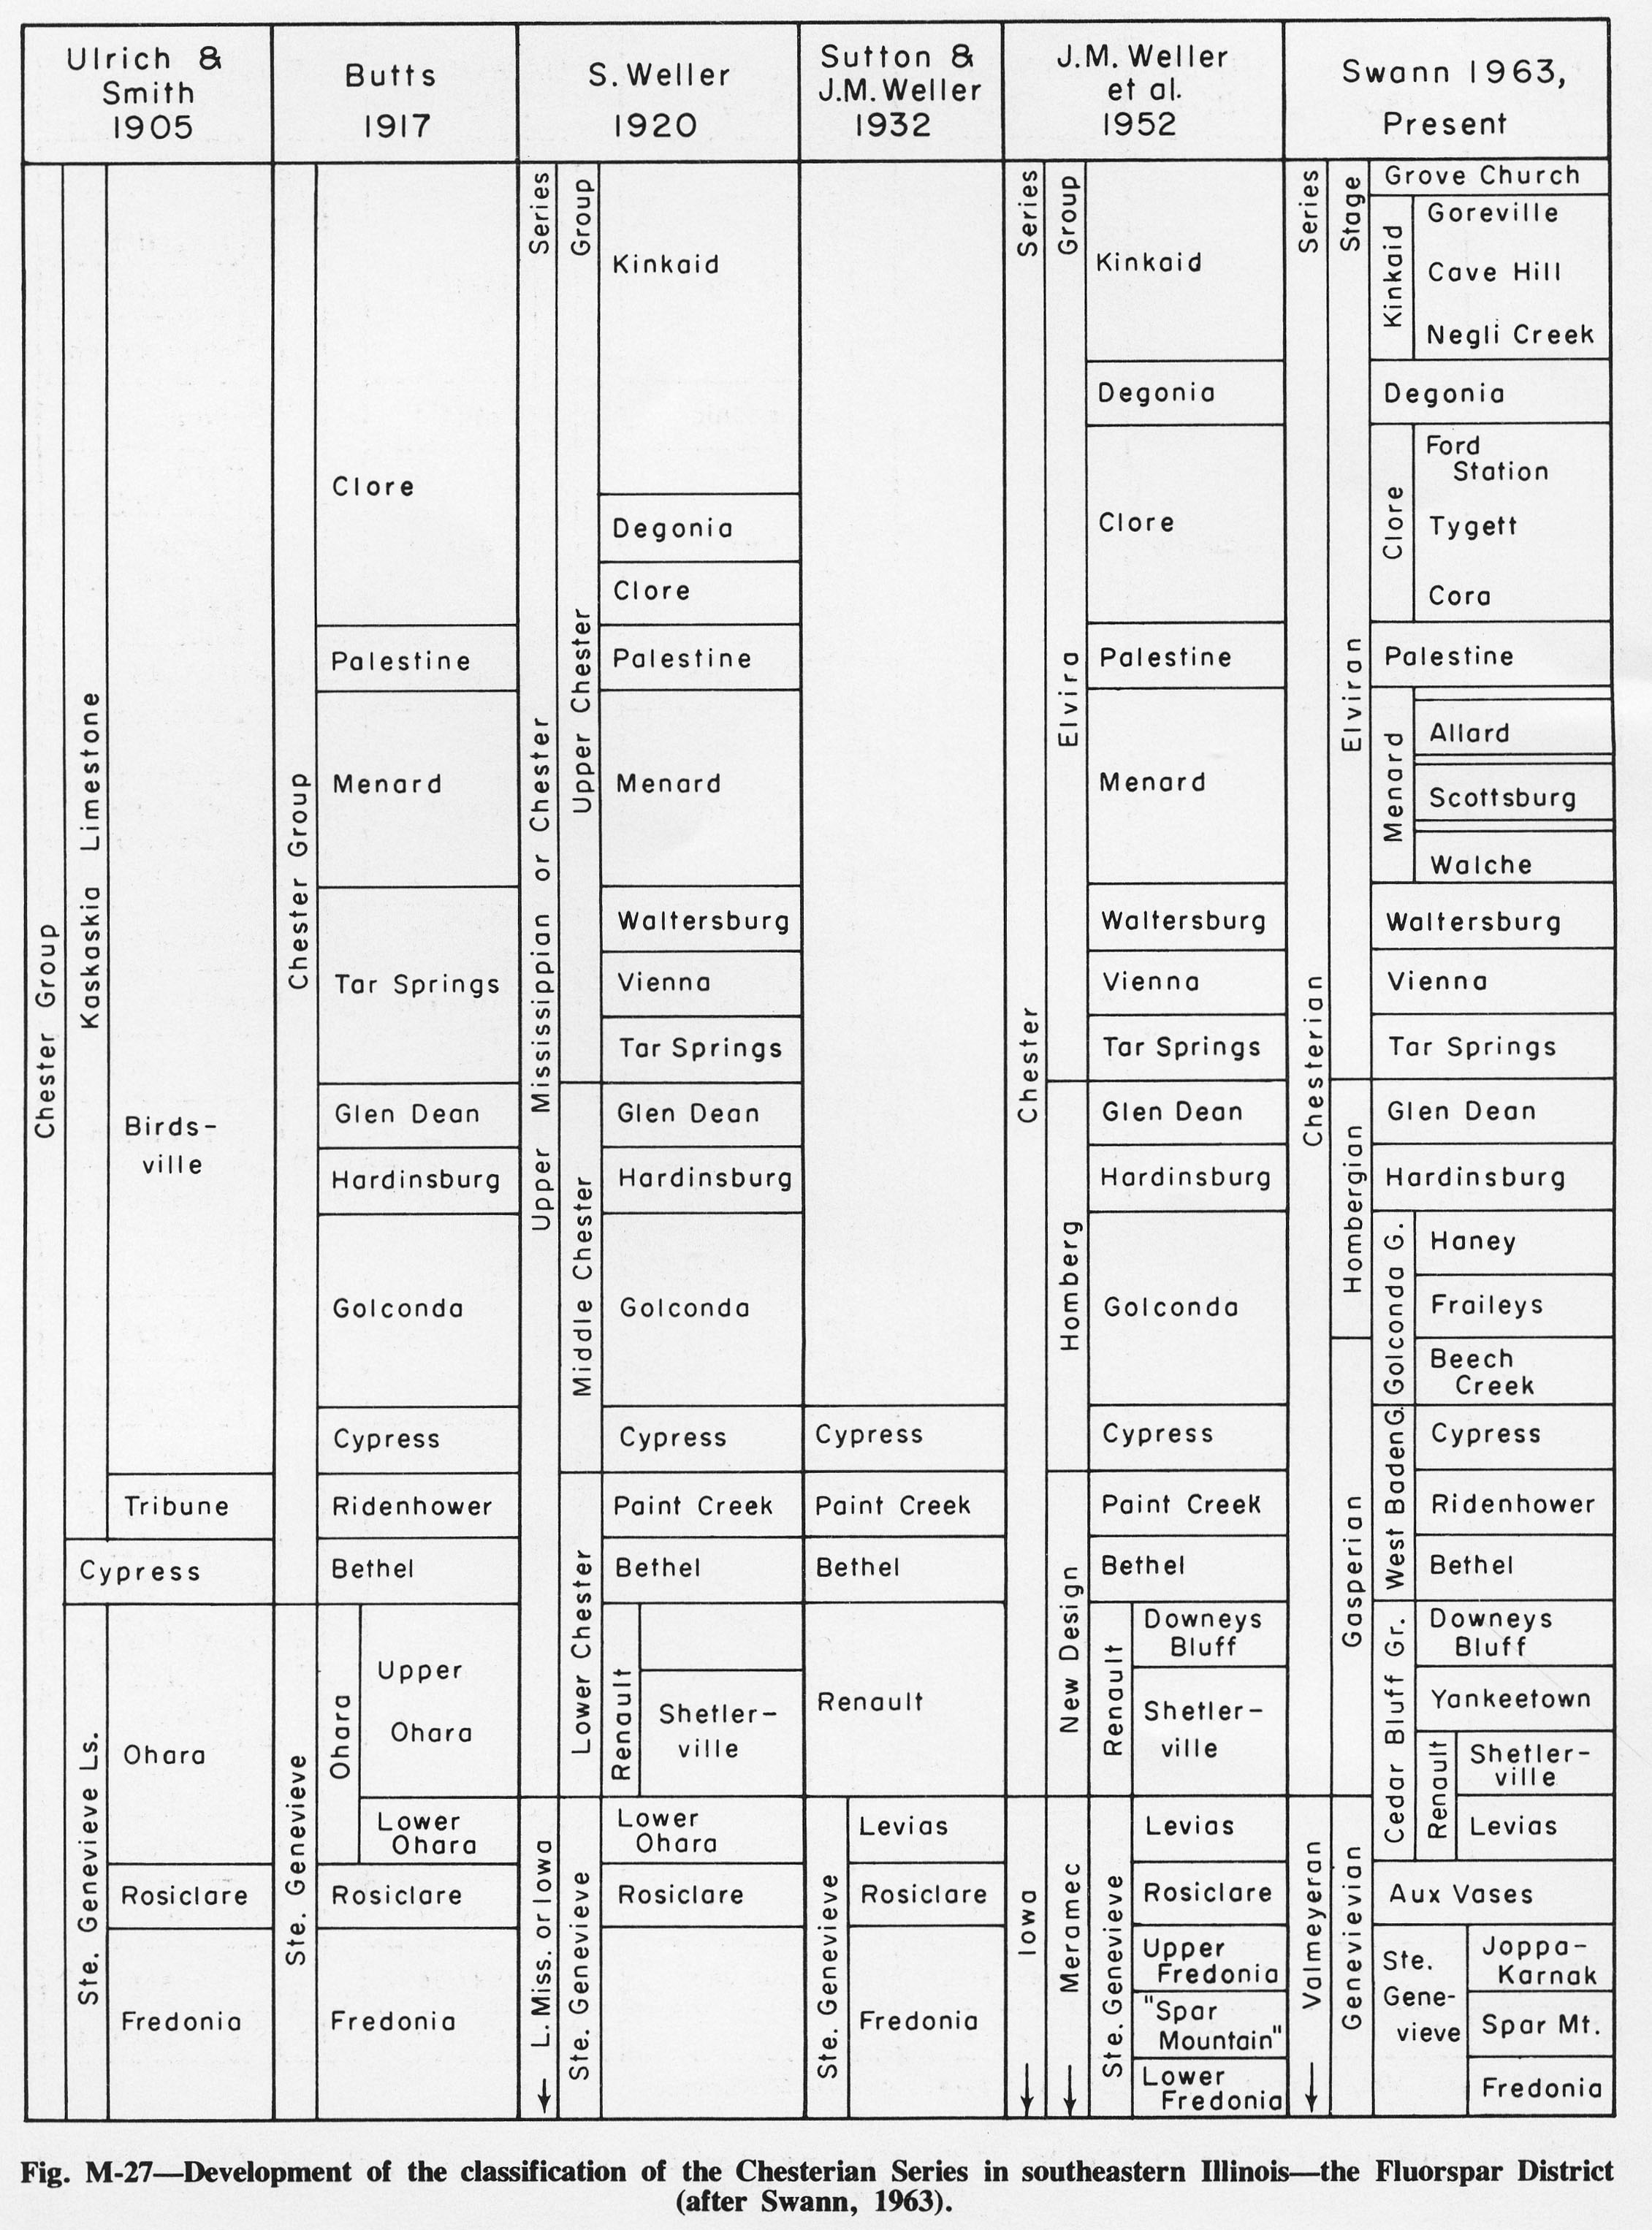
| 14:10, 4 April 2016 | Figure M-27.jpg (file) |  |
848 KB | Alan.Myers | Fig. M-27 -- Development of the classification of the Chesterian Series in southeastern Illinois -- the Fluorspar District (after Swann, 1963). | 1 |
| 14:08, 4 April 2016 | Figure M-26.jpg (file) |  |
923 KB | Alan.Myers | Fig. M-26 -- Thickness of the Chesterian Series. | 1 |
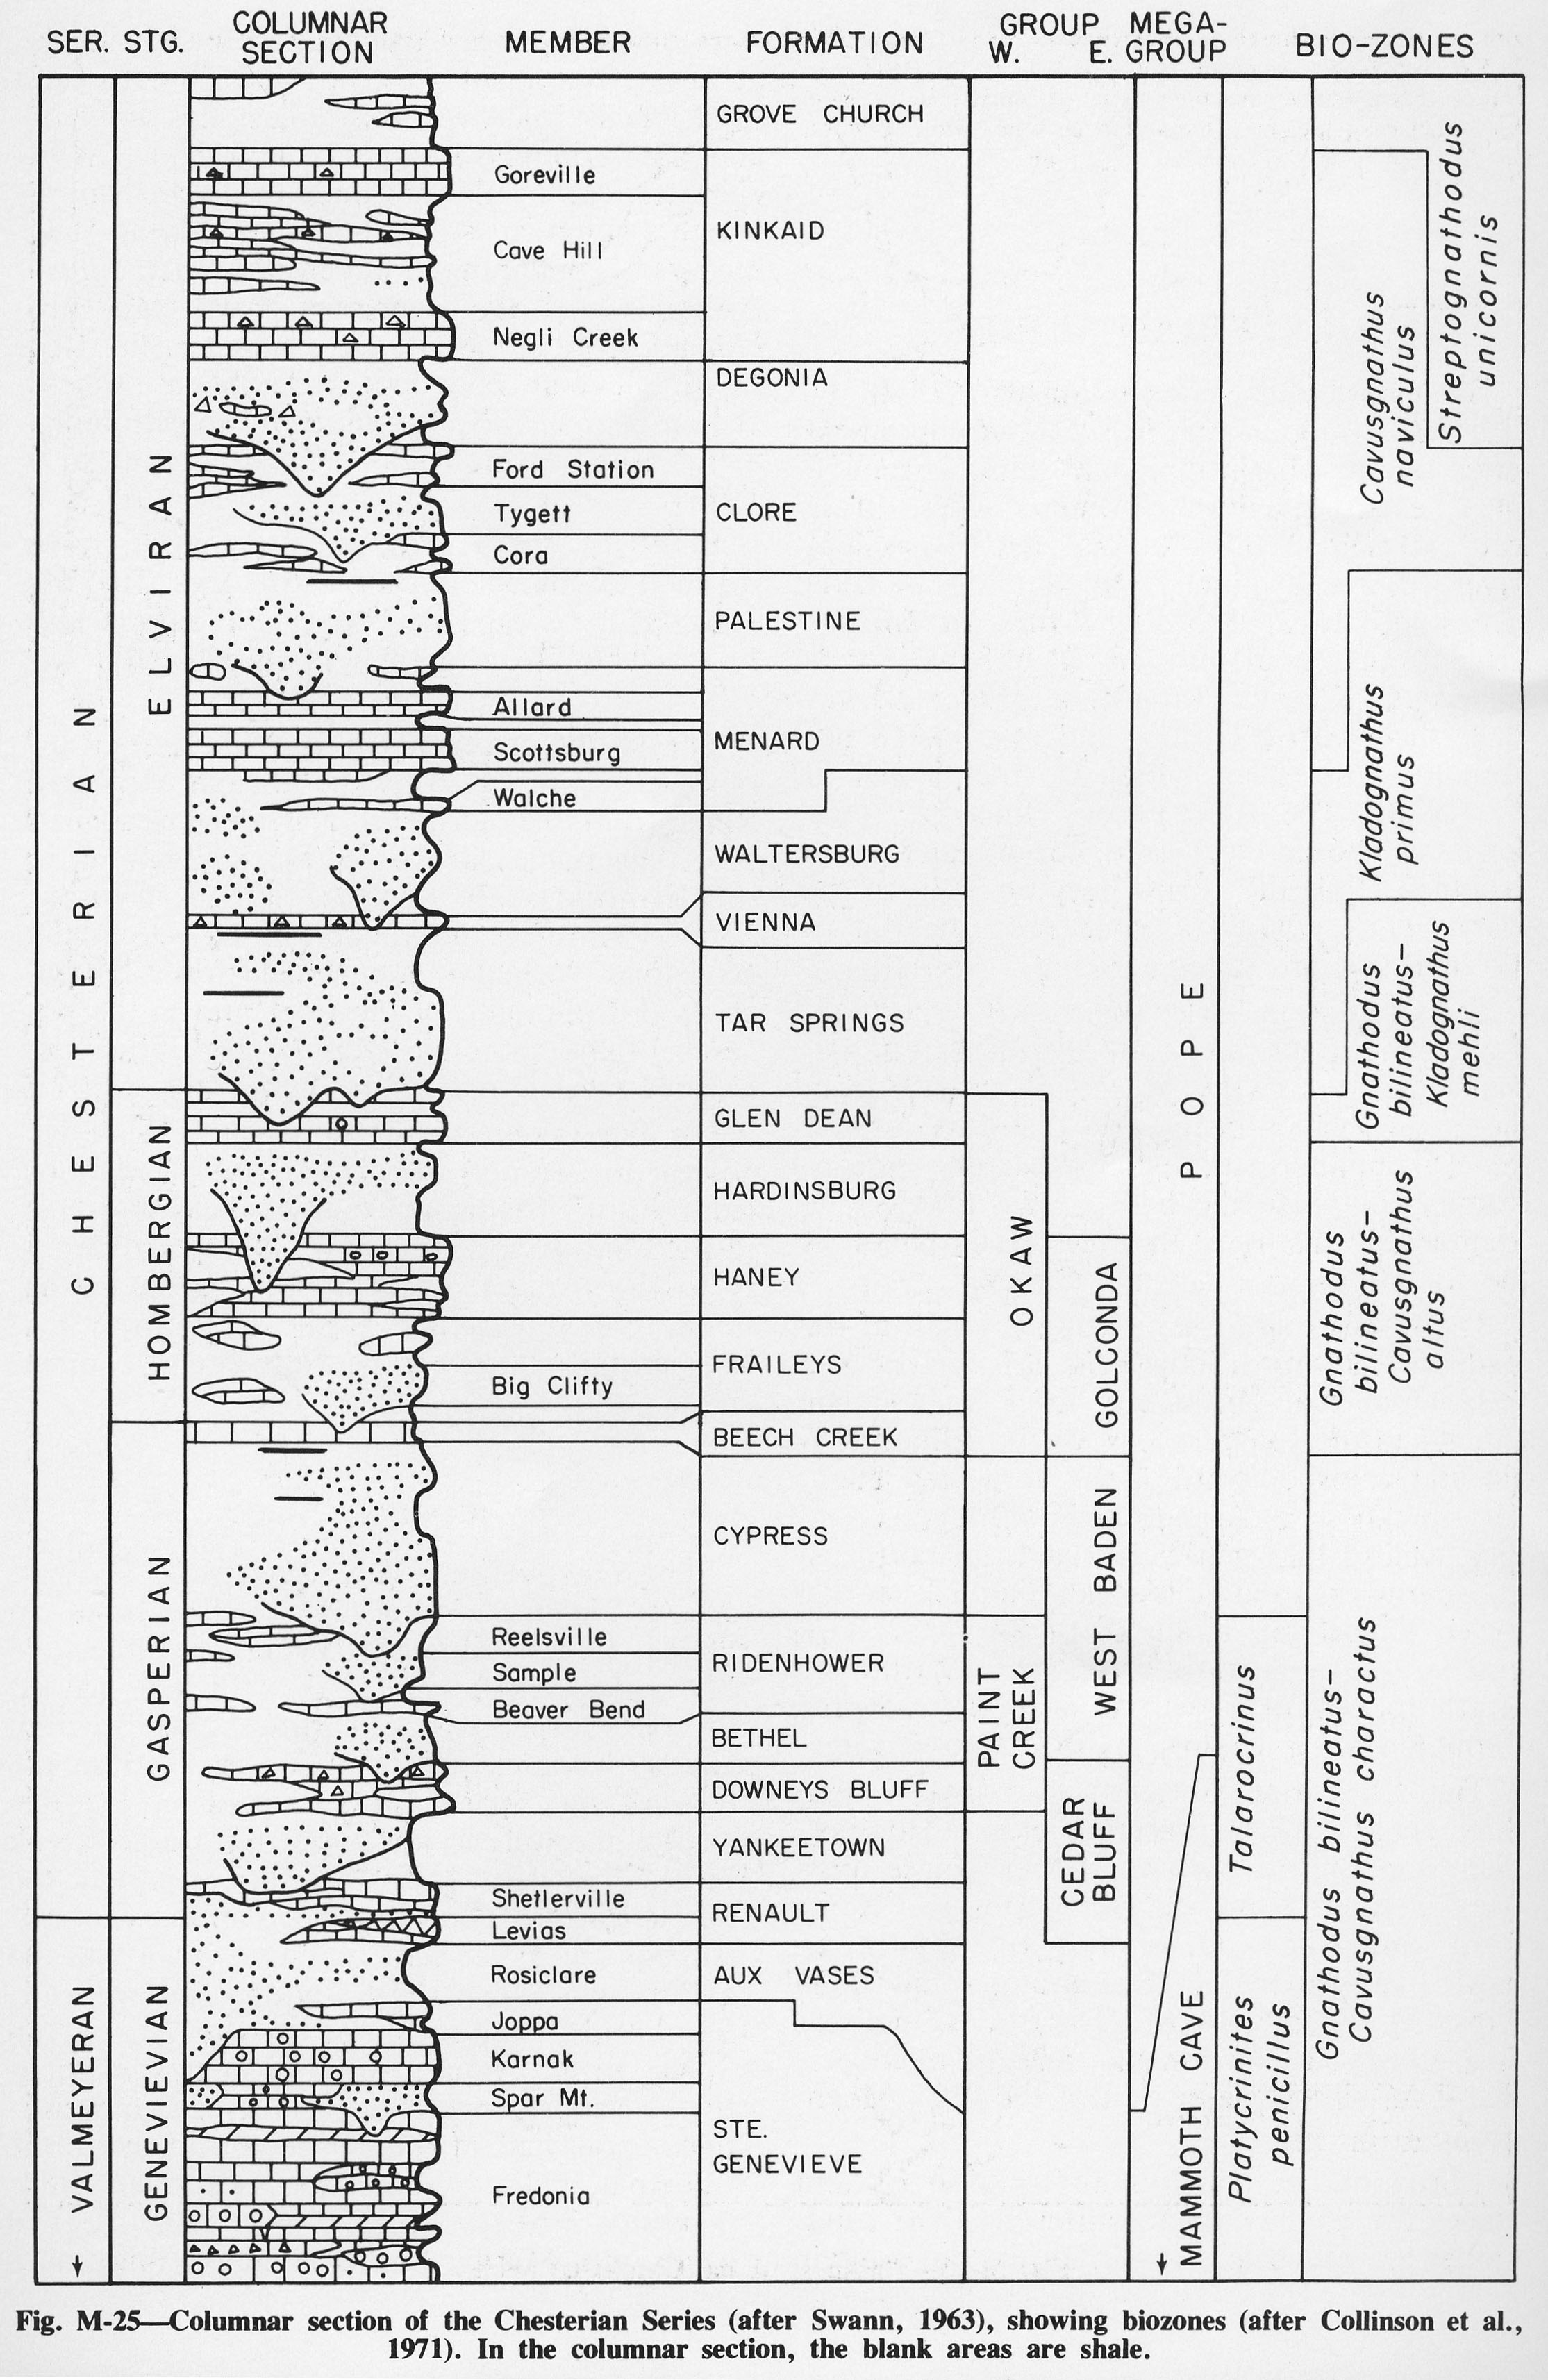
| 14:08, 4 April 2016 | Figure M-25.jpg (file) |  |
930 KB | Alan.Myers | Fig. M-25 -- Columnar section of the Chesterian Series (after Swan, 1963), showing biozones (after Collinson et al., 1971). In the columnar section, the blank areas are shale. | 1 |
| 14:06, 4 April 2016 | Figure M-24.jpg (file) |  |
233 KB | Alan.Myers | Fig. M-24 -- Thickness of the Renault Limestone. | 1 |
| 14:05, 4 April 2016 | Figure M-23.jpg (file) |  |
386 KB | Alan.Myers | Fig. M-23 -- Thickness of the Aux Vases Sandstone. | 1 |
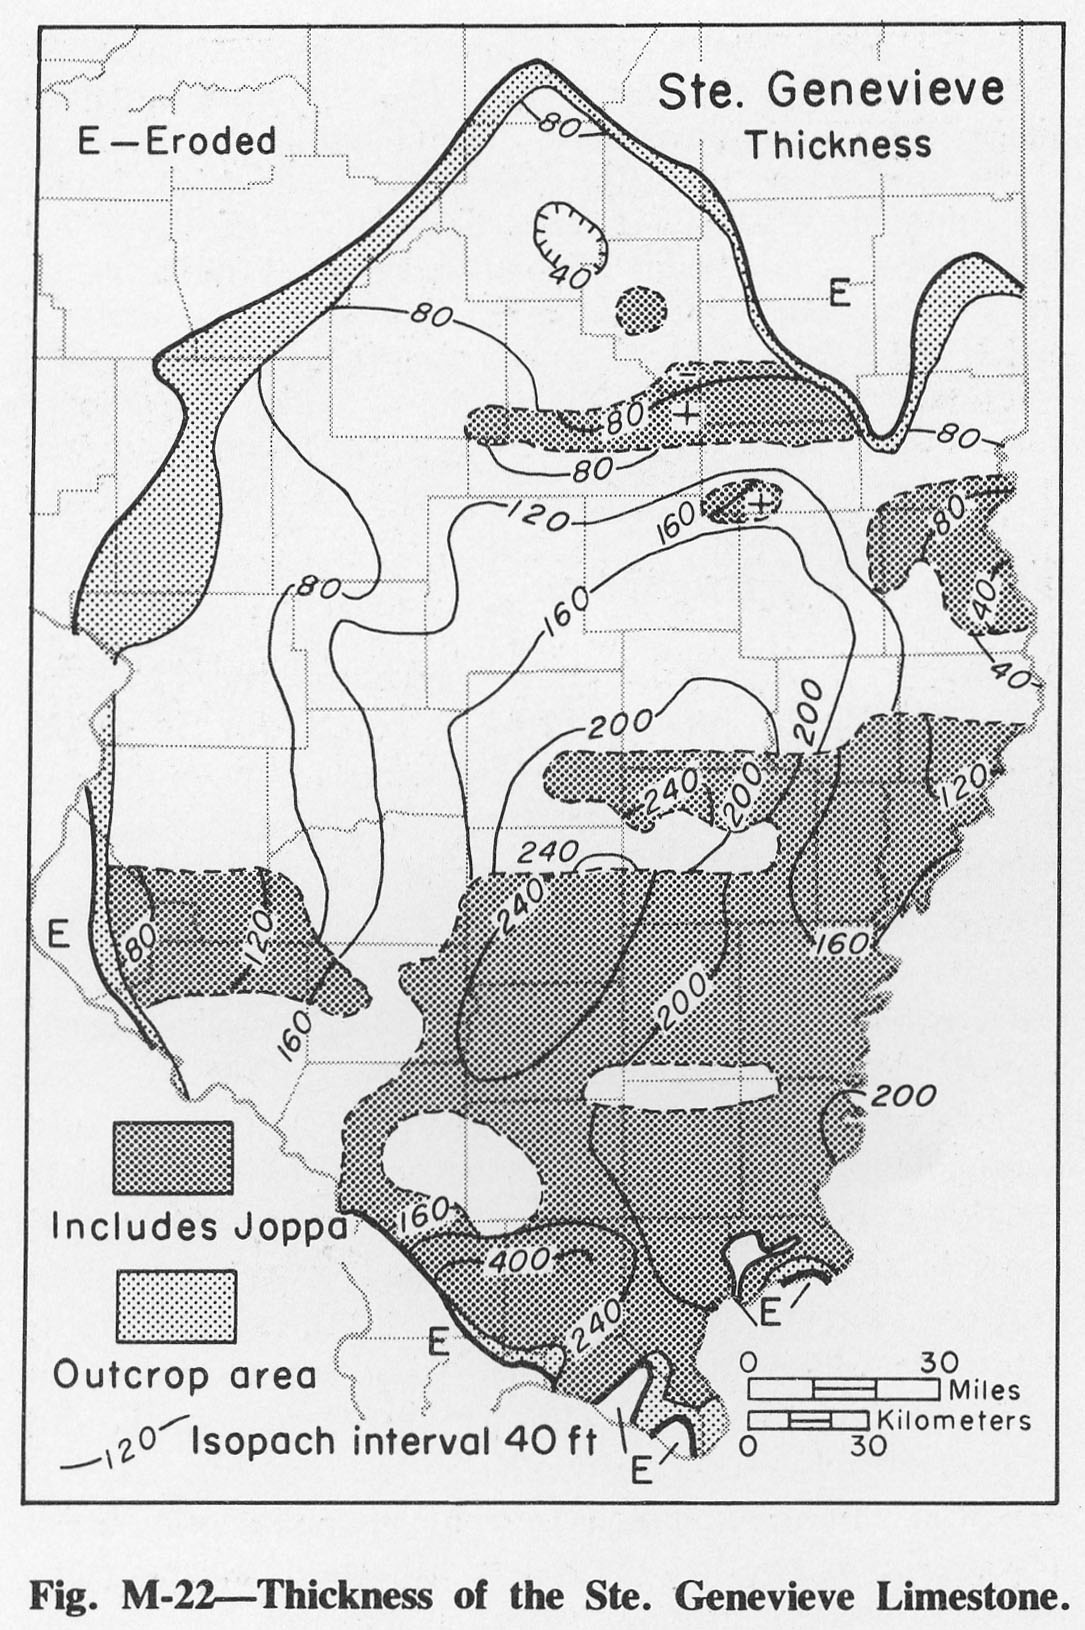
| 14:05, 4 April 2016 | Figure M-22.jpg (file) |  |
378 KB | Alan.Myers | Fig. M-22 -- Thickness of the Ste. Genevieve Limestone. | 1 |
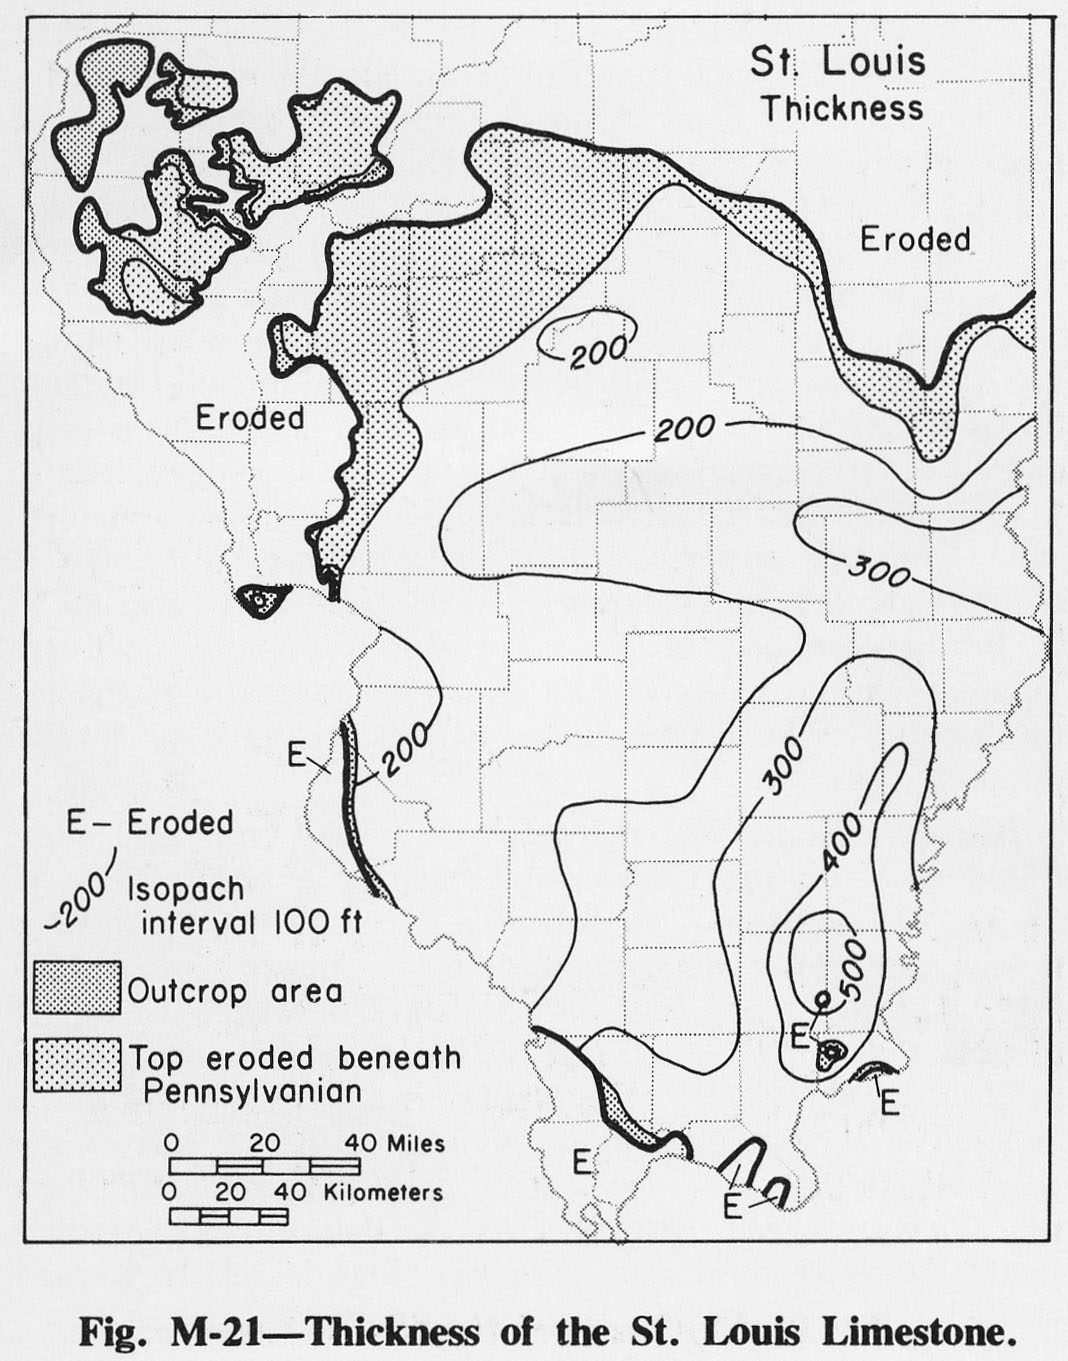
| 14:03, 4 April 2016 | Figure M-21.jpg (file) |  |
253 KB | Alan.Myers | Fig. M-21 -- THickness of the St. Louis Limestone. | 1 |
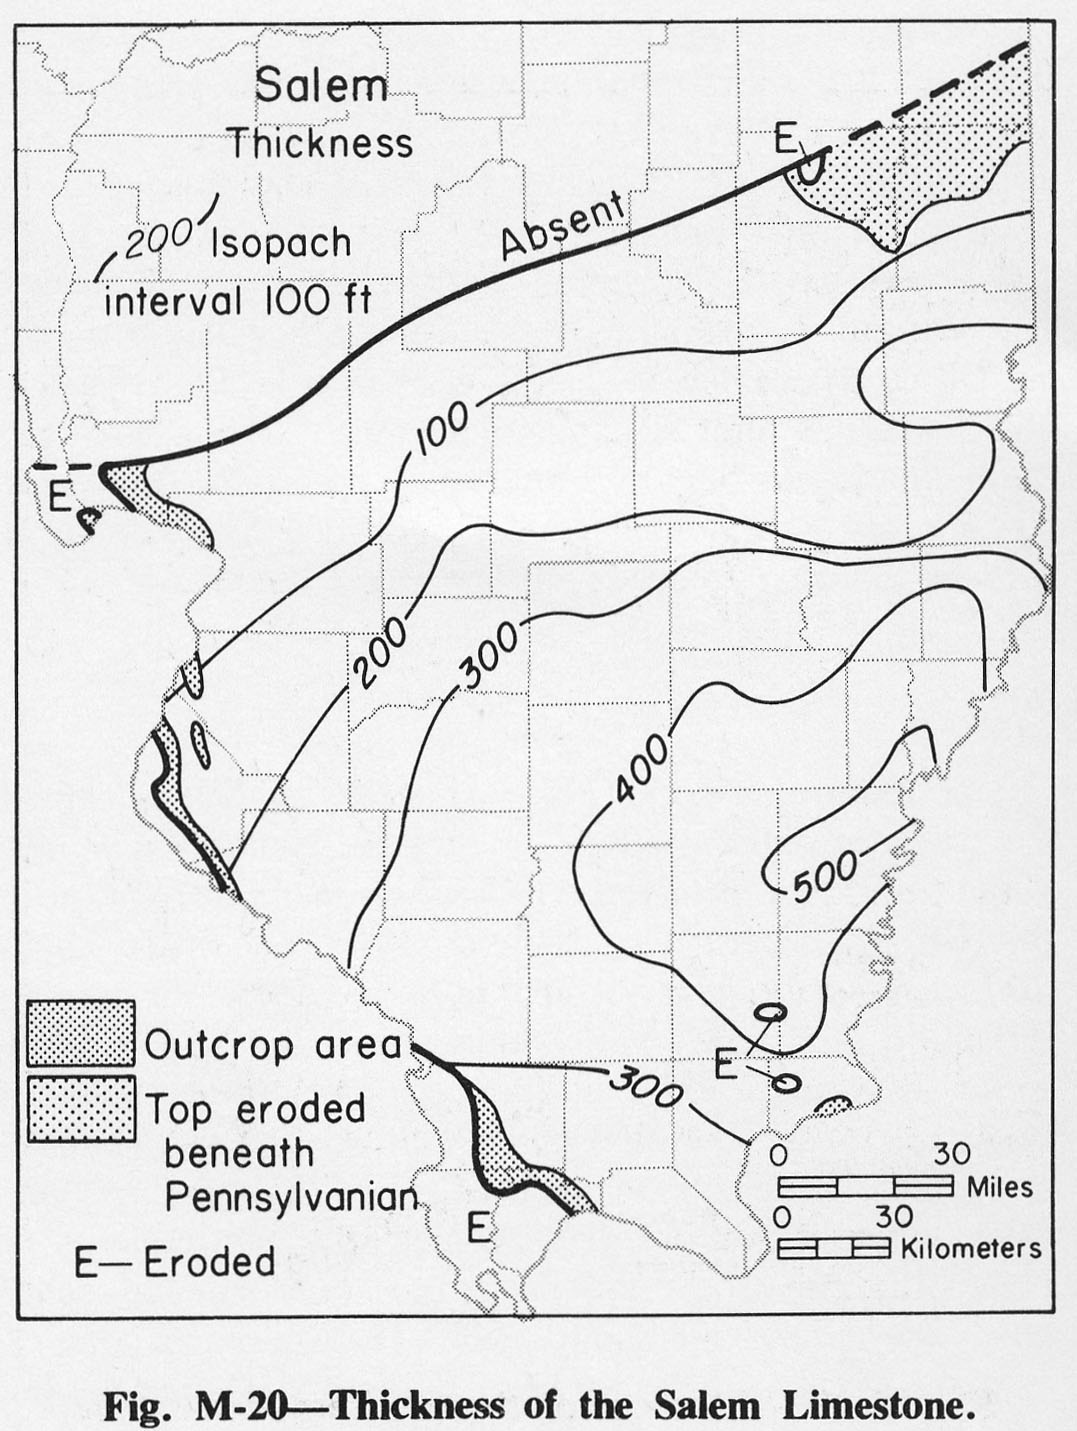
| 14:03, 4 April 2016 | Figure M-20.jpg (file) |  |
248 KB | Alan.Myers | Fig. M-20 -- Thickness of the Salem Limestone. | 1 |
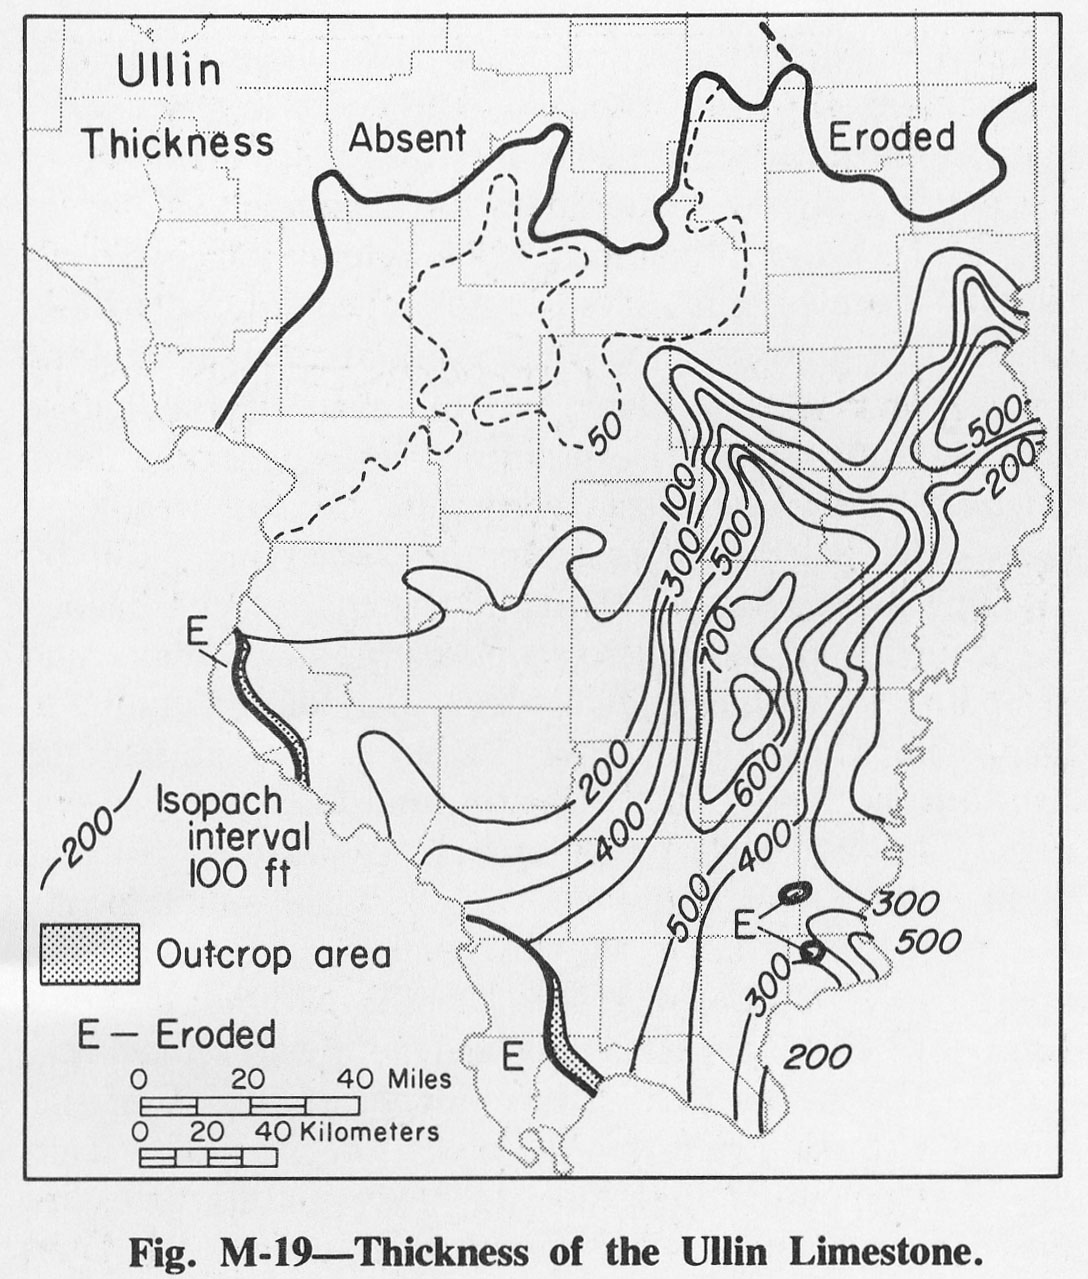
| 14:02, 4 April 2016 | Figure M-19.jpg (file) |  |
285 KB | Alan.Myers | Fig. M-19 -- Thickness of the Ullin Limestone. | 1 |
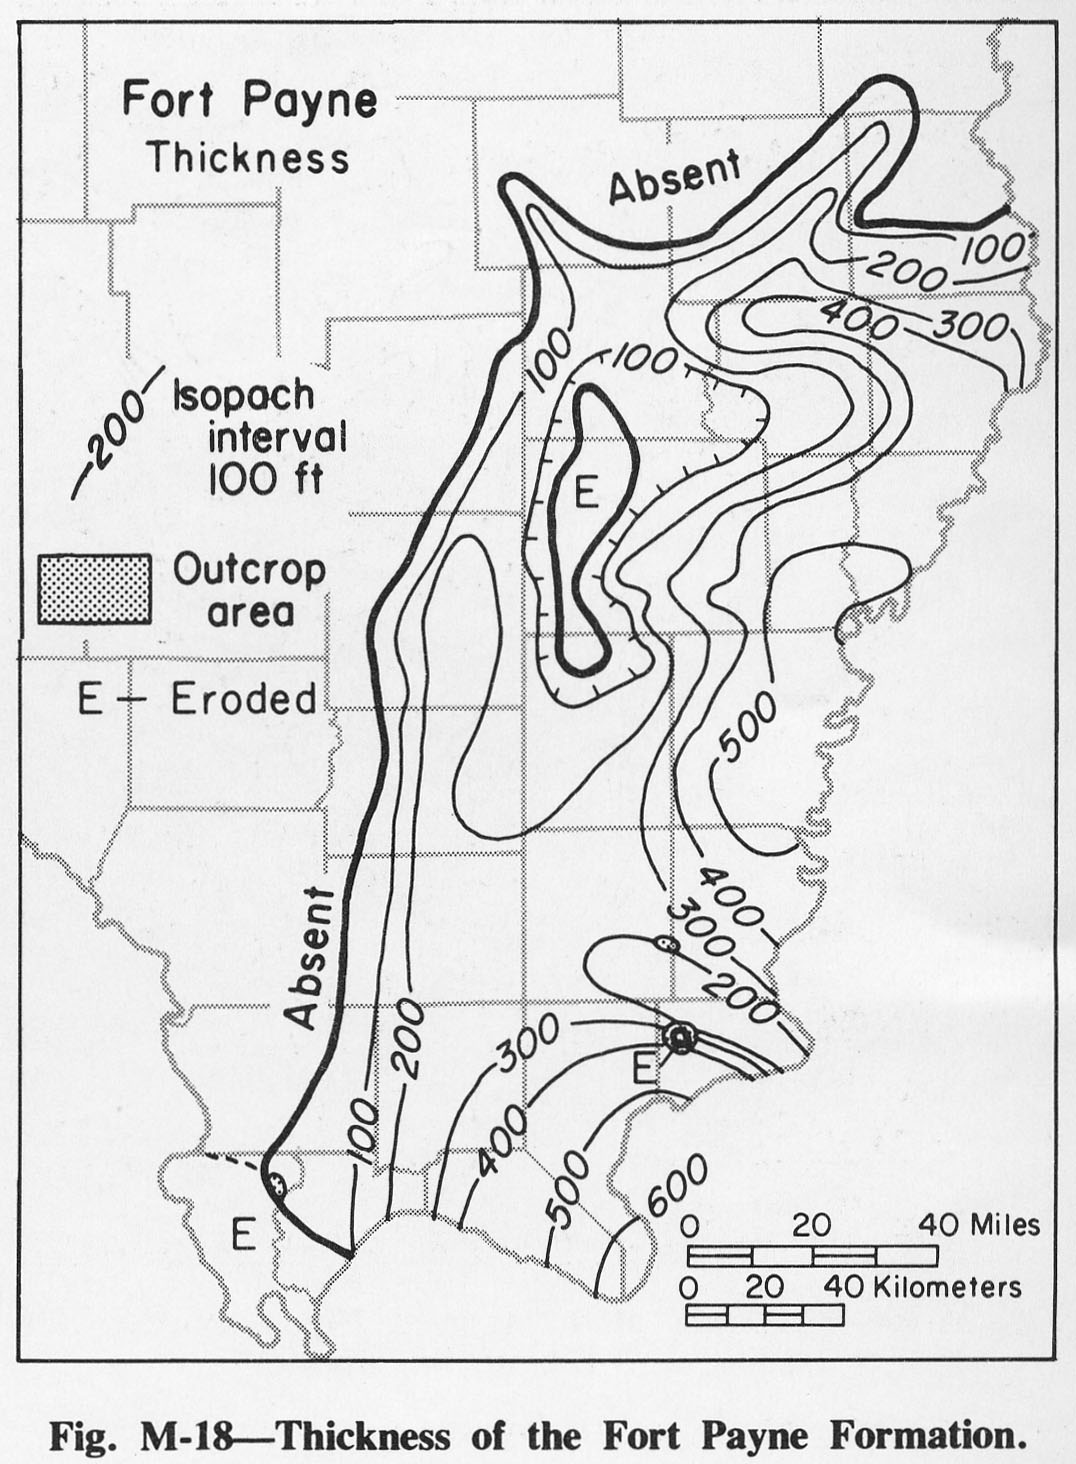
| 14:01, 4 April 2016 | Figure M-18.jpg (file) |  |
254 KB | Alan.Myers | Fig M-18 -- Thickness of the Fort Payne Formation. | 1 |
| 14:01, 4 April 2016 | Figure M-17.jpg (file) |  |
251 KB | Alan.Myers | Fig. M-17 -- Thickness of Burlington Limestone. | 1 |
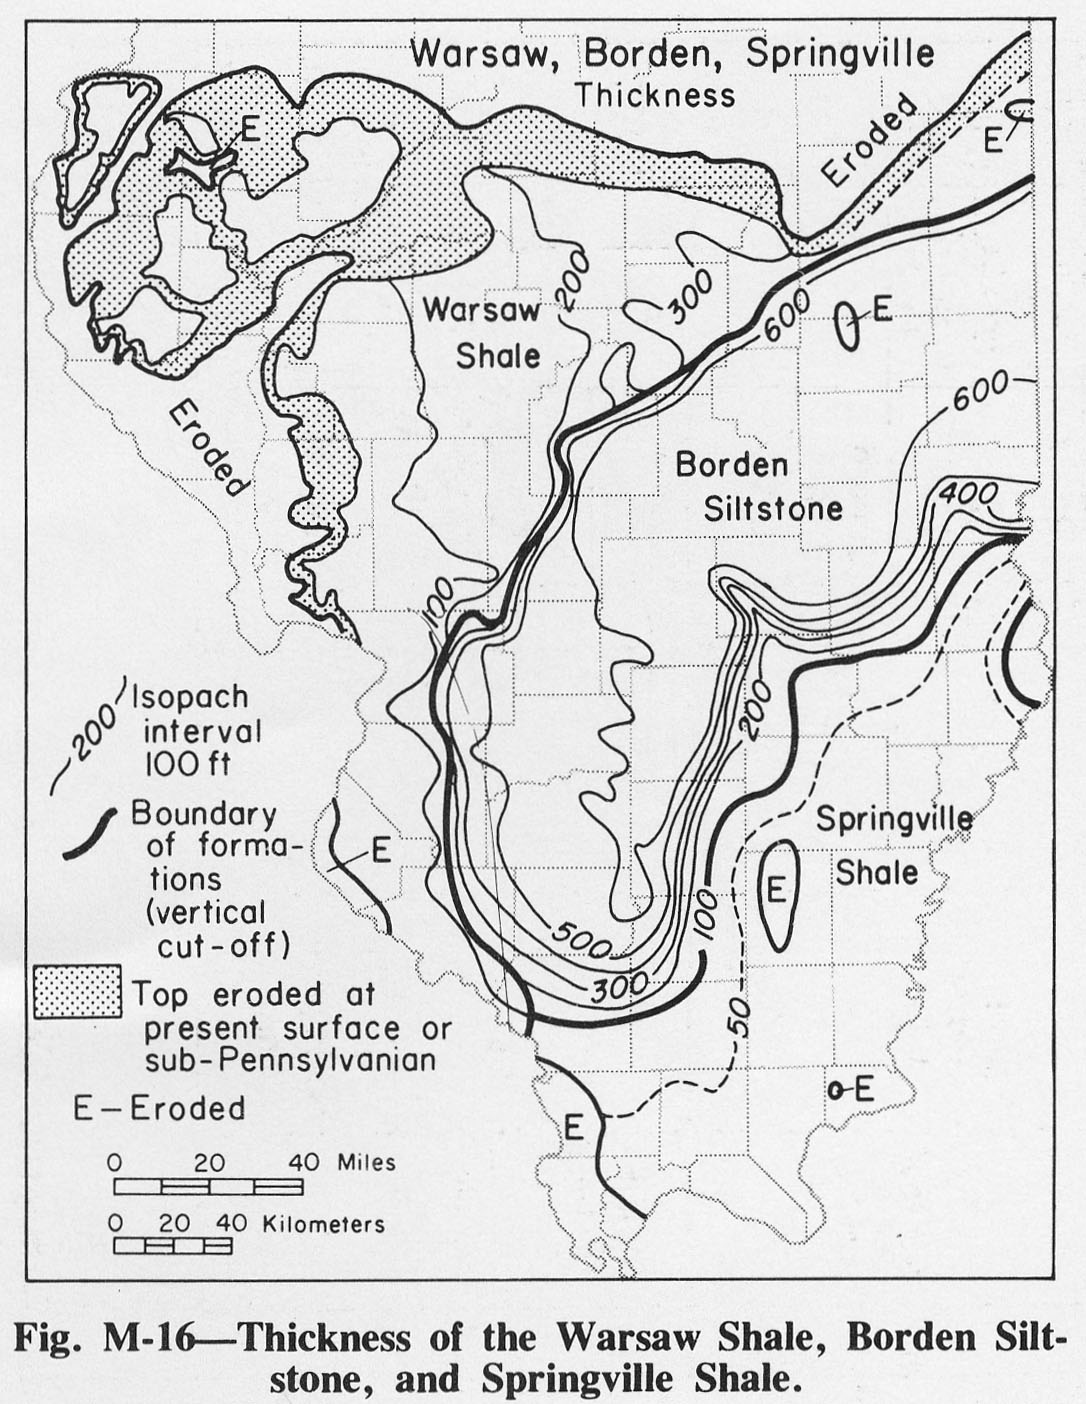
| 14:00, 4 April 2016 | Figure M-16.jpg (file) |  |
306 KB | Alan.Myers | Fig. M-16 -- Thickness of the Warsaw Shale, Borden Siltstone, and Springville Shale. | 1 |
| 13:59, 4 April 2016 | Figure M-15.jpg (file) |  |
847 KB | Alan.Myers | Fig M-15 -- Development of the classification of the Valmeyeran Series. | 1 |