File:C605-Figure-10.jpg
Revision as of 15:47, 17 August 2023 by Alan.Myers (talk | contribs)
Size of this preview: 459 × 600 pixels. Other resolution: 1,836 × 2,400 pixels.
Original file (1,836 × 2,400 pixels, file size: 859 KB, MIME type: image/jpeg)
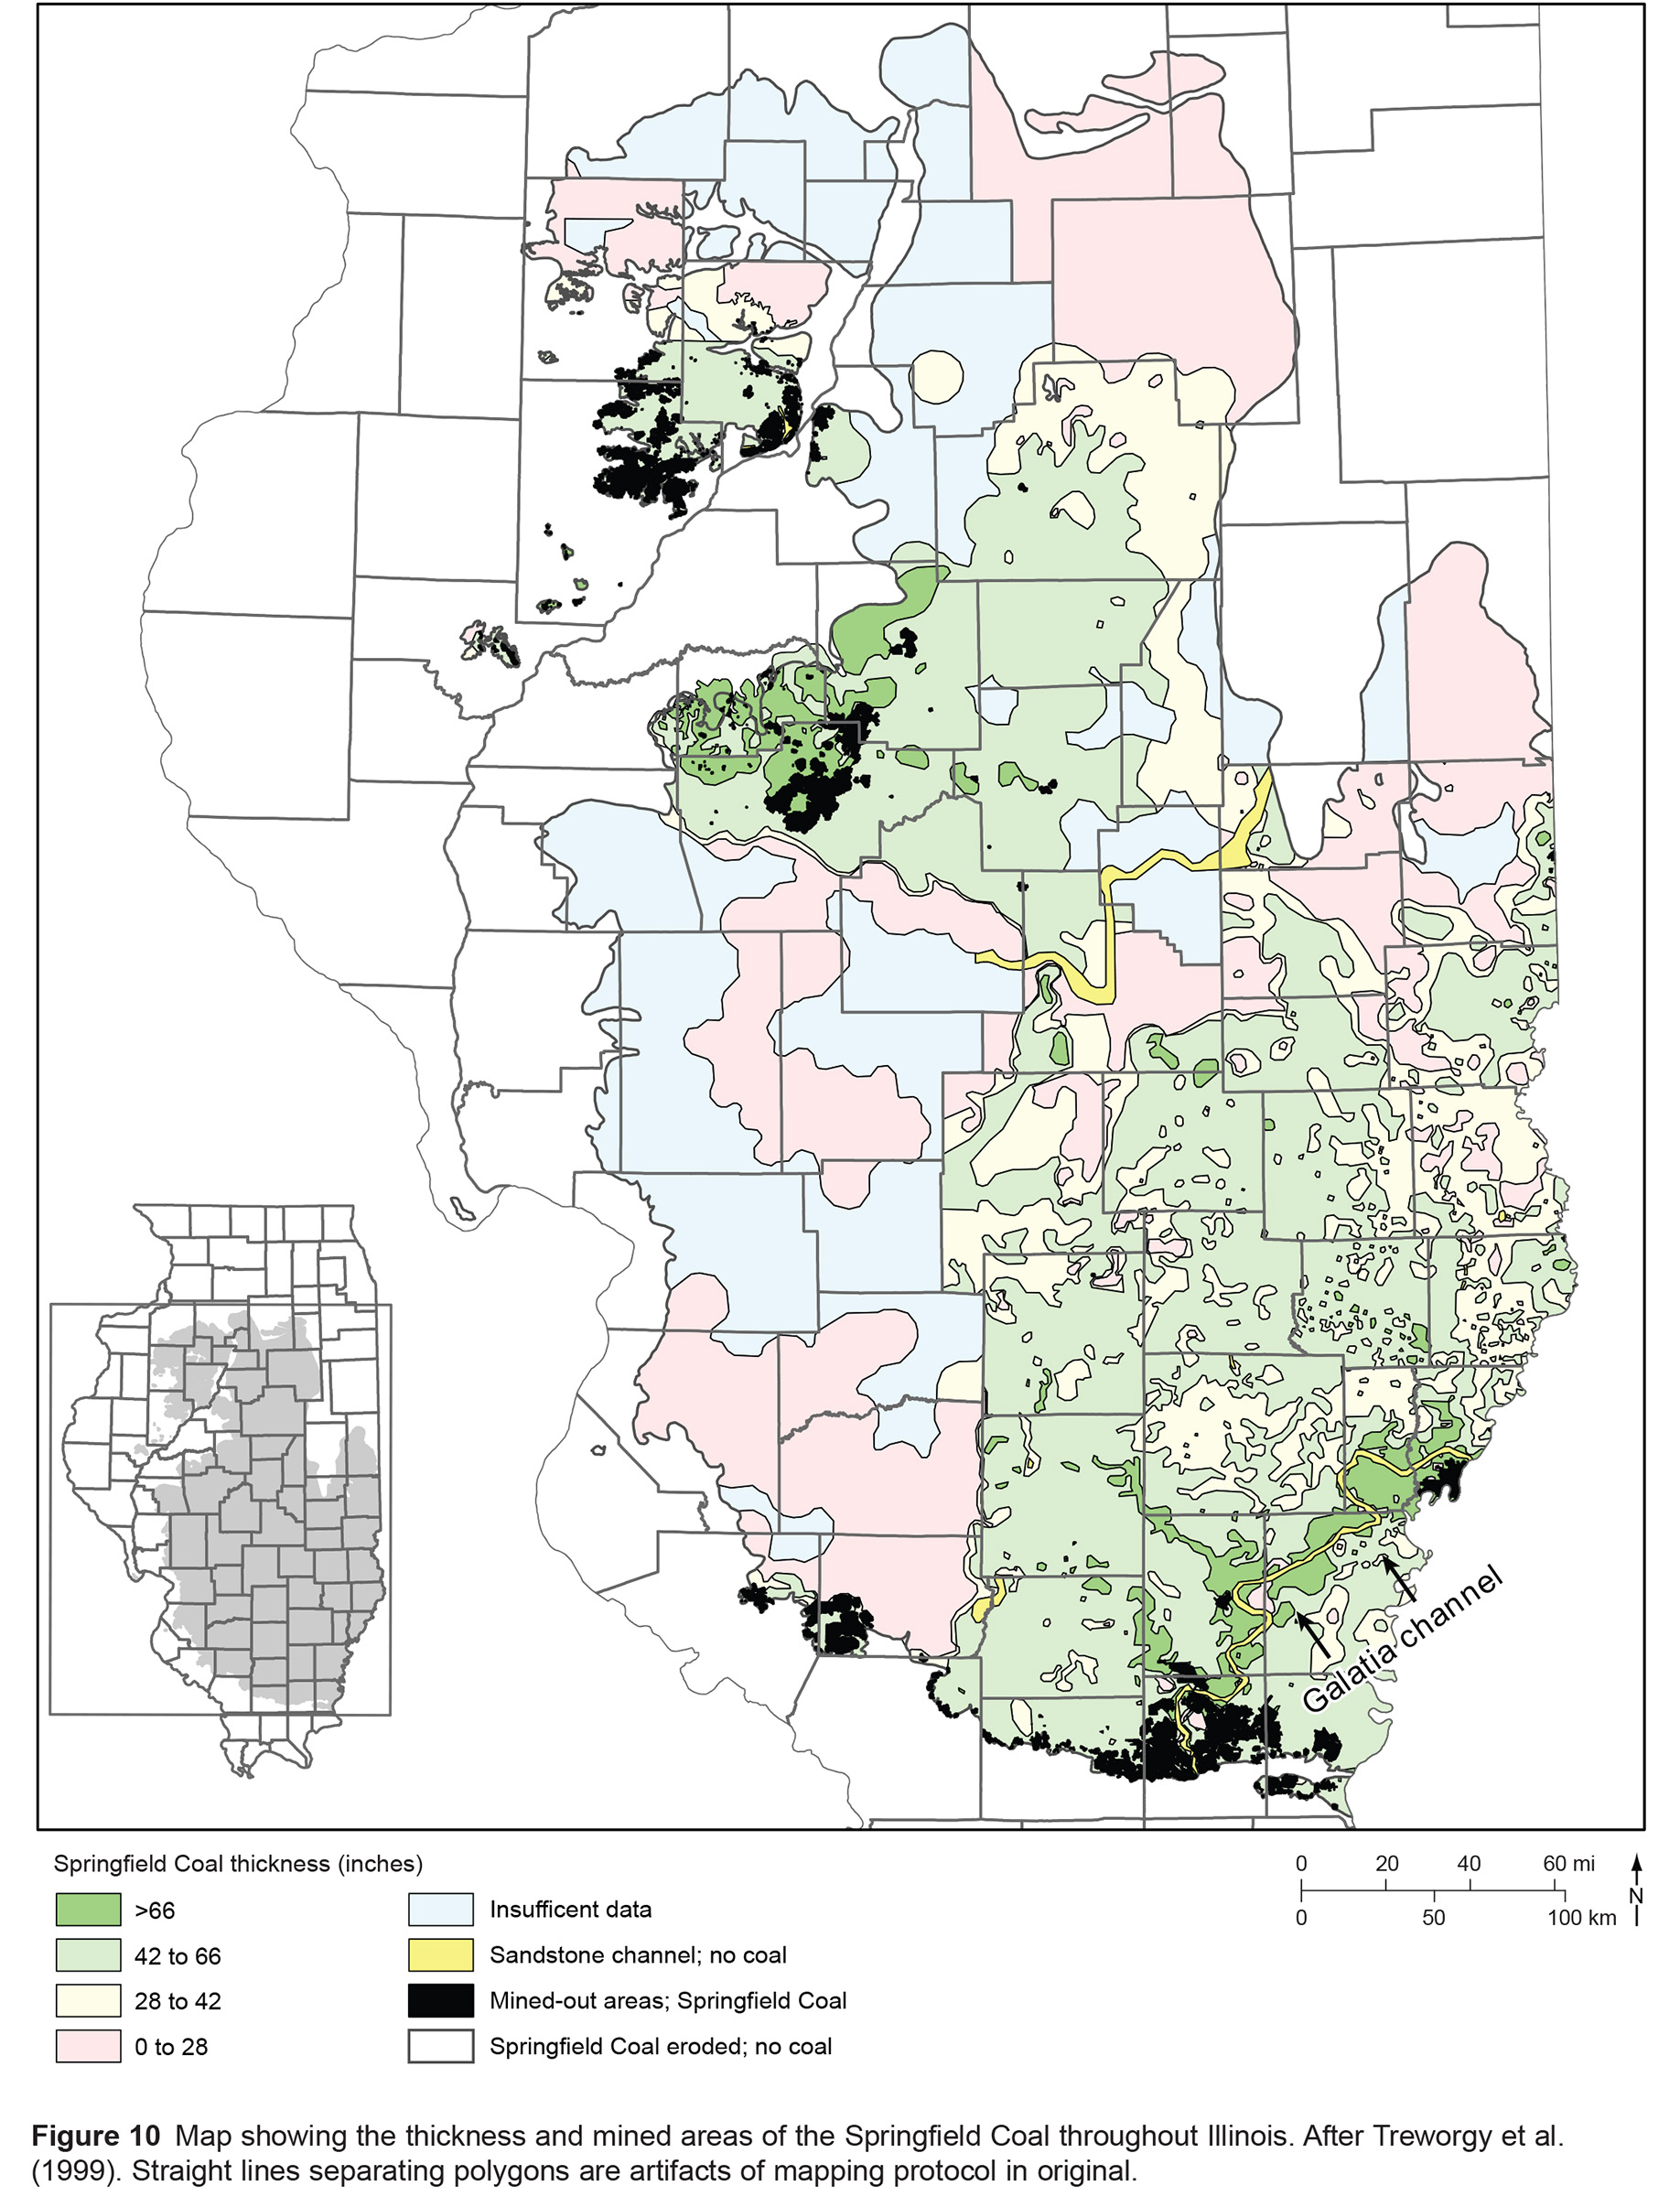
Figure 10 Map showing the thickness and mined areas of the Springfield Coal throughout Illinois. After Treworgy et al. (1999). Straight lines separating polygons are artifacts of mapping protocol in original.
File history
Click on a date/time to view the file as it appeared at that time.
| Date/Time | Thumbnail | Dimensions | User | Comment | |
|---|---|---|---|---|---|
| current | ★ Approved revision 15:50, 17 August 2023 | | 1,836 × 2,400 (859 KB) | Alan.Myers (talk | contribs) |
You cannot overwrite this file.
File usage
The following 3 pages use this file: