Uploads by Alan.Myers
Jump to navigation
Jump to search
This special page shows all uploaded files.
| Date | Name | Thumbnail | Size | Description | Versions |
|---|---|---|---|---|---|
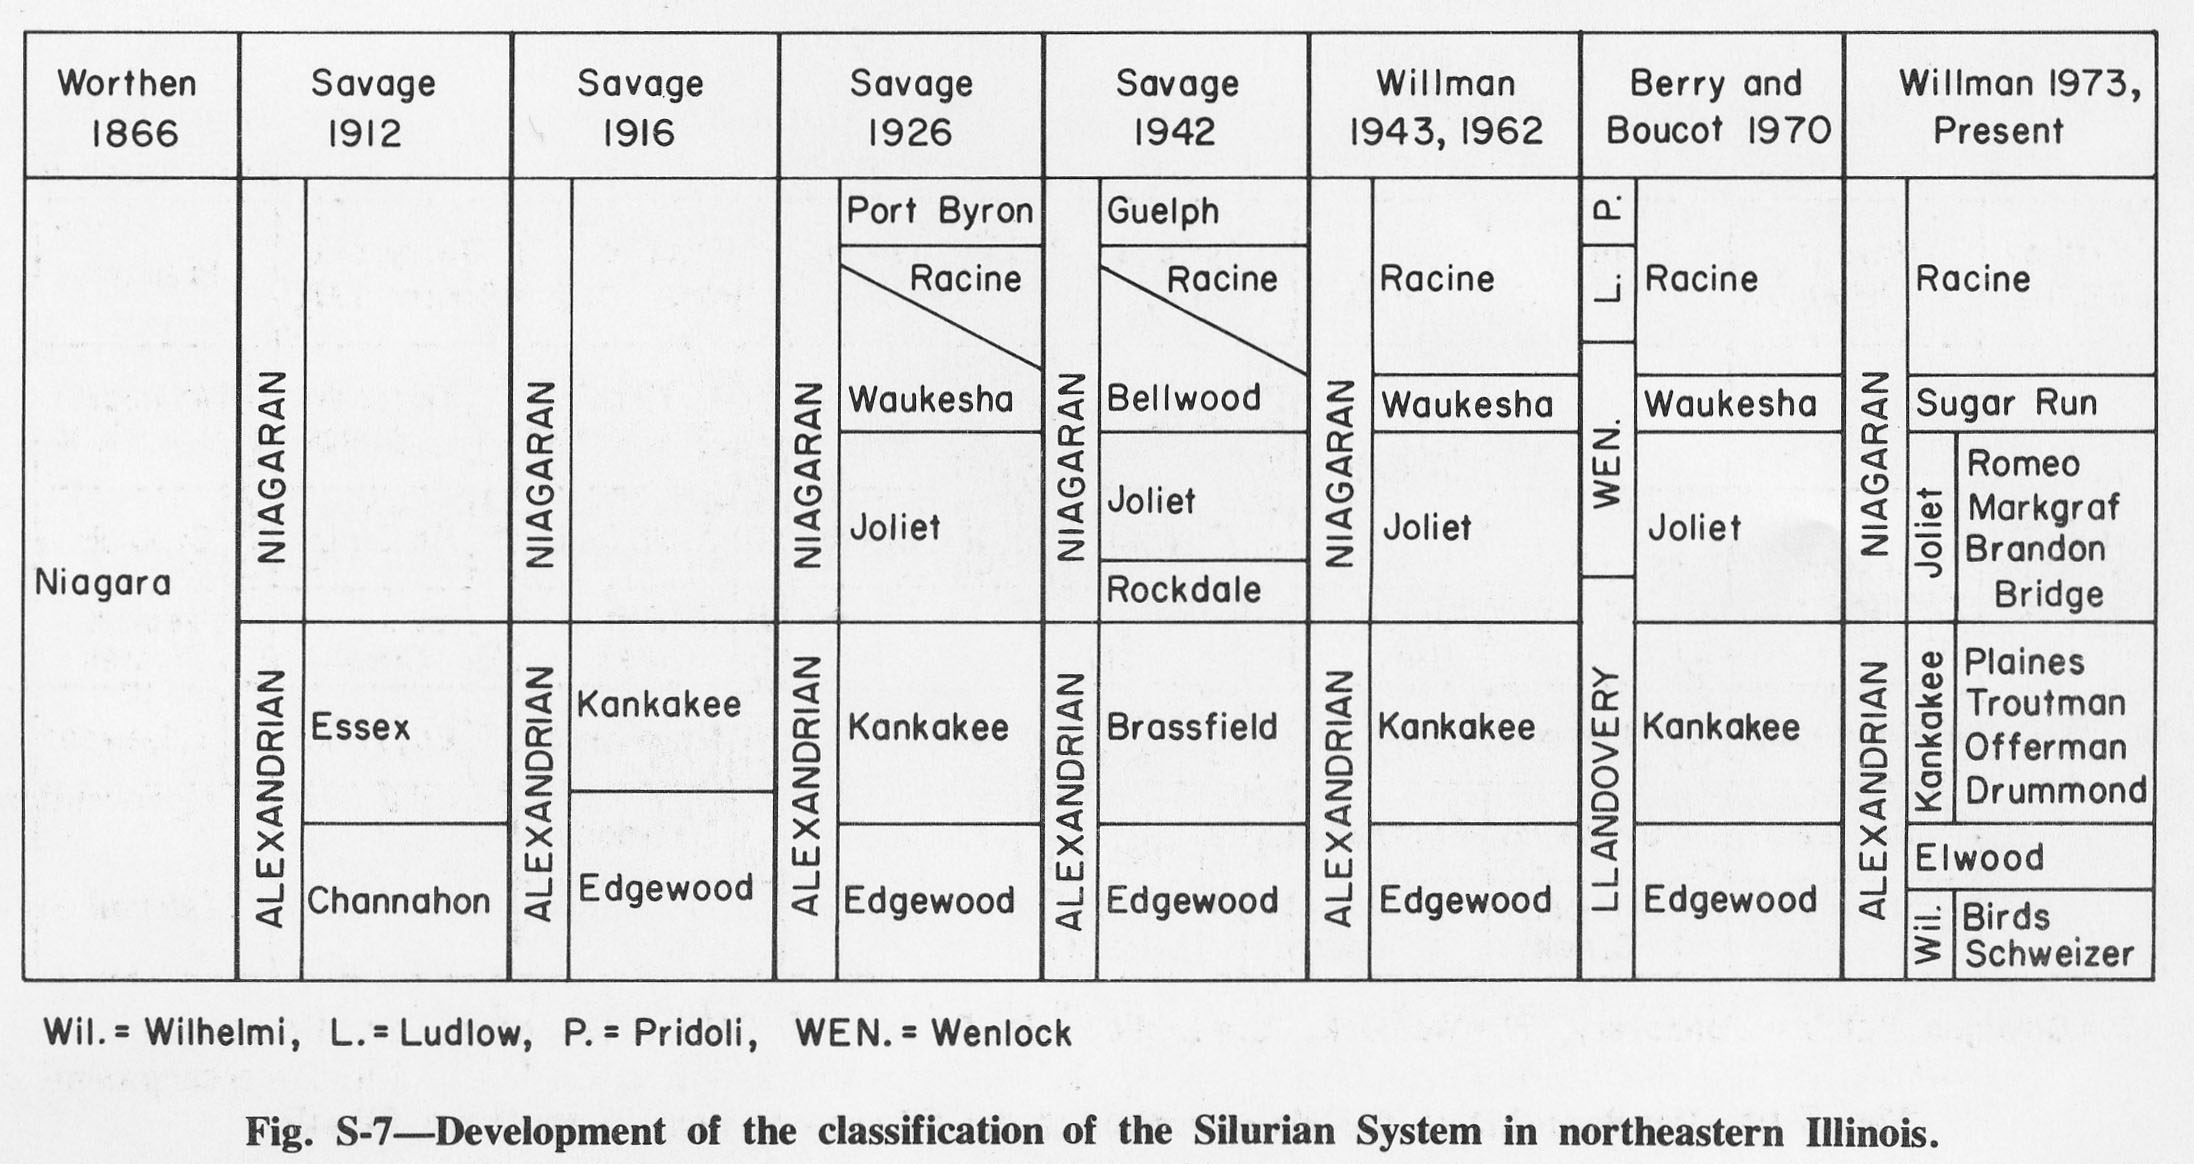
| 17:53, 4 April 2016 | Figure S-7.jpg (file) |  |
329 KB | Fig. S-7 -- Development of the classification of the Silurian System in northeastern Illinois. | 1 |
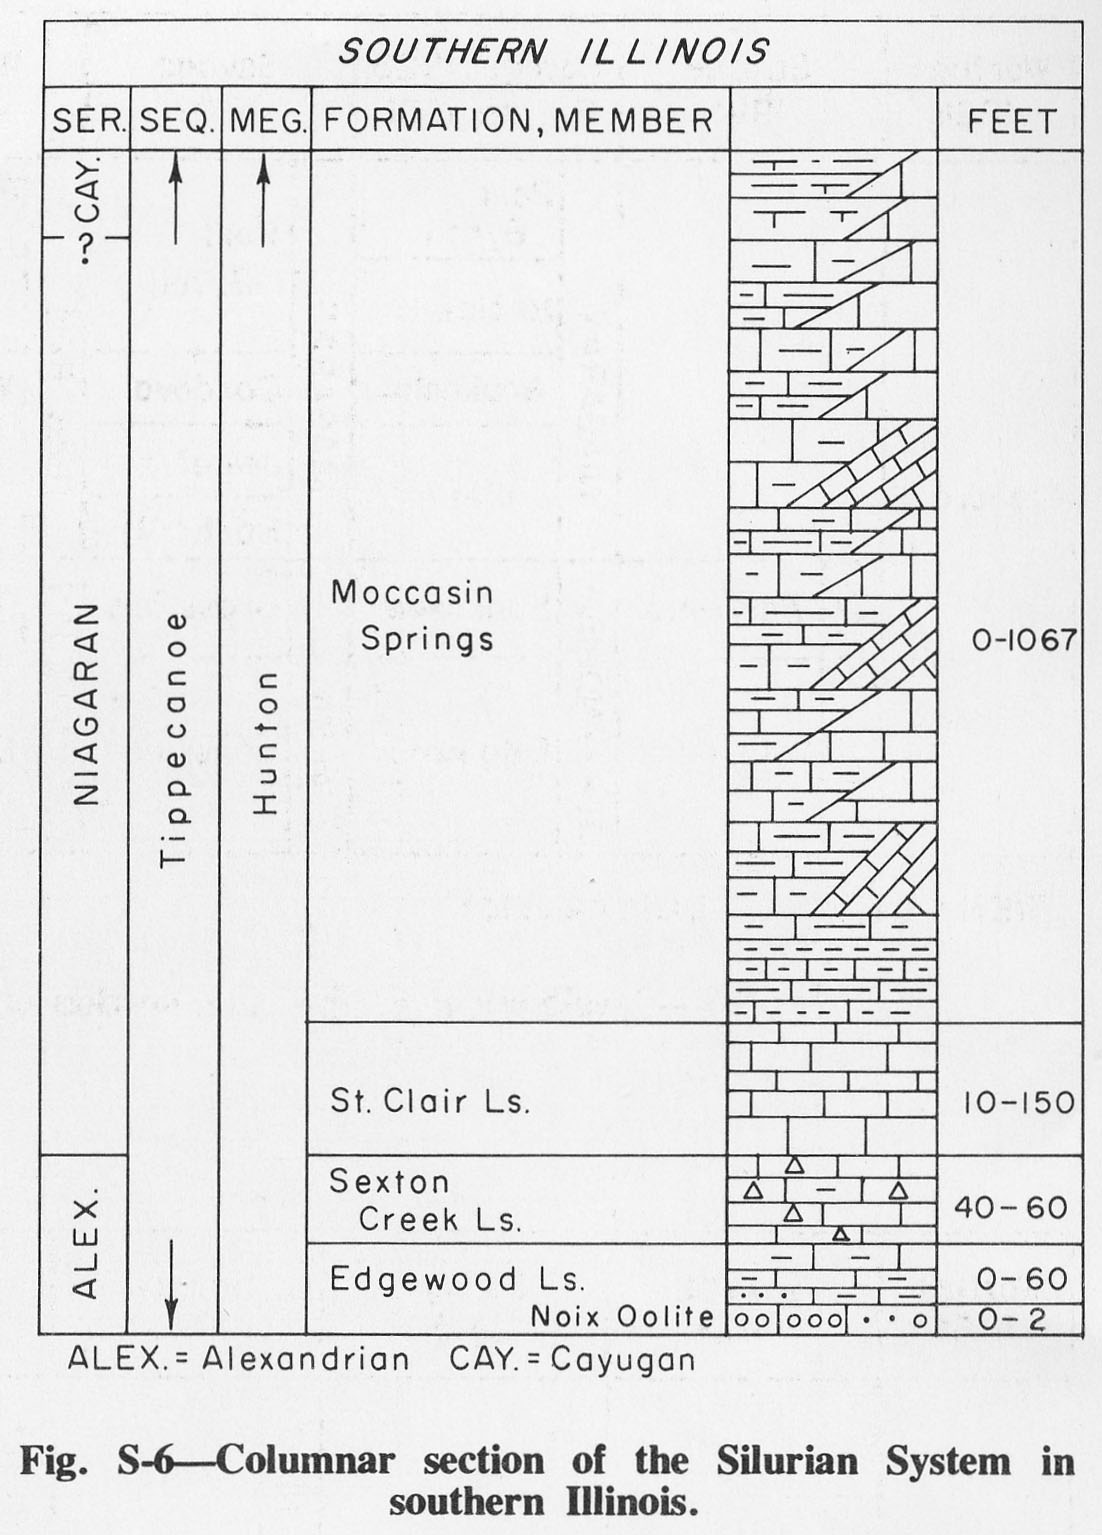
| 17:52, 4 April 2016 | Figure S-6.jpg (file) |  |
209 KB | Fig. S-6 -- Columnar section of Silurian System in southern Illinois. | 1 |
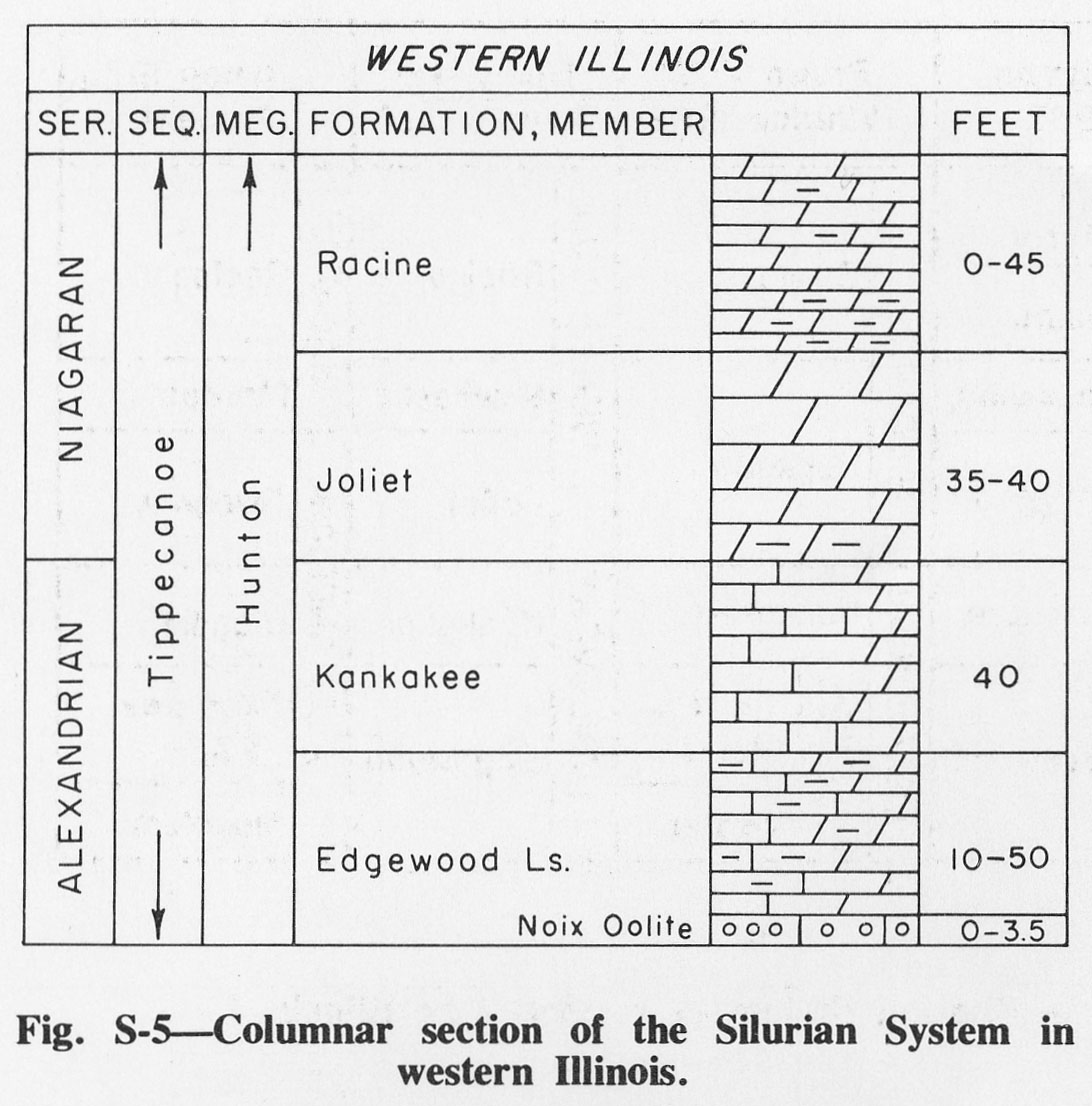
| 17:11, 4 April 2016 | Figure S-5.jpg (file) |  |
198 KB | Fig. S-5 -- Columnar section of the Silurian System in western Illinois. | 1 |
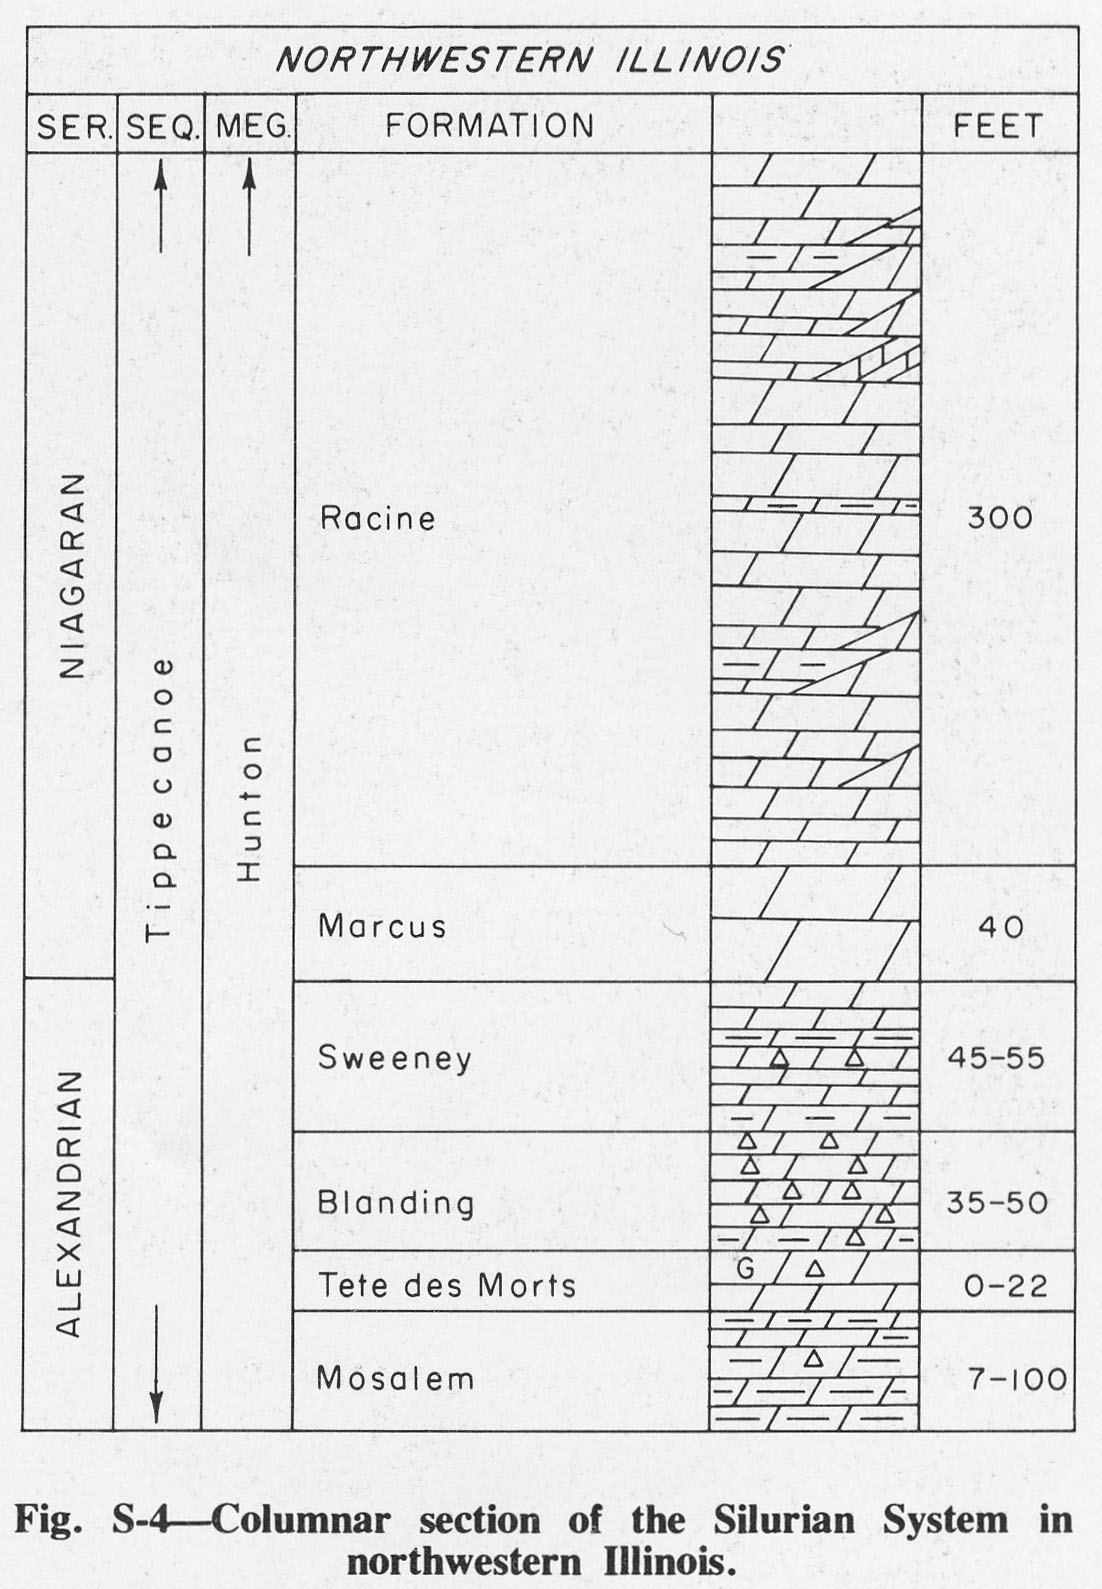
| 17:03, 4 April 2016 | Figure S-4.jpg (file) |  |
219 KB | Fig. S-4 -- Columnar section of the Silurian System in northwestern Illinois. | 1 |
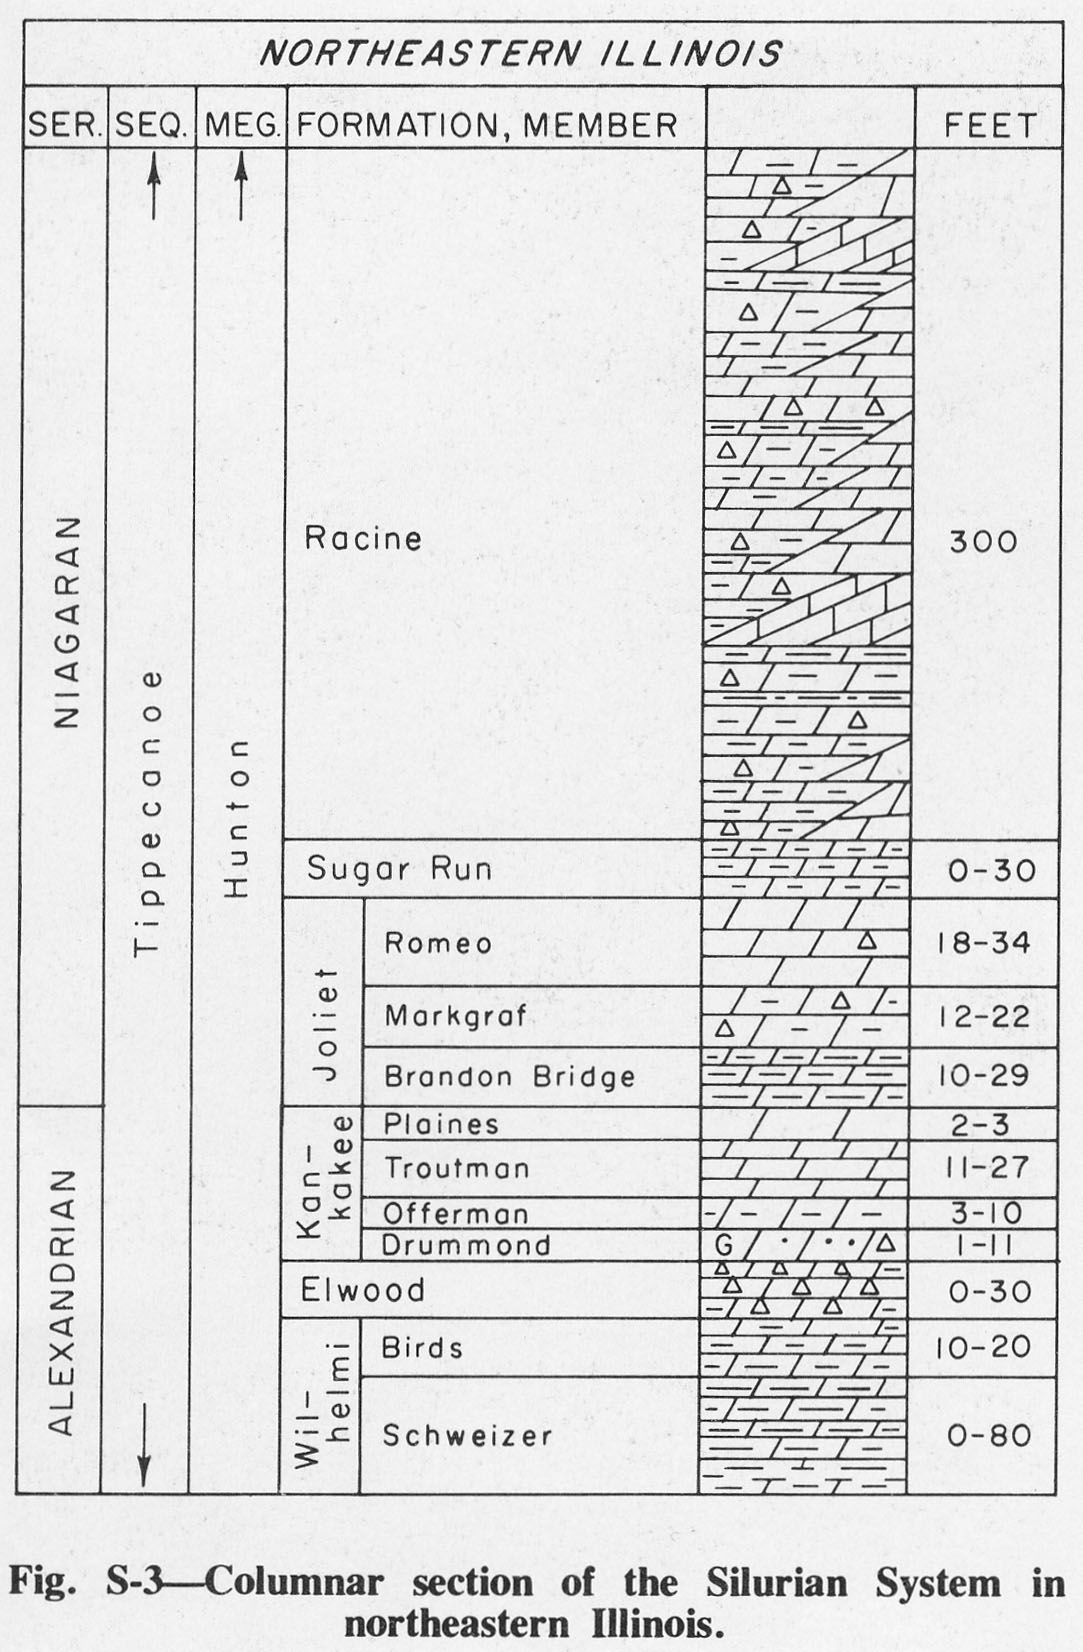
| 17:03, 4 April 2016 | Figure S-3.jpg (file) |  |
254 KB | Fig. S-3 -- Columnar section of Silurian System in northeastern Illinois. | 1 |
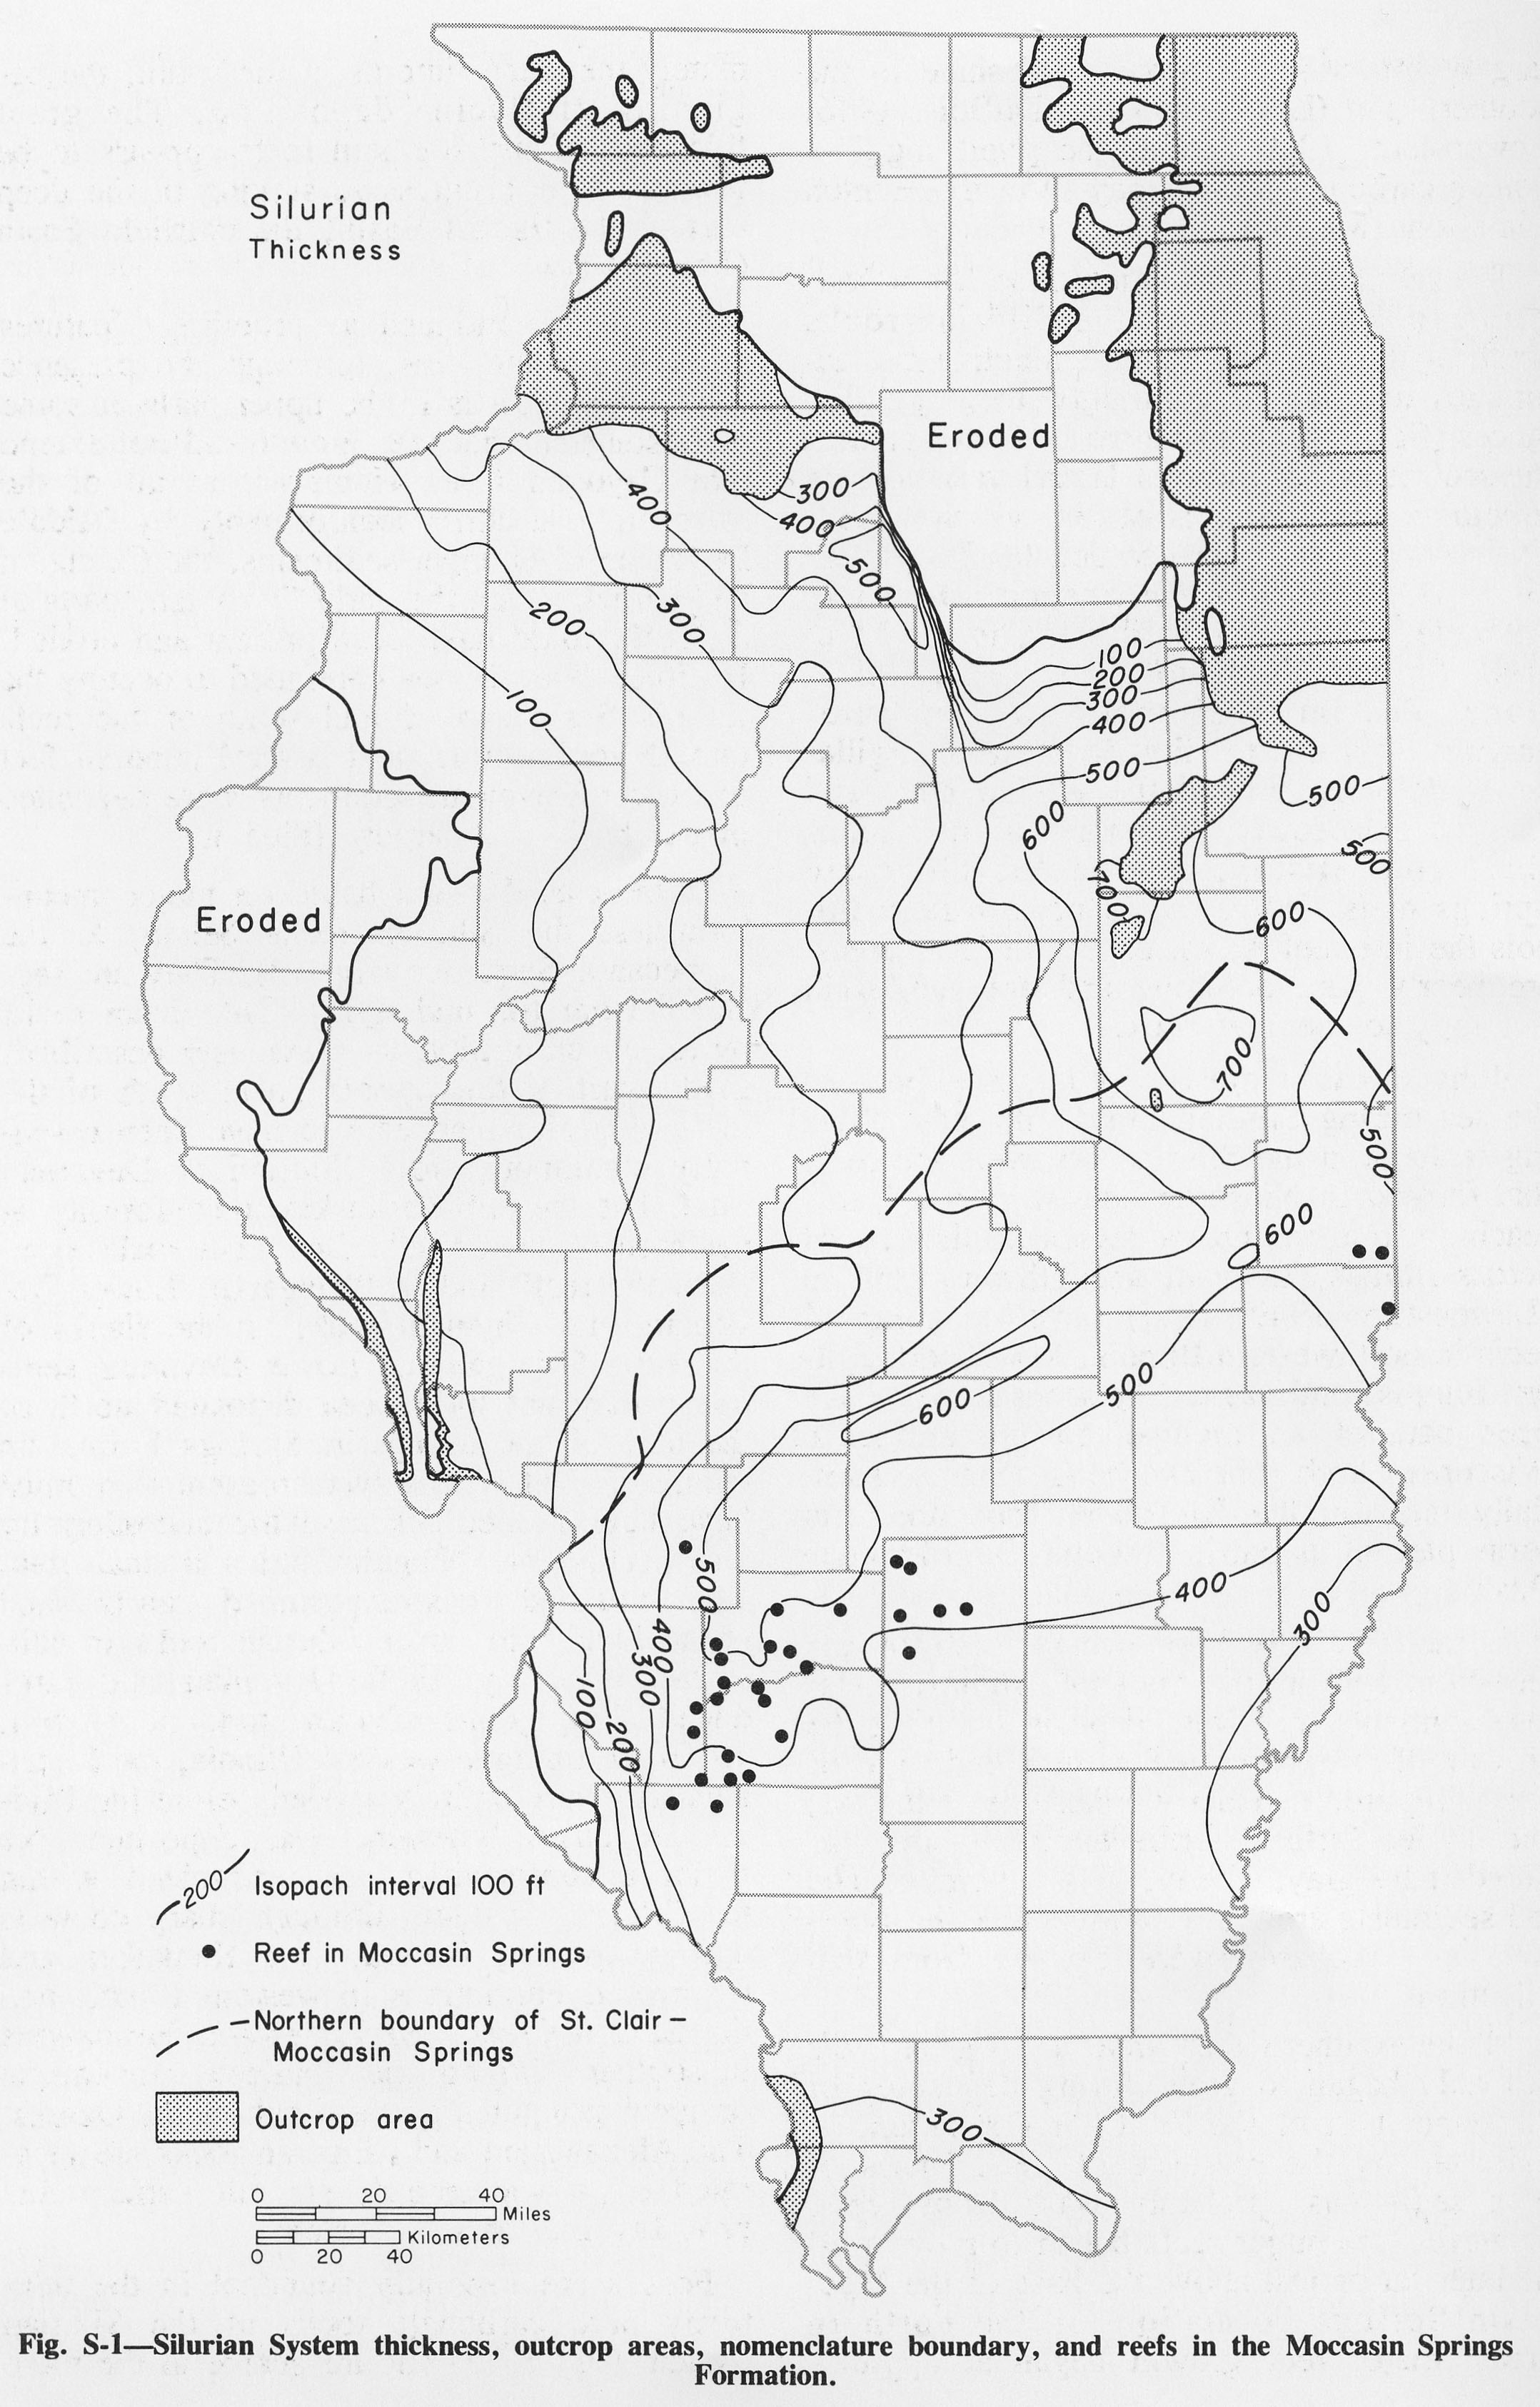
| 17:02, 4 April 2016 | Figure S-1.jpg (file) |  |
883 KB | Fig. S-1 -- Silurian System thickness, outcroup areas, nomenclature boundary, and reef in the Moccasin Springs Formation. | 1 |
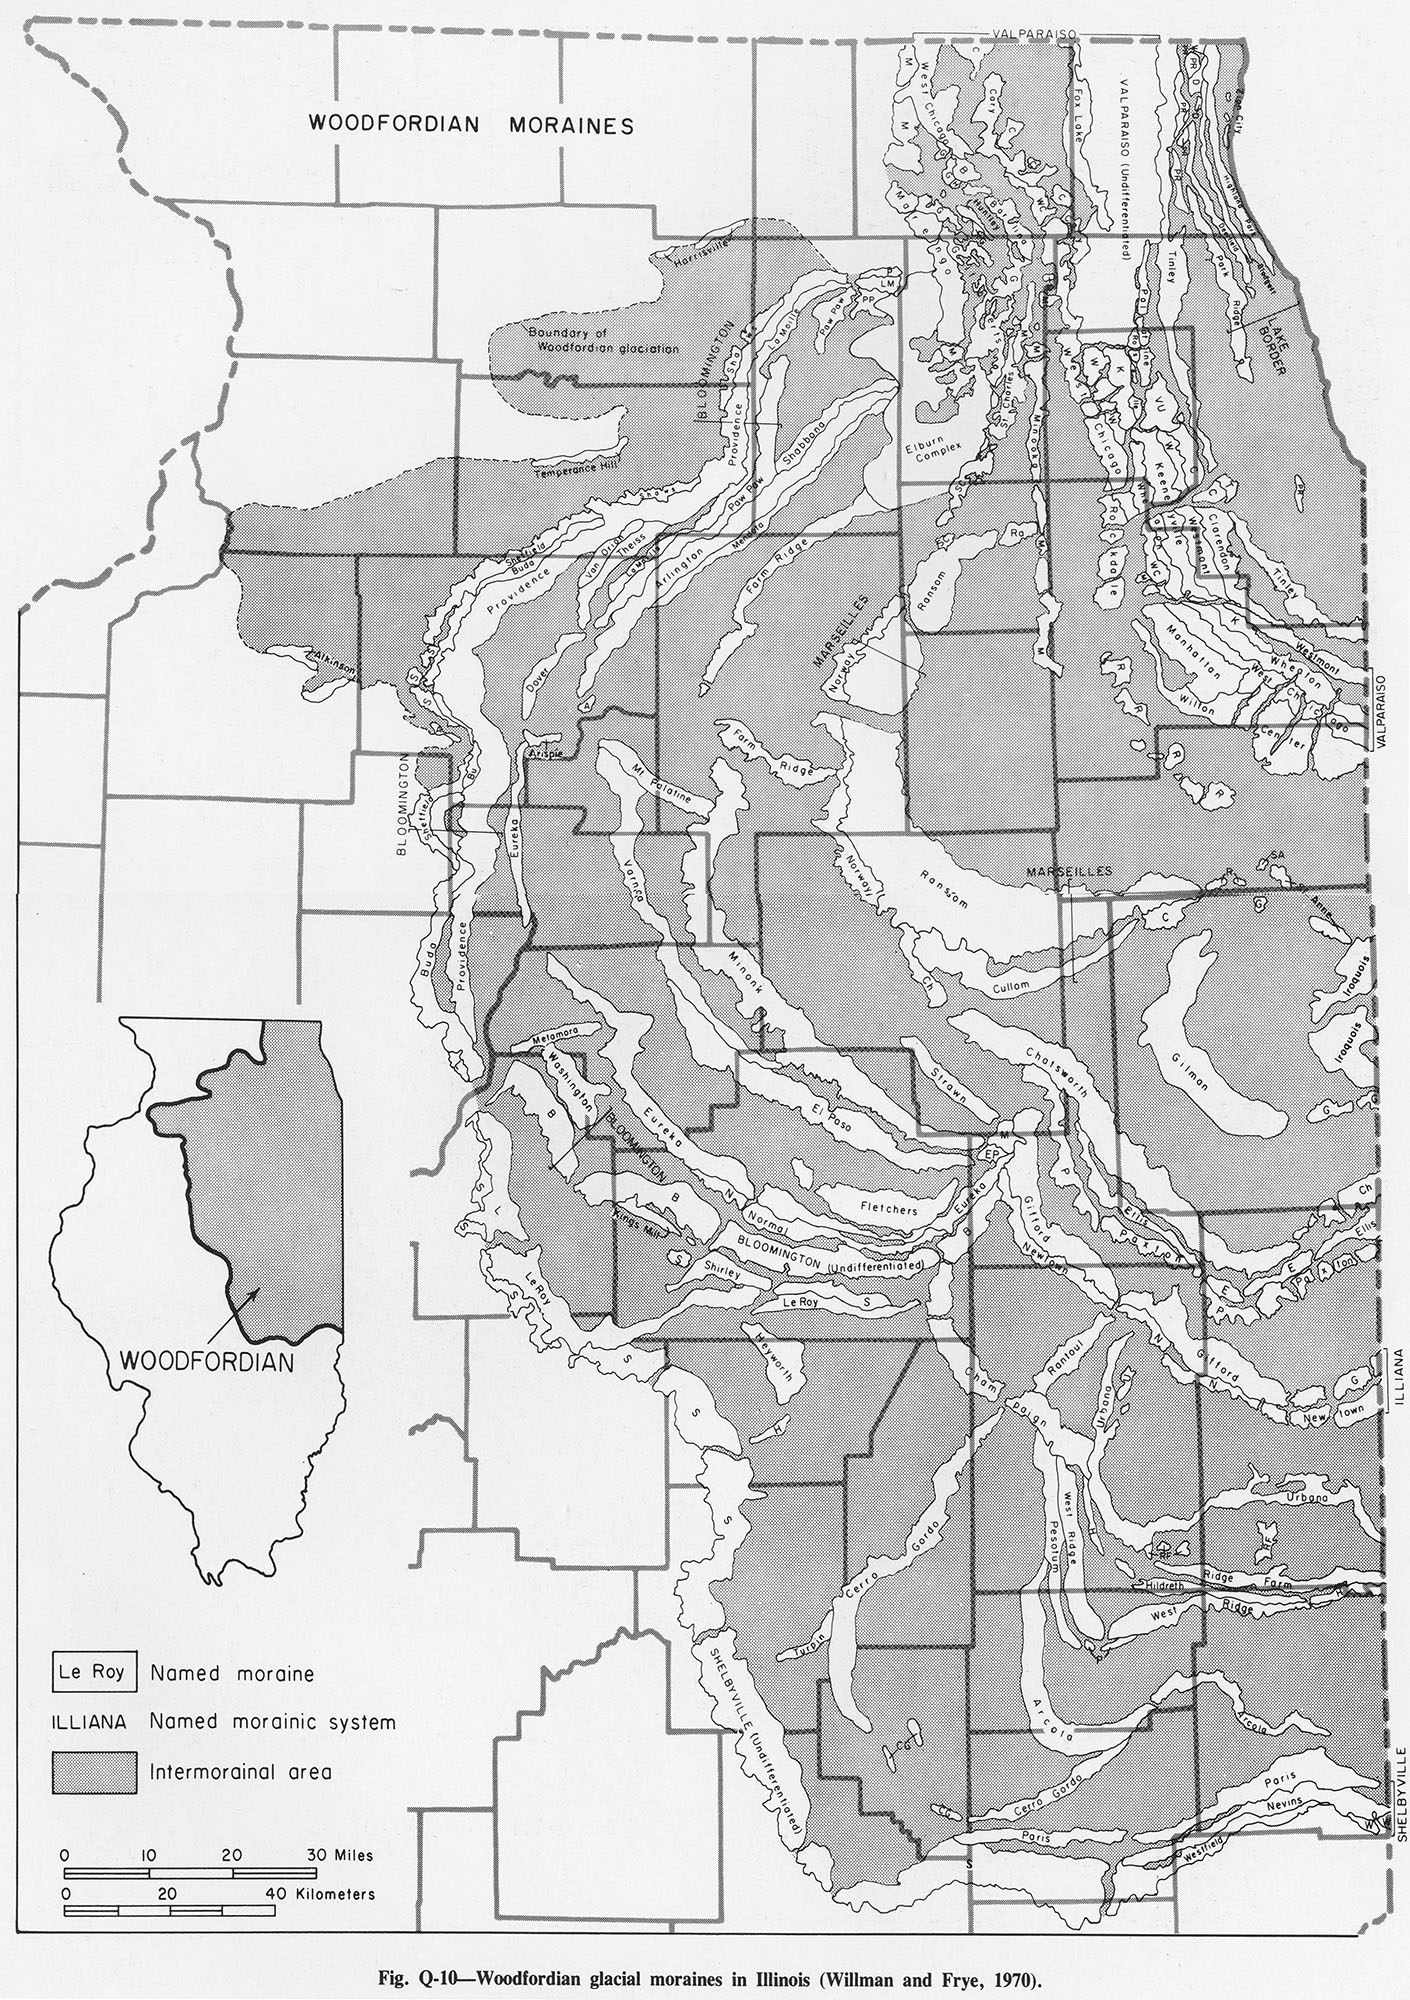
| 16:00, 4 April 2016 | Figure Q-10.jpg (file) |  |
860 KB | Fig. Q-10 -- Woodfordian glacial moraines in Illinois (Willman and Frye, 1970). | 2 |
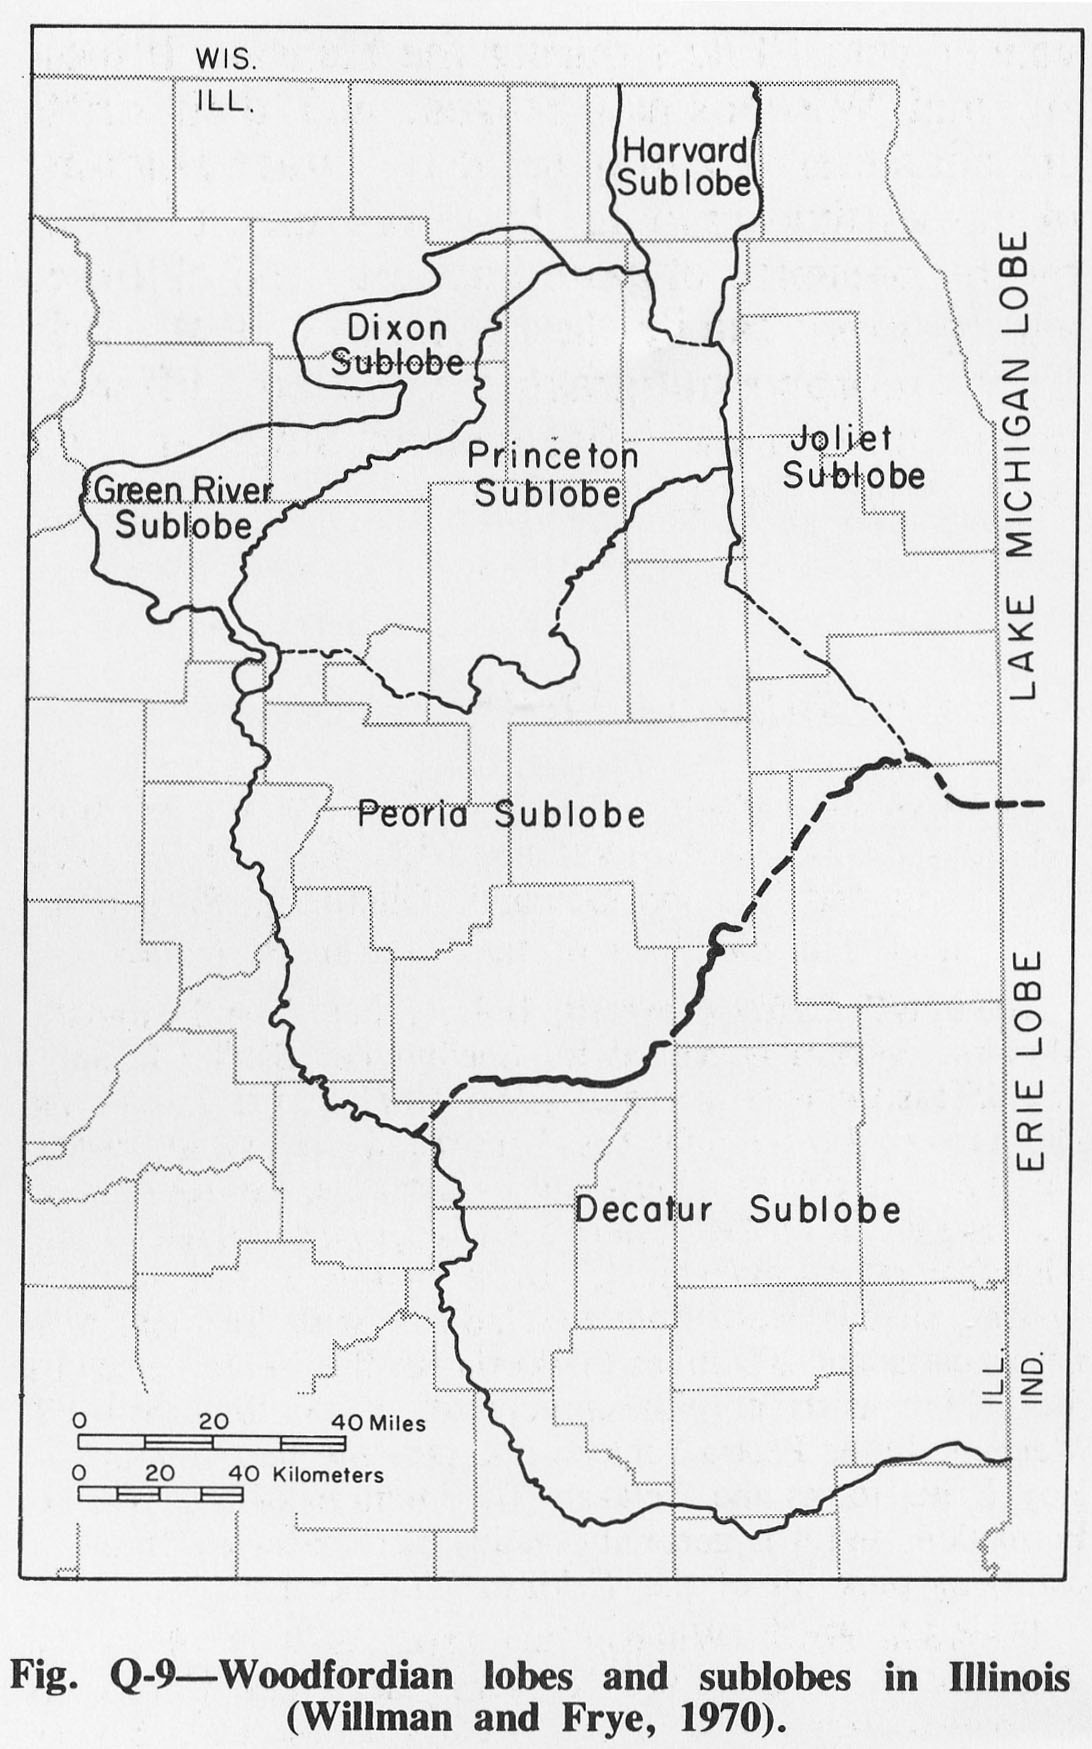
| 15:58, 4 April 2016 | Figure Q-9.jpg (file) |  |
248 KB | Fig. Q-9 -- Woodfordian lobes and sublobes in Illinois (Willman and Frye, 1970). | 1 |
| 15:56, 4 April 2016 | Figure Q-8.jpg (file) |  |
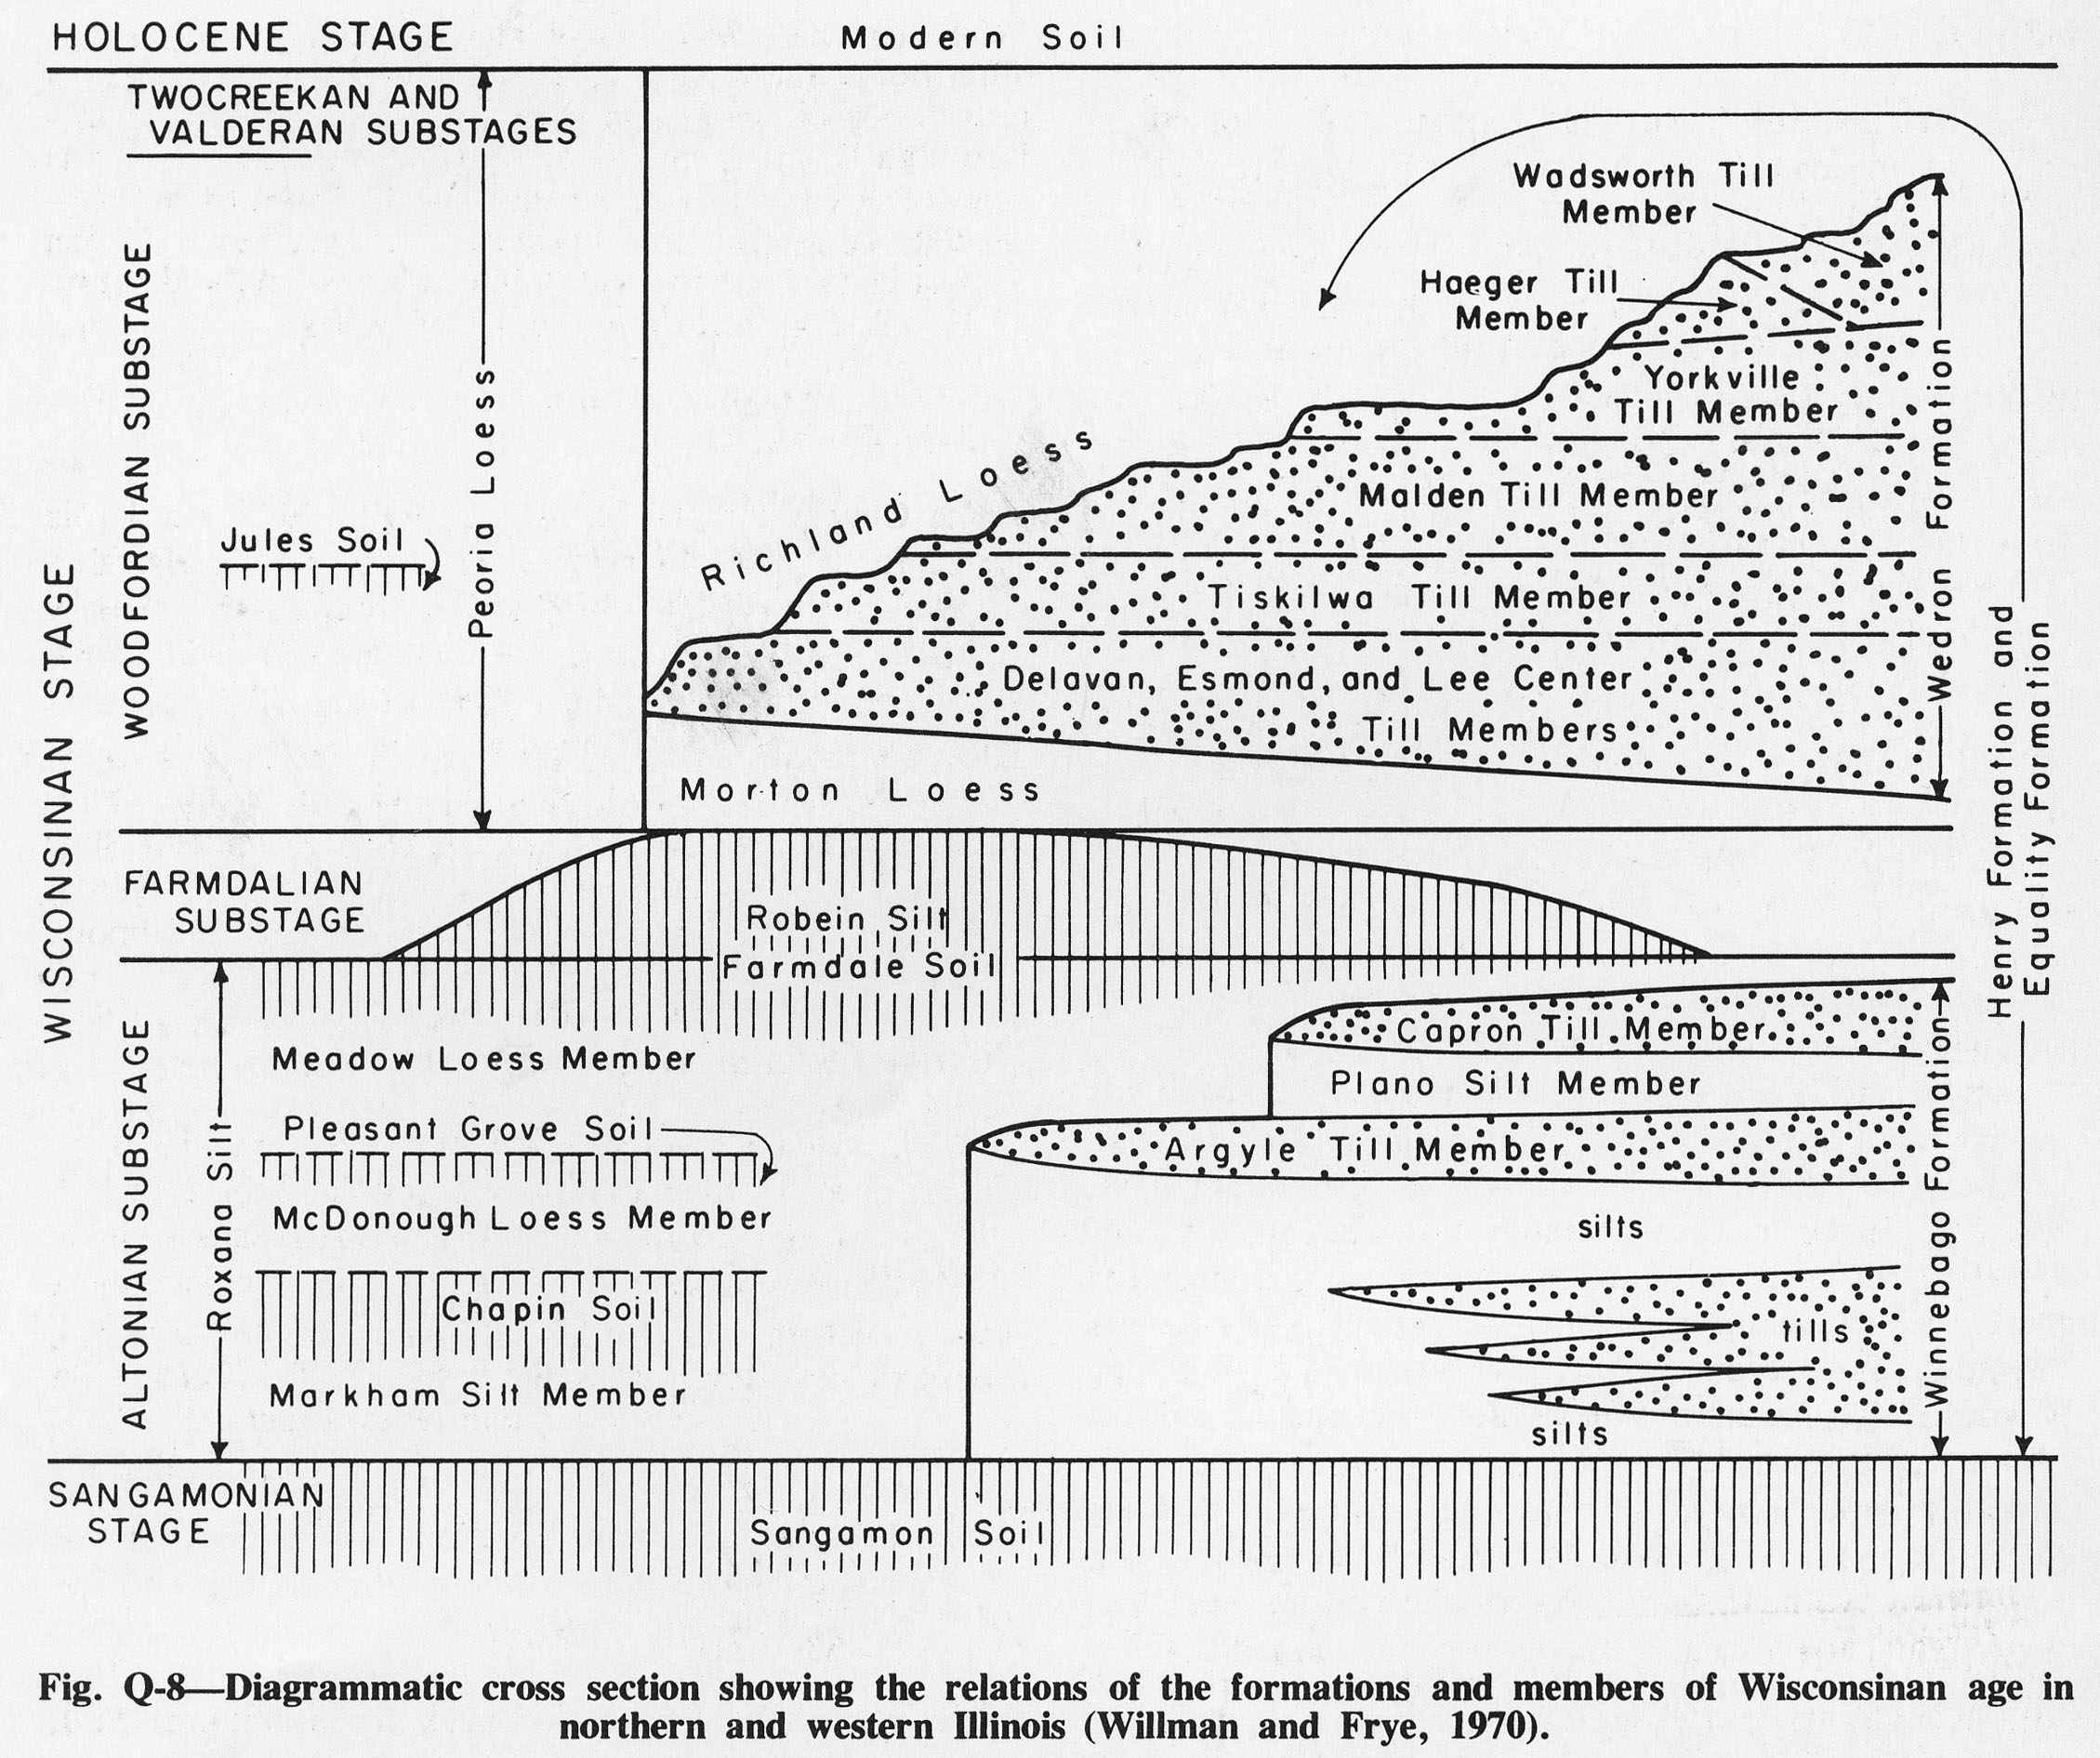
651 KB | Fig. Q-8 -- Diagrammatic cross section showing the relations of the formations and members of Wisconsinan age in northern and western Illinois (Willman and Frye, 1970). | 1 |
| 15:55, 4 April 2016 | Figure Q-7.jpg (file) |  |
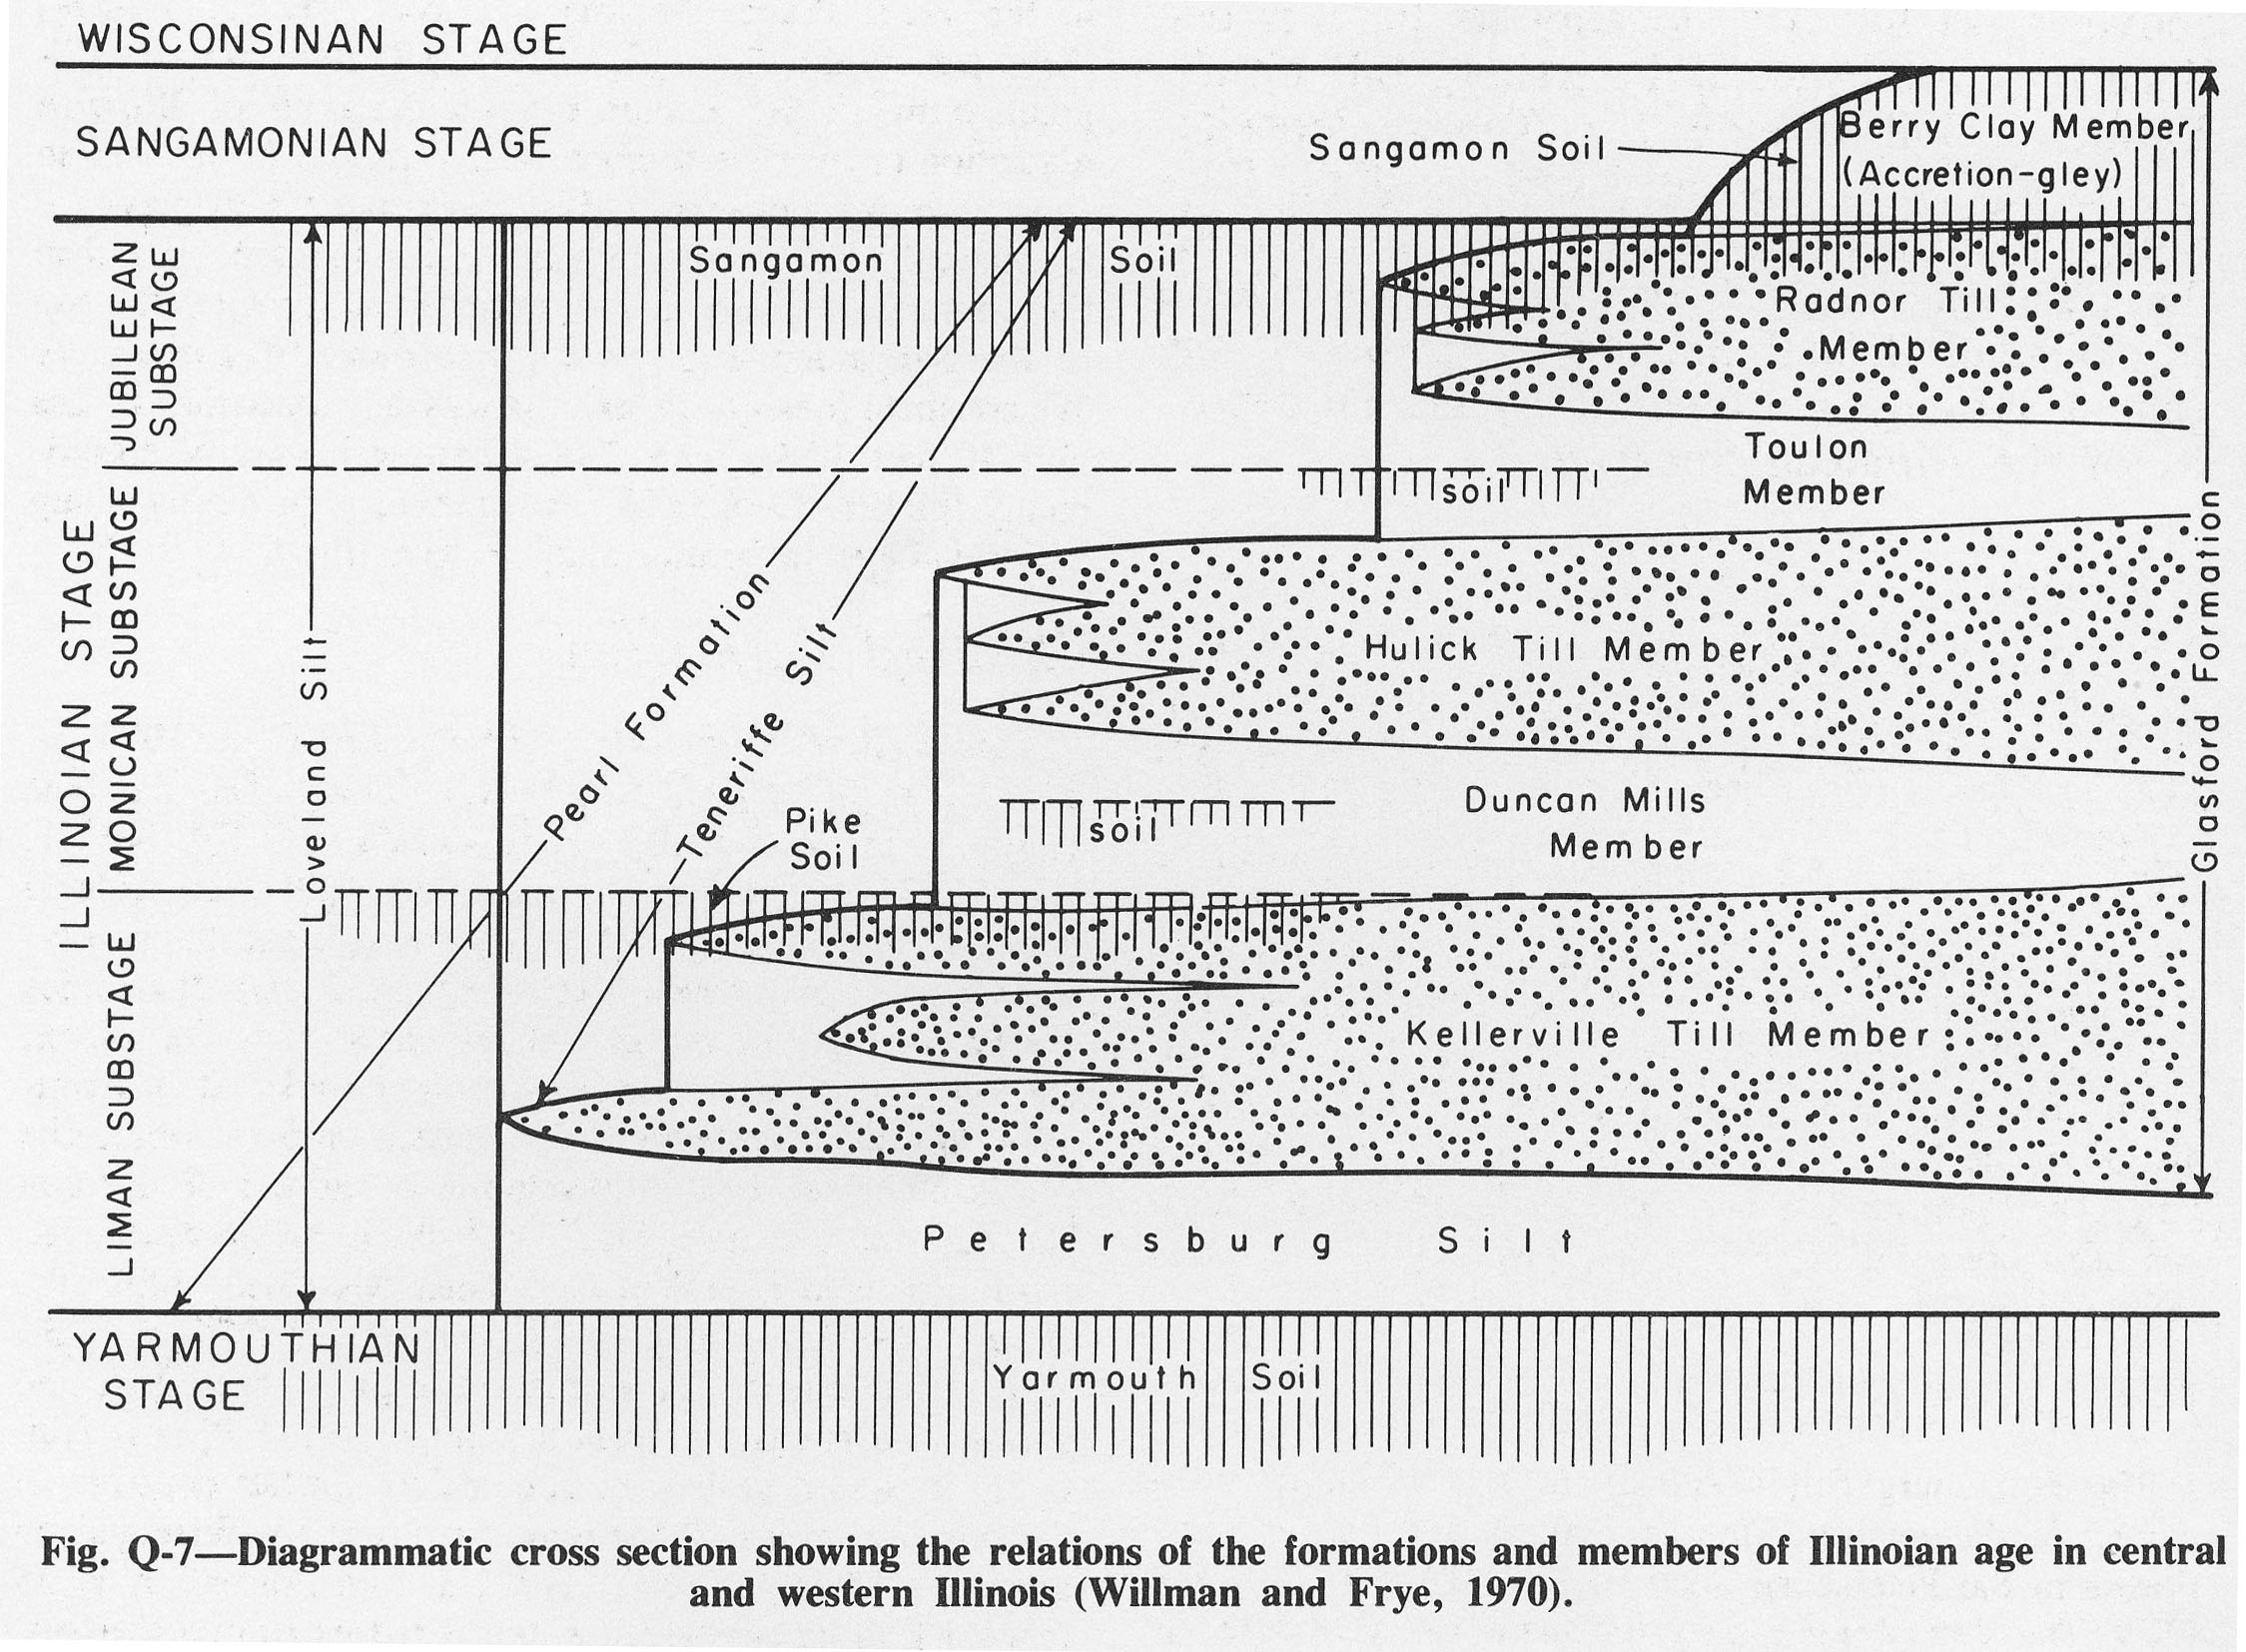
647 KB | Fig. Q-7 -- Diagrammatic cross section showing the relations of the formations and members of Illinoian age in central and western Illinois (Willman and Frye, 1970). | 1 |
| 15:53, 4 April 2016 | Figure Q-6.jpg (file) |  |
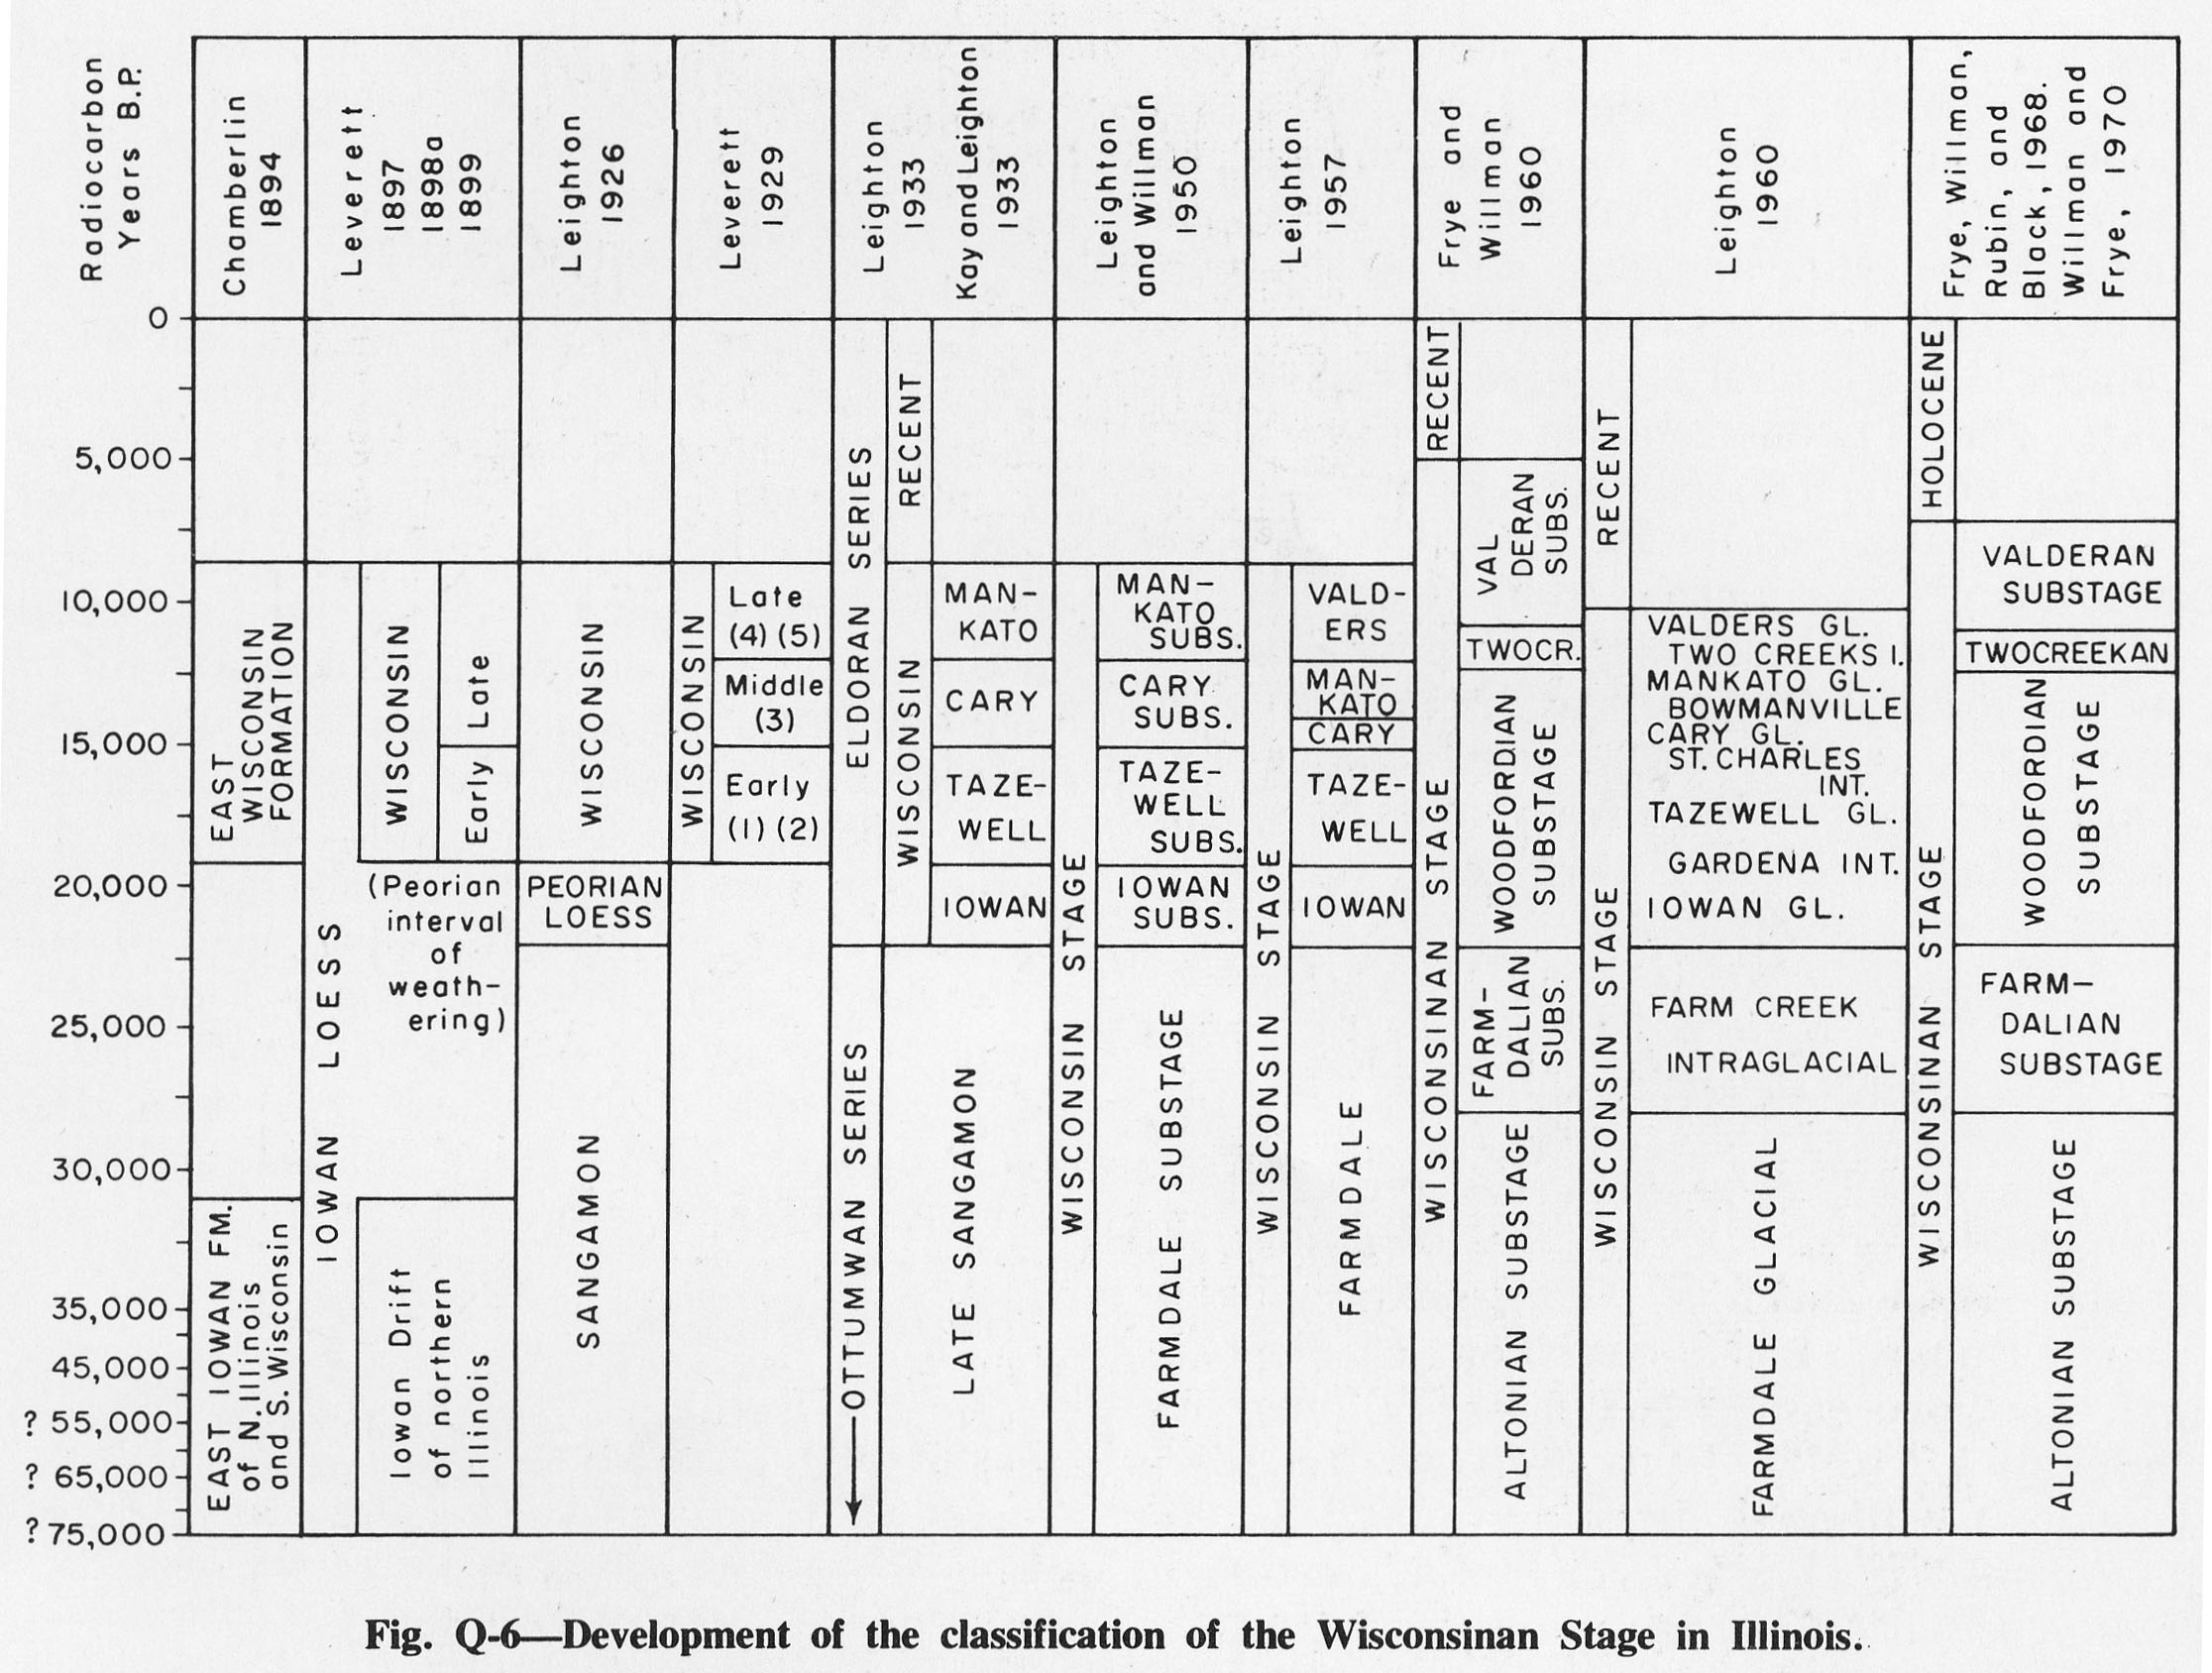
477 KB | Fig. Q-6 -- Development of classification of the Wisconsinan Stage in Illinois. | 1 |
| 15:53, 4 April 2016 | Figure Q-5.jpg (file) |  |
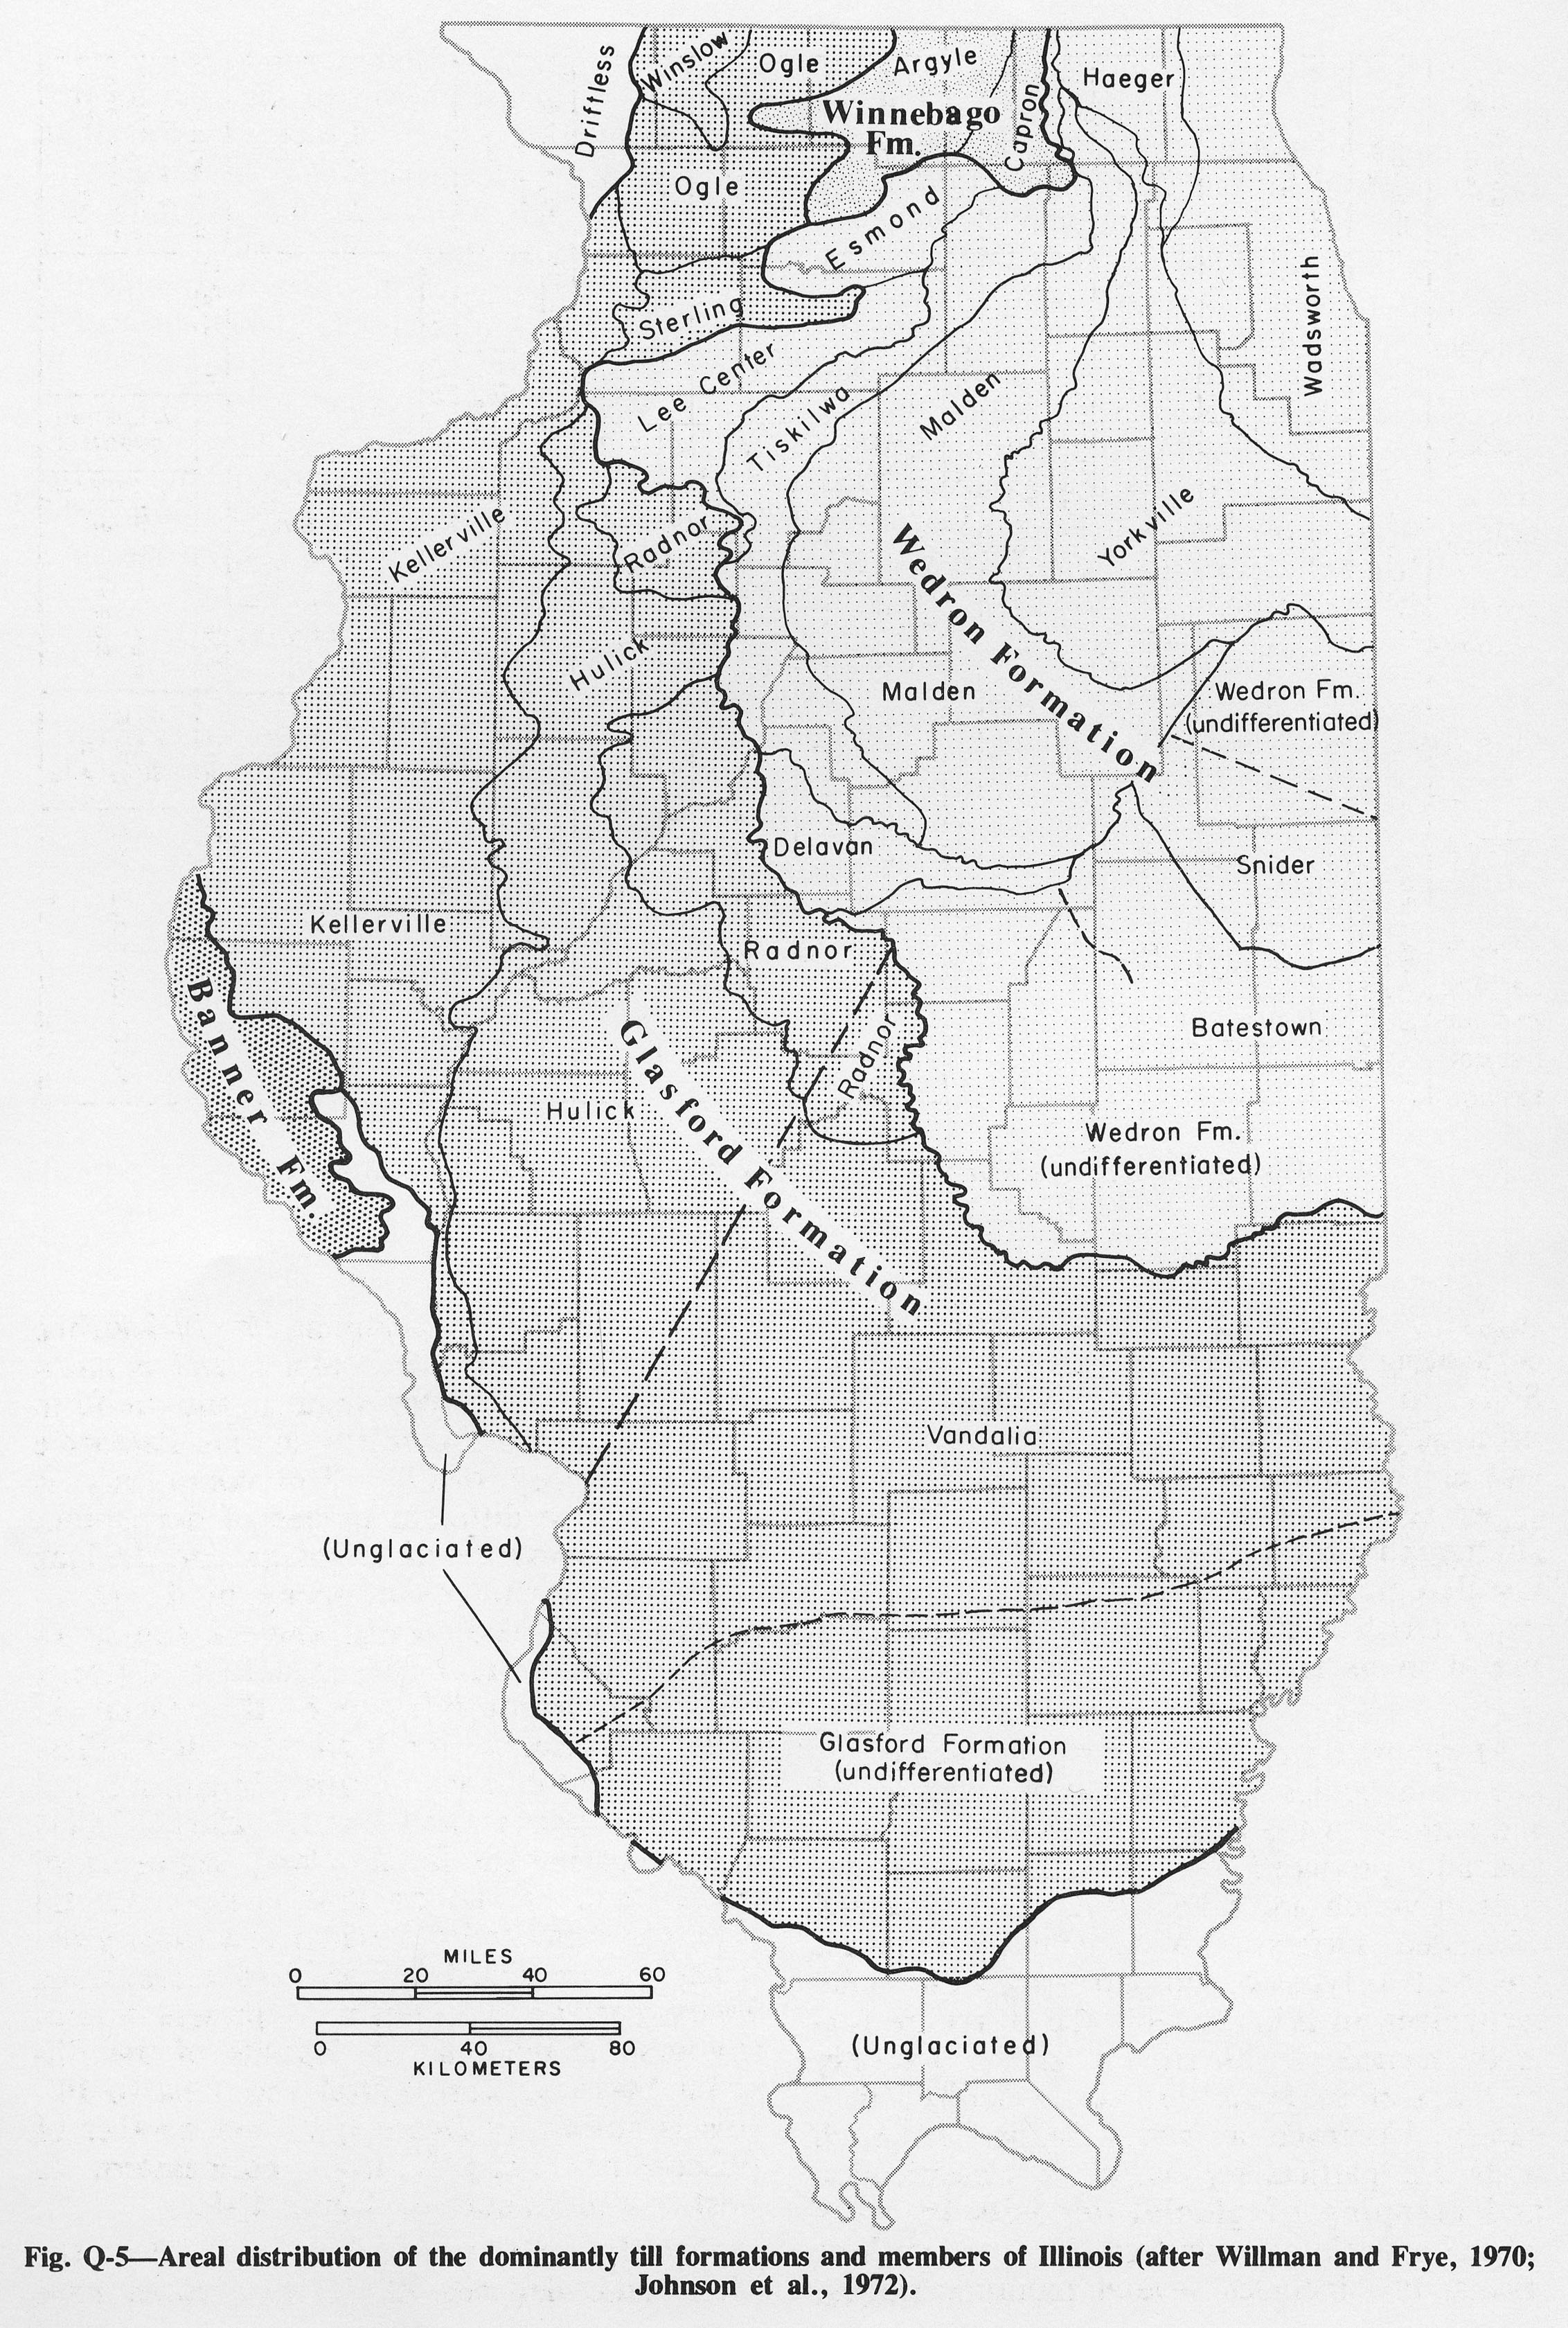
1.68 MB | Fig. Q-5 -- Areal distribution of the dominantly till formations and members of Illinois (after Willman and Frye, 1970; Johnson et al., 1972). | 1 |
| 15:51, 4 April 2016 | Figure Q-4.jpg (file) |  |
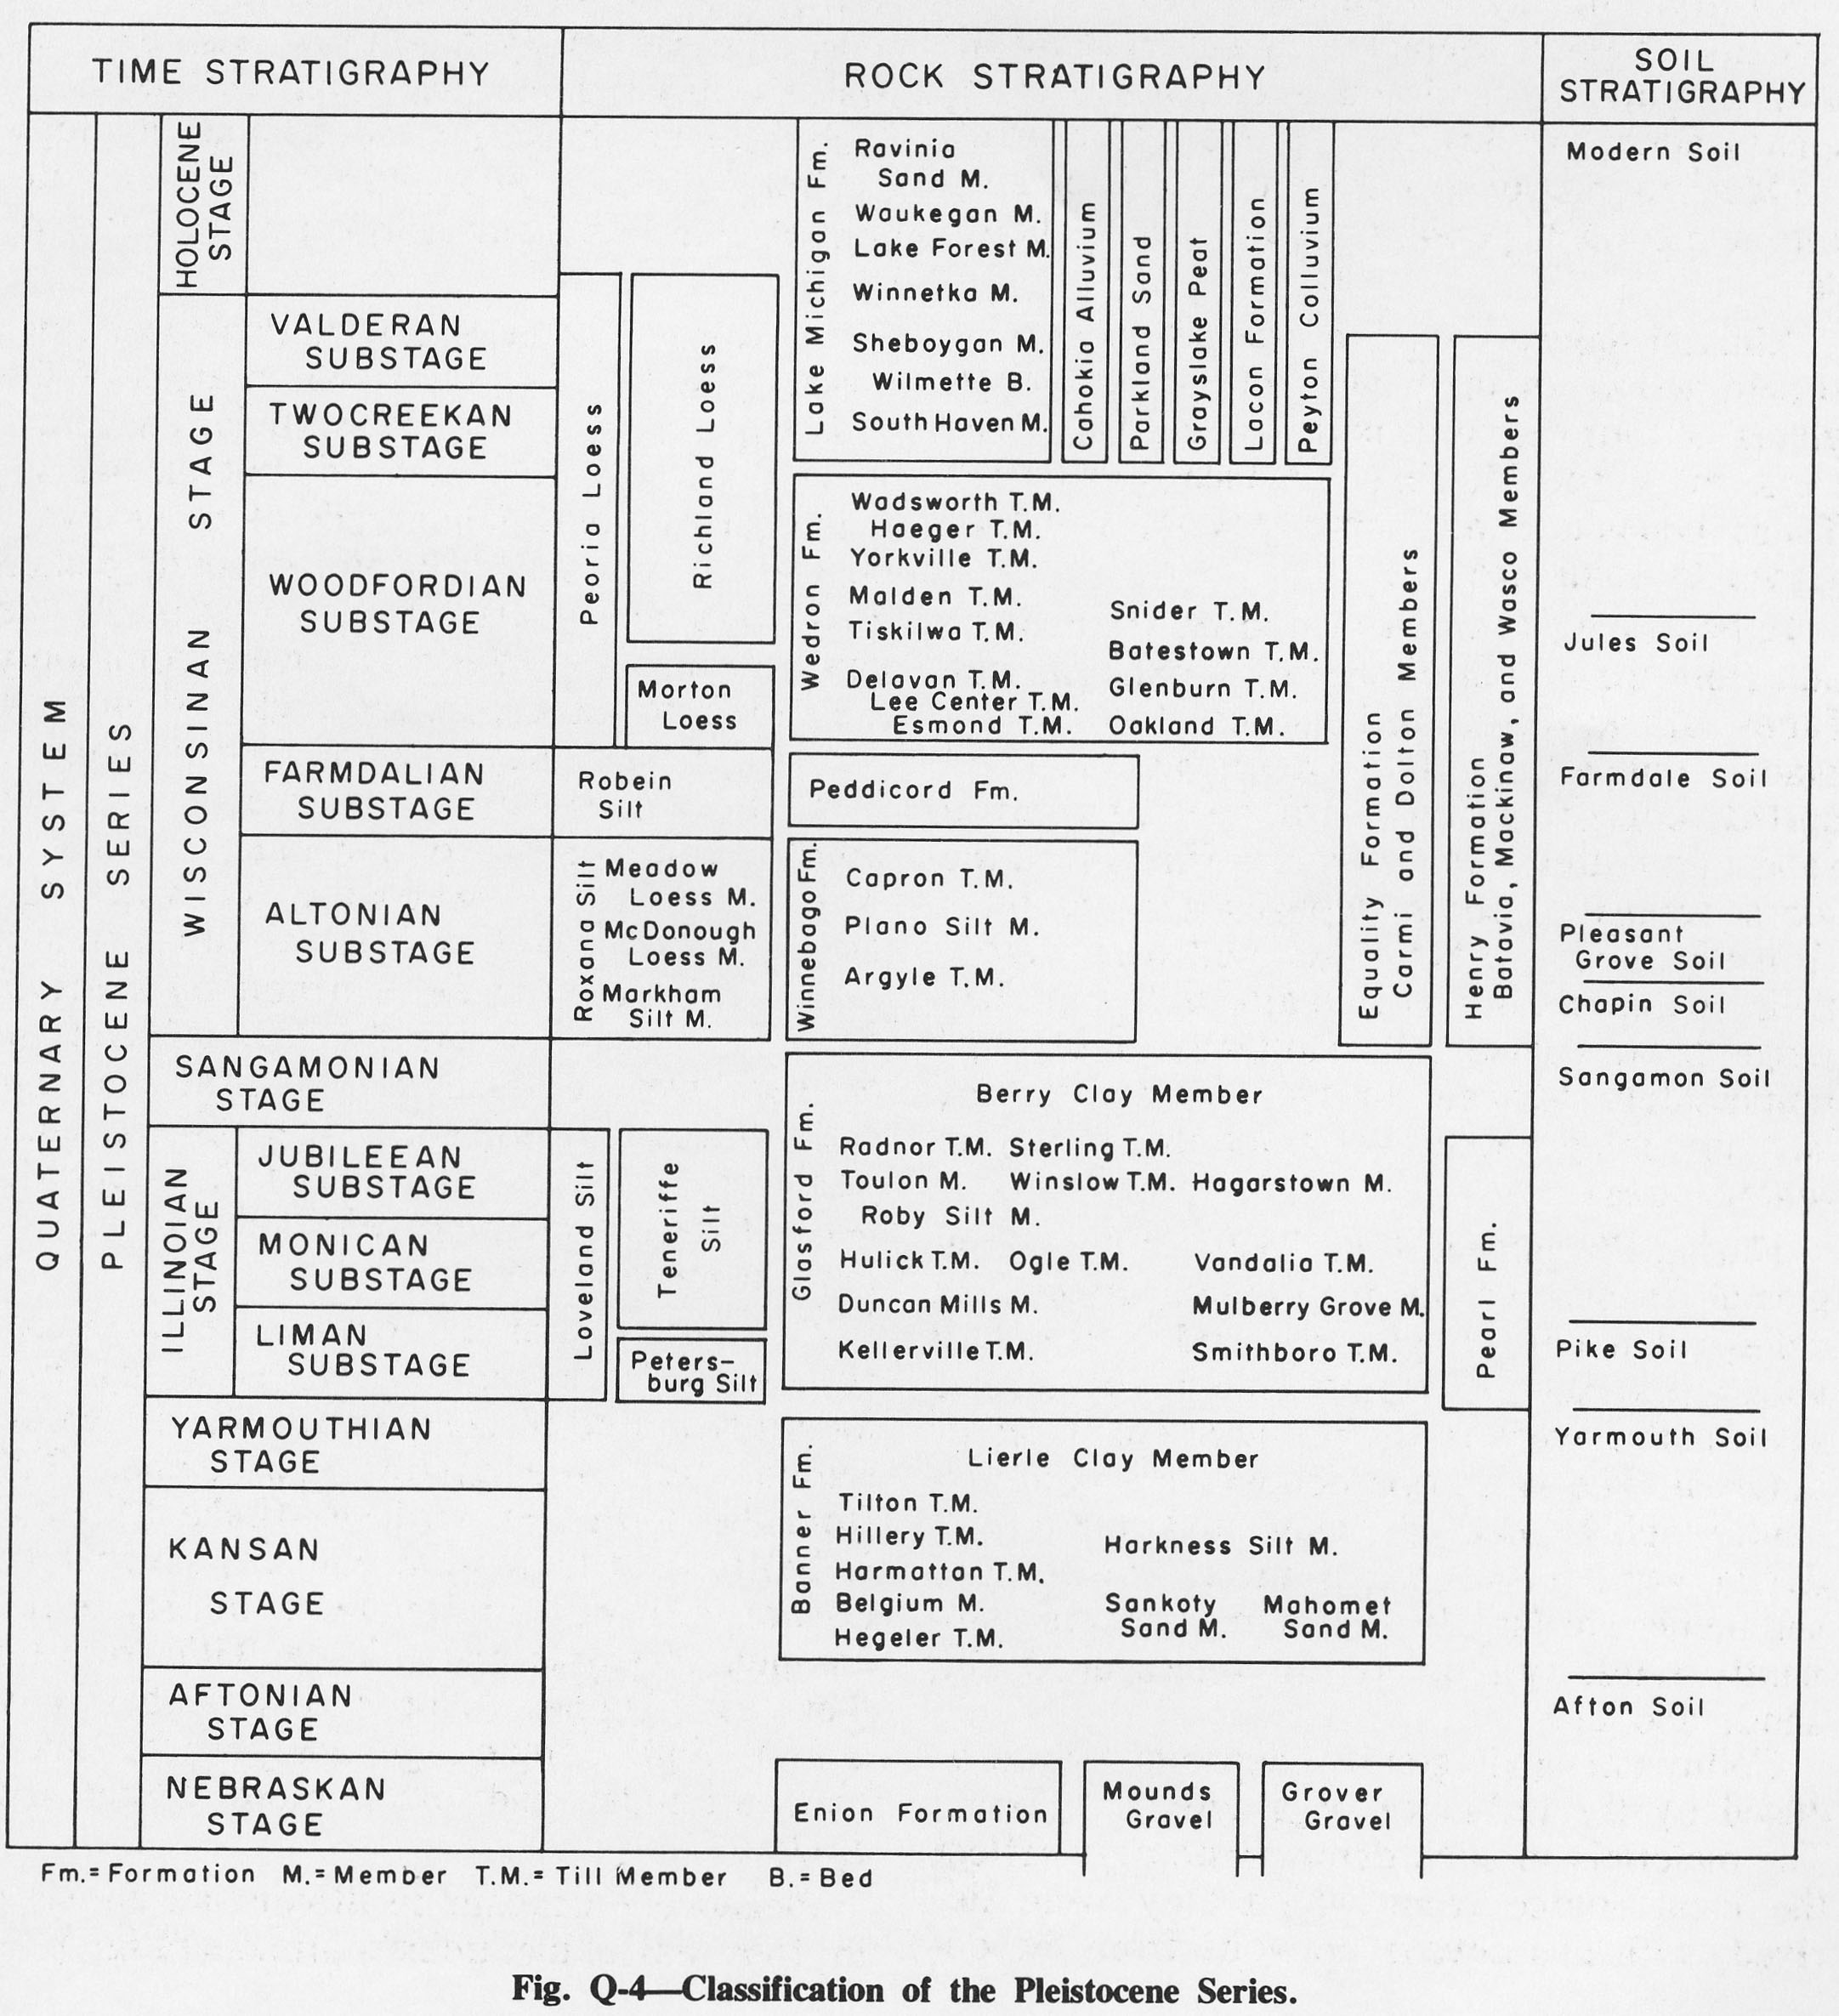
613 KB | Fig. Q-4 -- Classification of the Pleistocene Series. | 1 |
| 15:42, 4 April 2016 | Figure Q-3.jpg (file) |  |
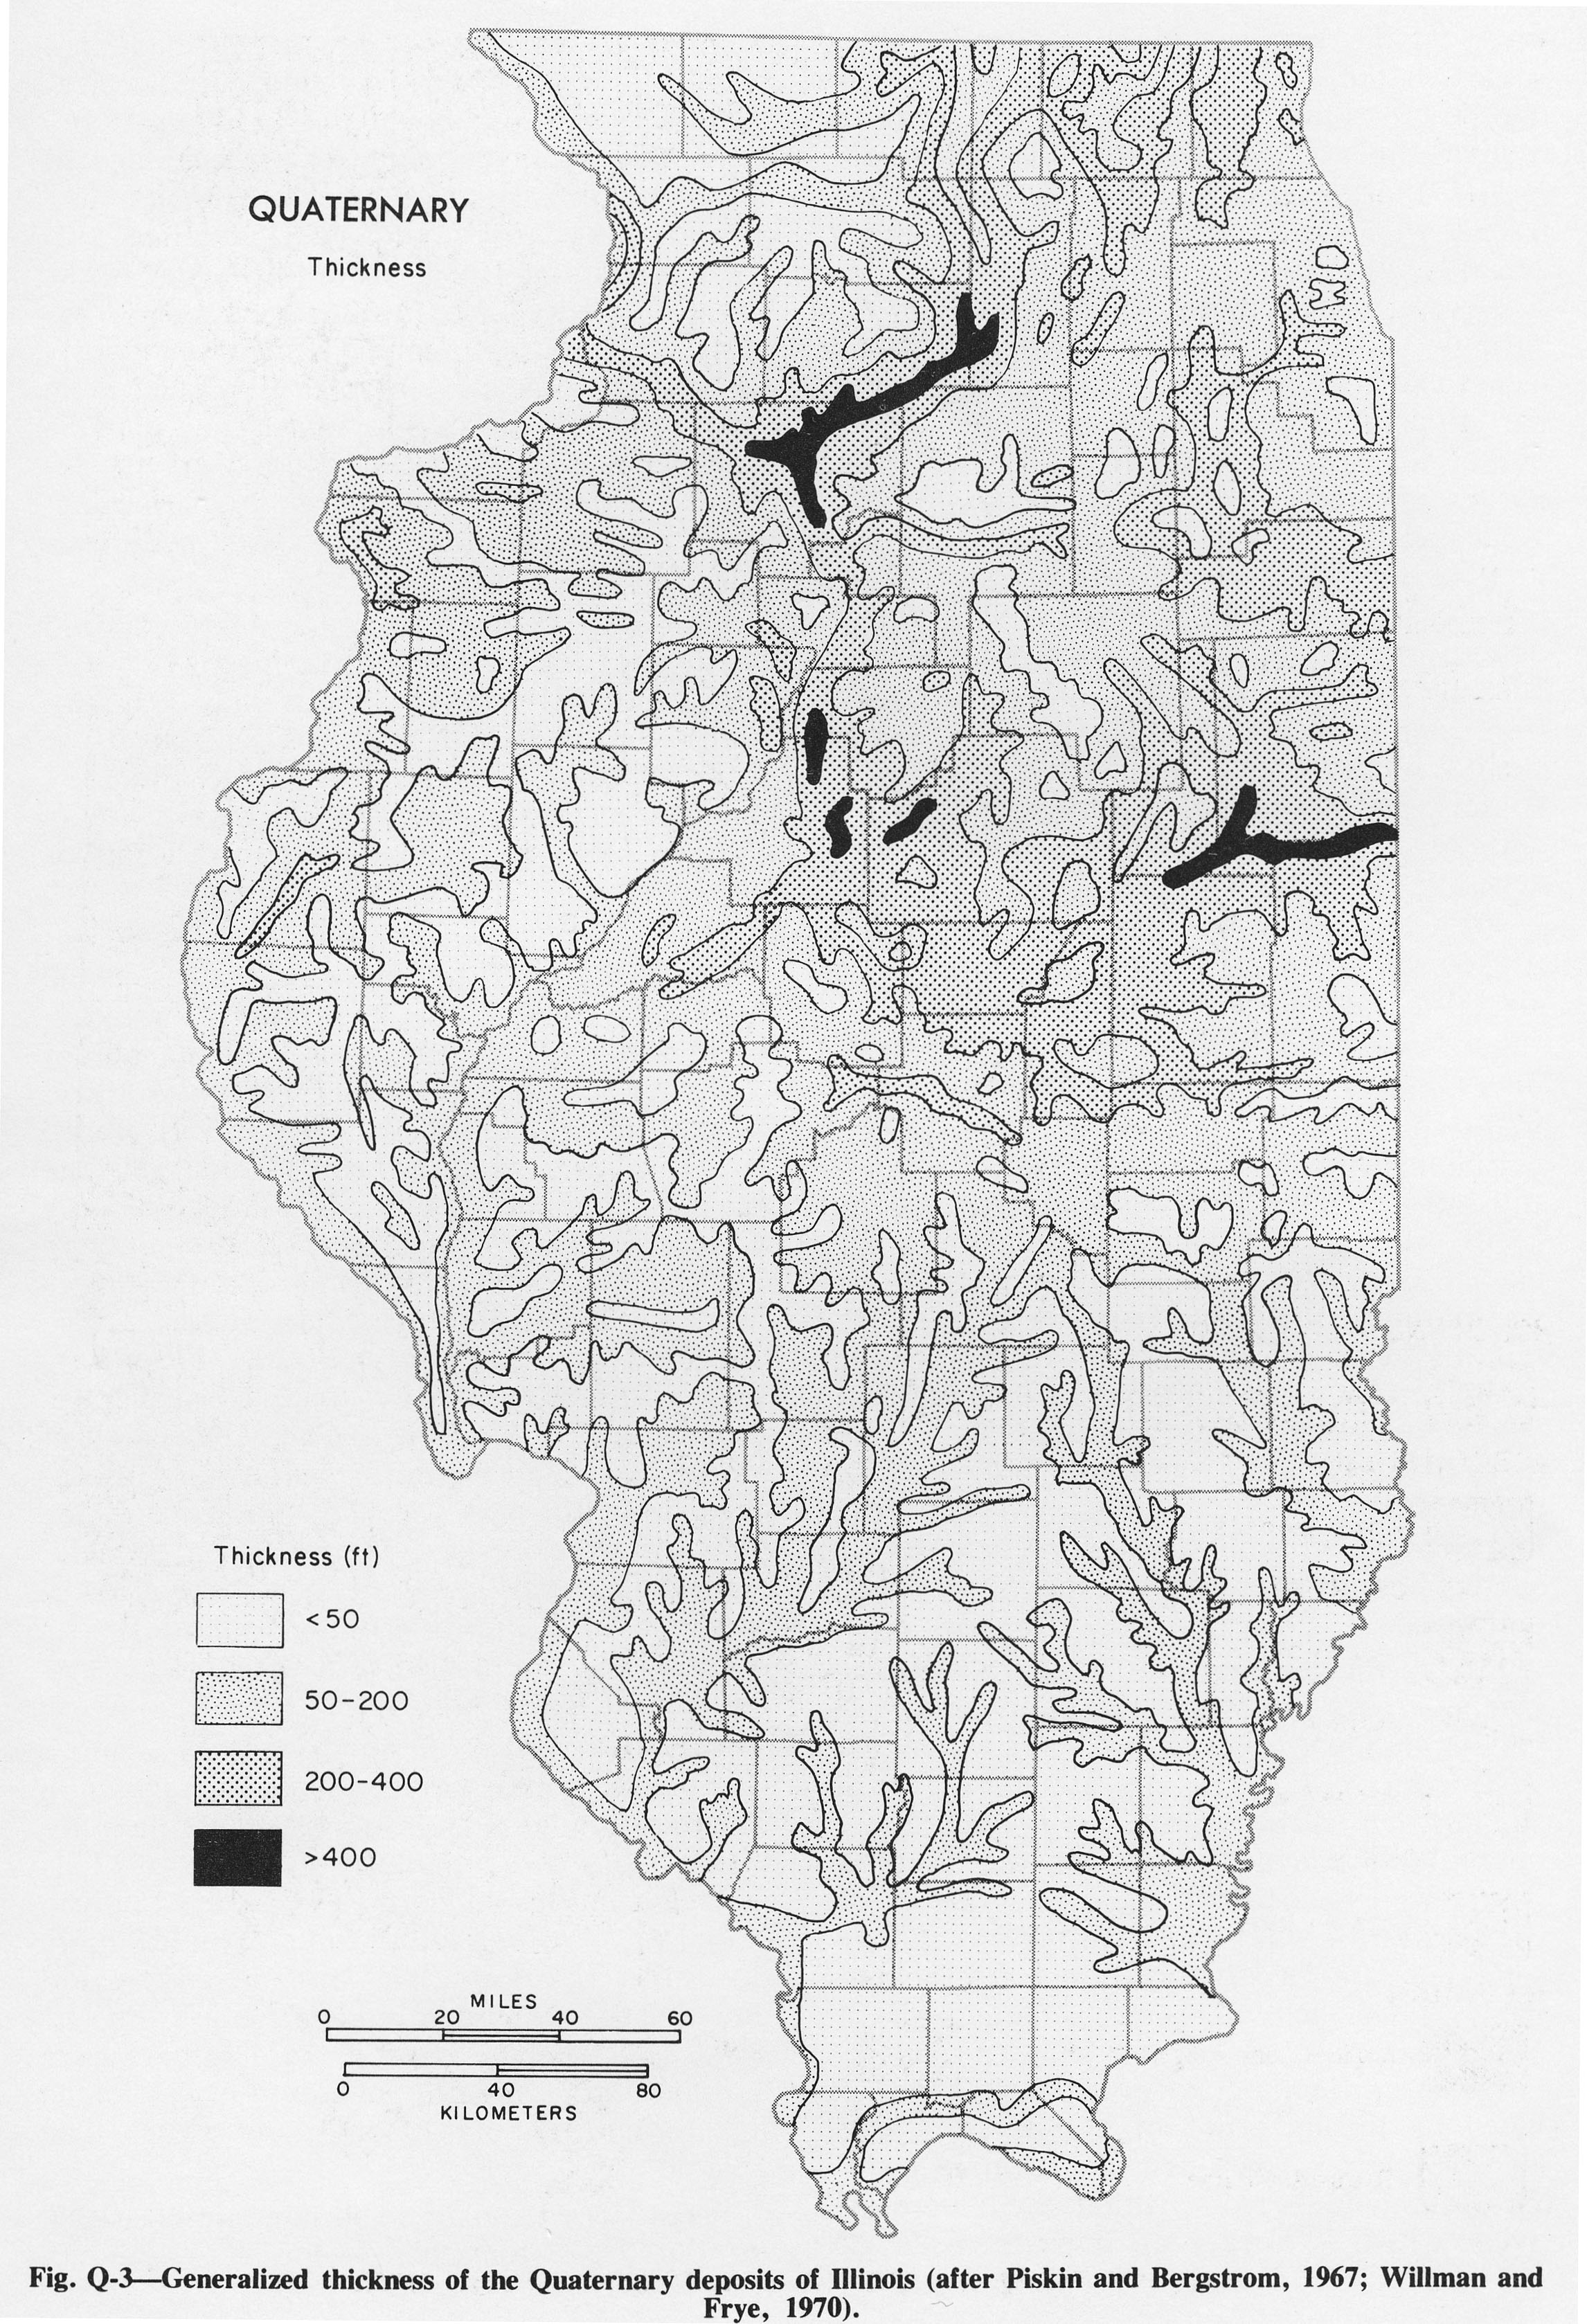
1.55 MB | Fig. Q-3 -- Generalized thickness of the Quaternary deposits of Illinois (after Piskin and Bergstrom, 1967; Willman and Frye, 1970). | 1 |
| 15:41, 4 April 2016 | Figure Q-2.jpg (file) |  |
1.76 MB | Fig. Q-2 -- Glacial map of Illinois (after Willman and Frye, 1970). | 1 |
| 15:14, 4 April 2016 | Figure Pc-1.jpg (file) |  |
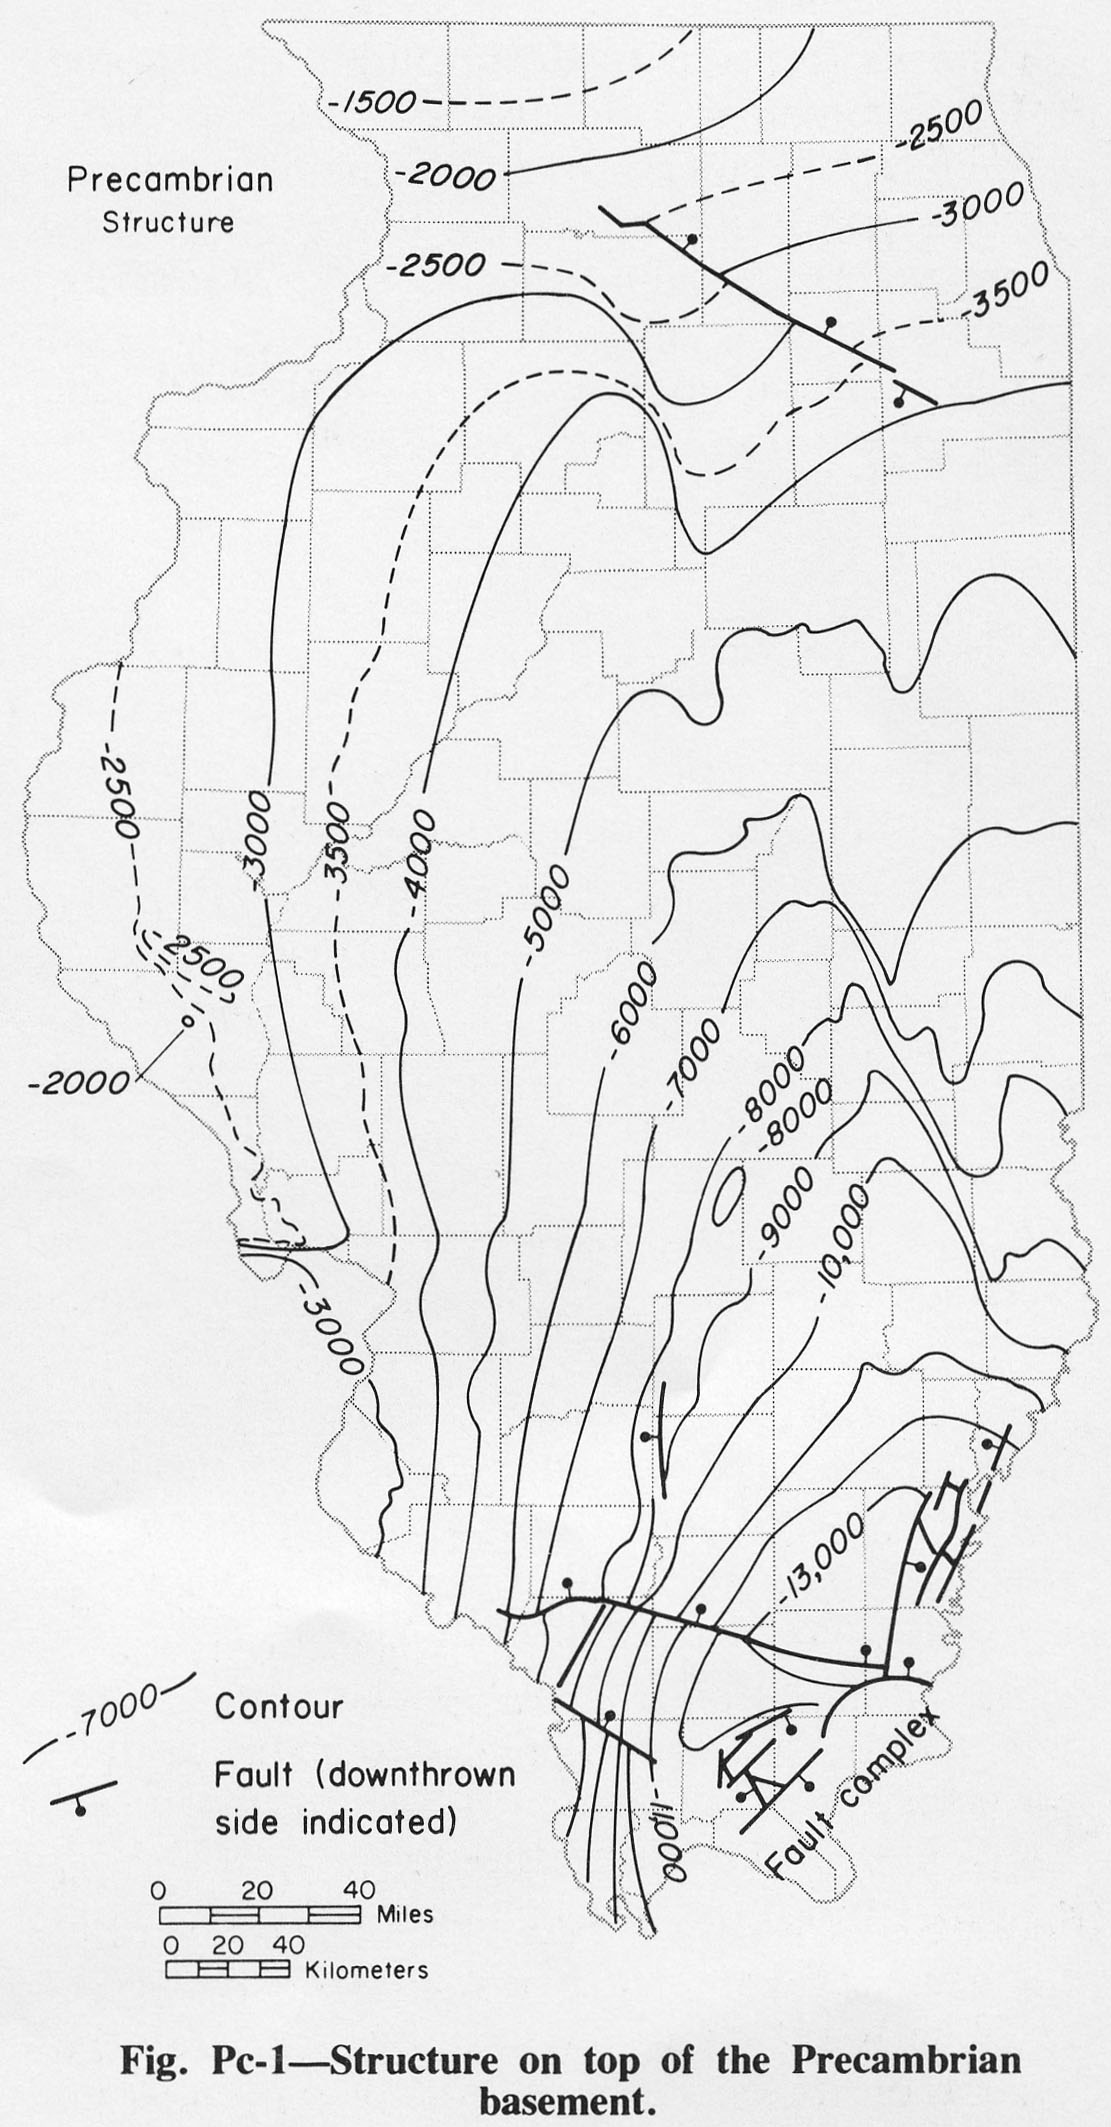
328 KB | Fig. Pc-1 -- Structure on top of the Precambrian basement. | 1 |
| 15:13, 4 April 2016 | Figure O-27.jpg (file) |  |
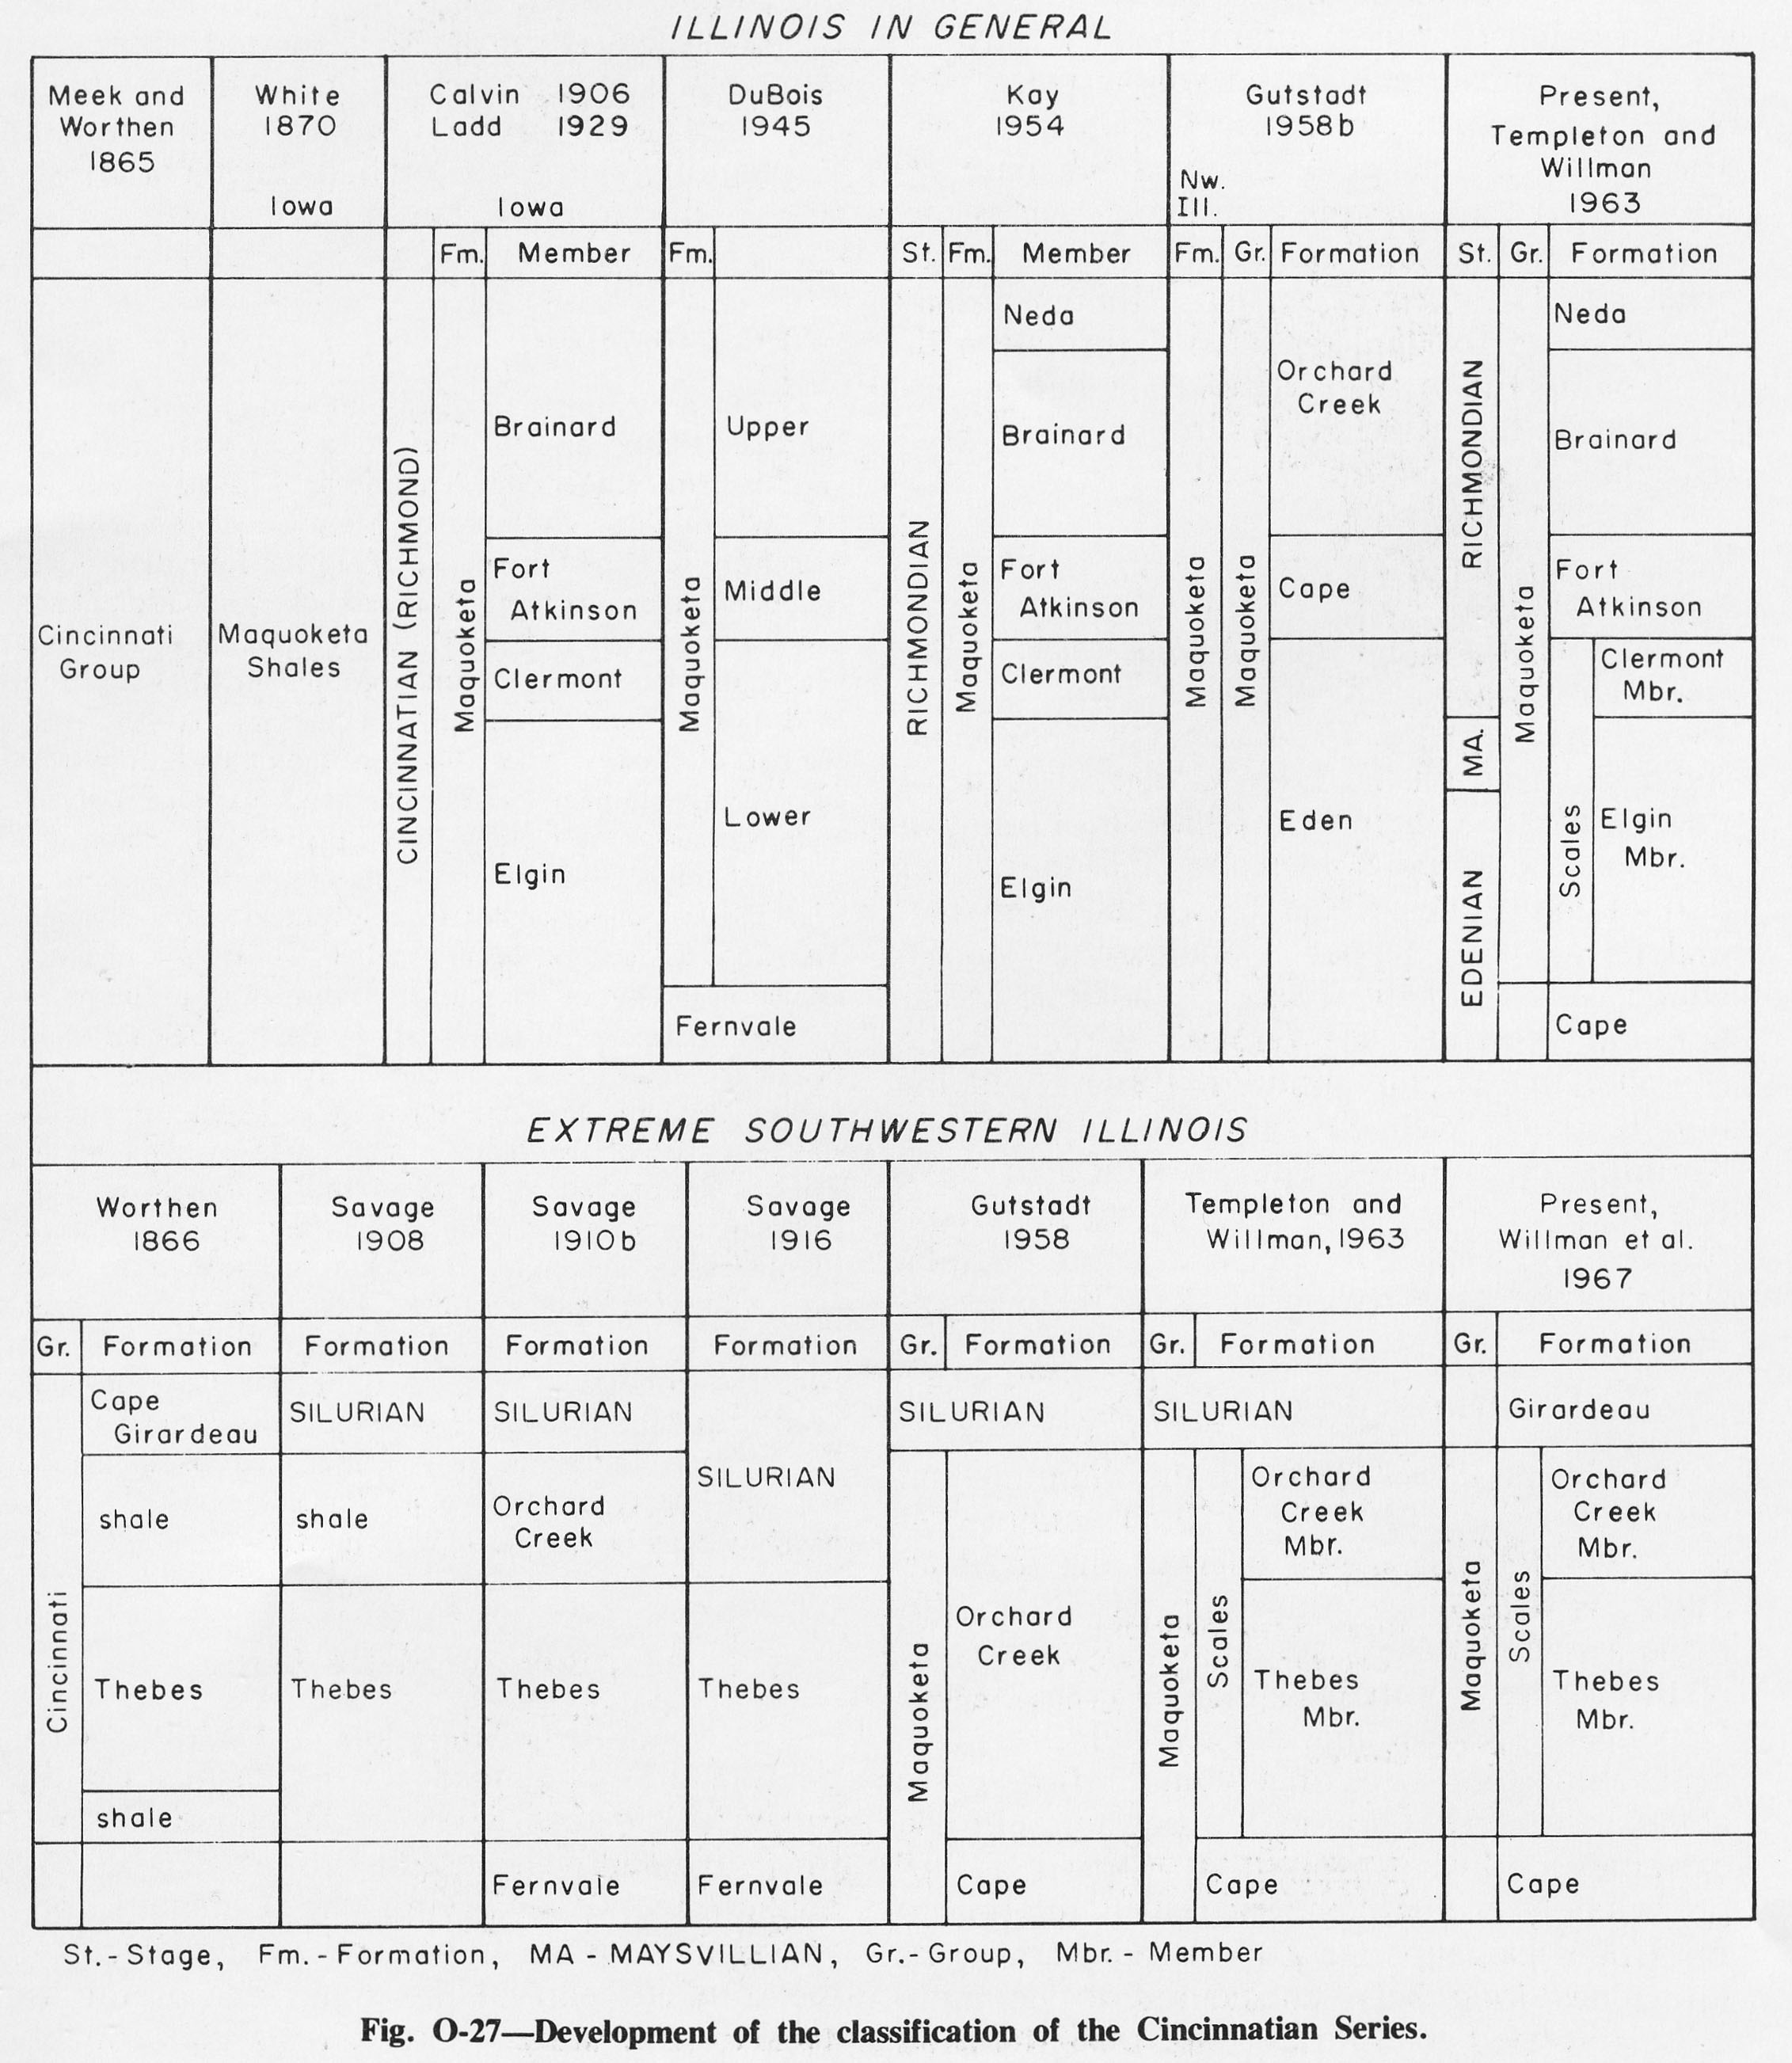
605 KB | Fig. O-27 -- Development of the classification of the Cincinnatian Series. | 1 |
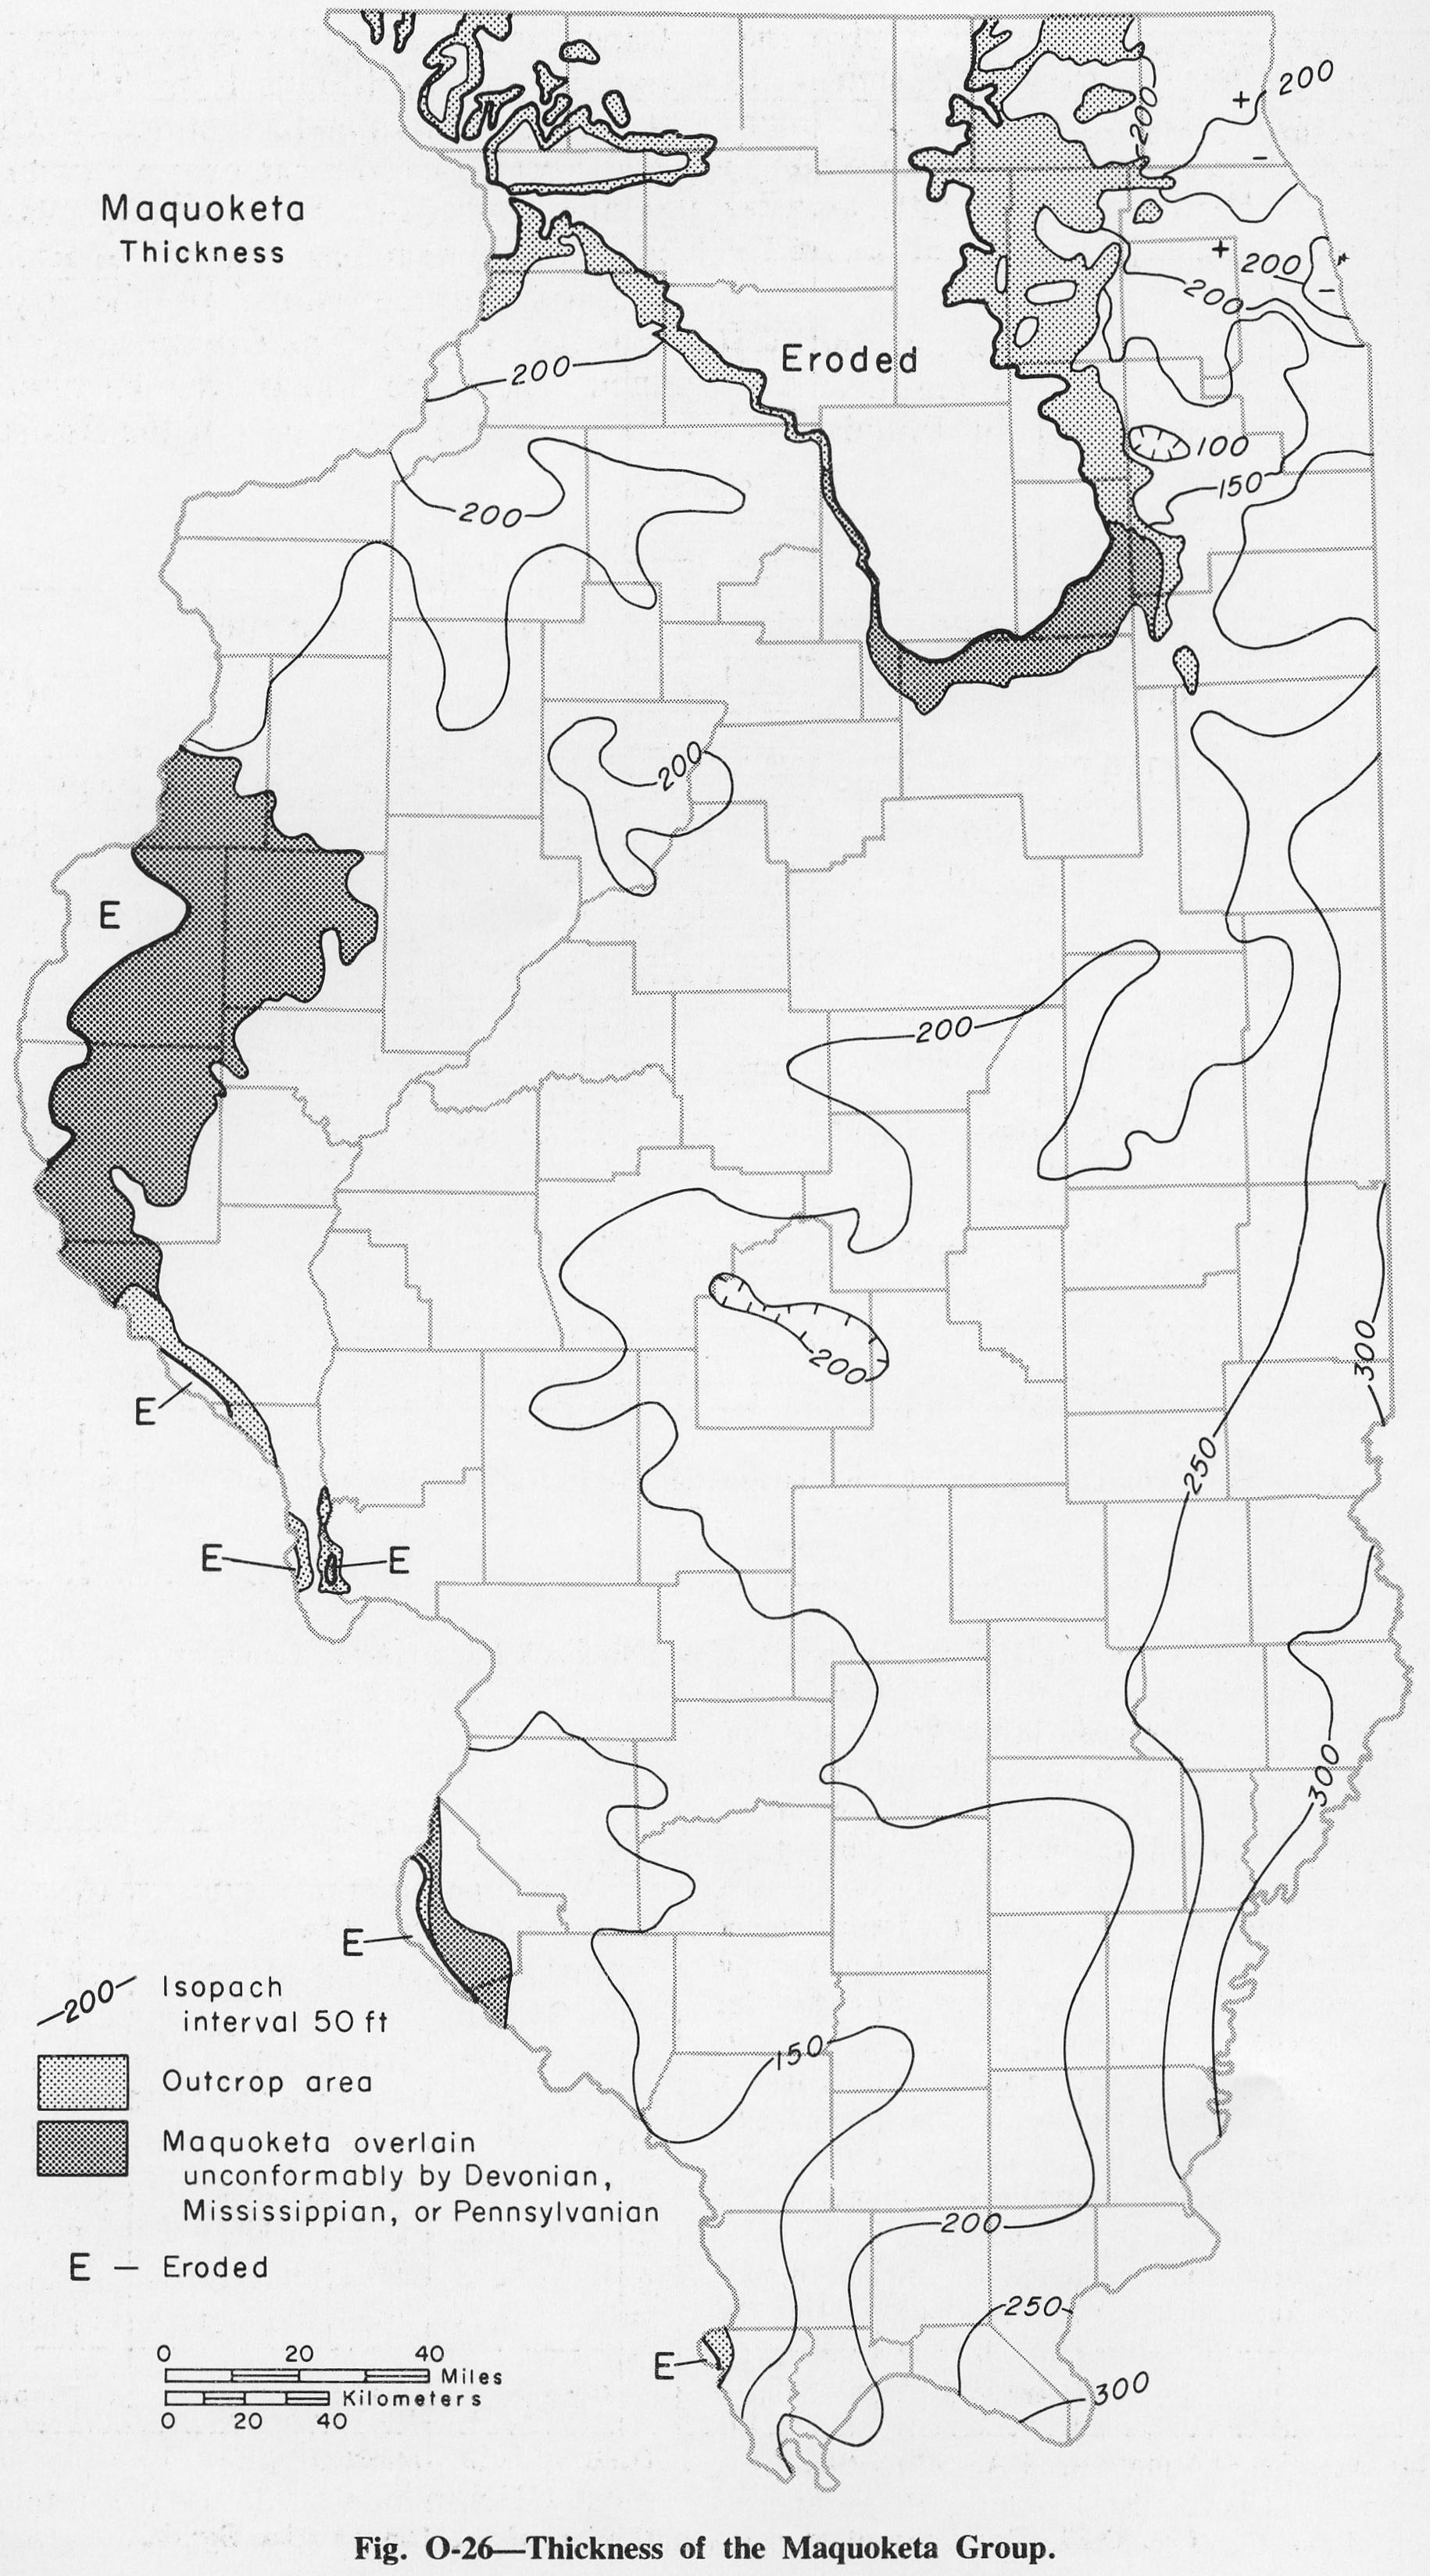
| 15:11, 4 April 2016 | Figure O-26.jpg (file) |  |
752 KB | Fig O-26 -- Thickness of the Maquoketa Group. | 1 |
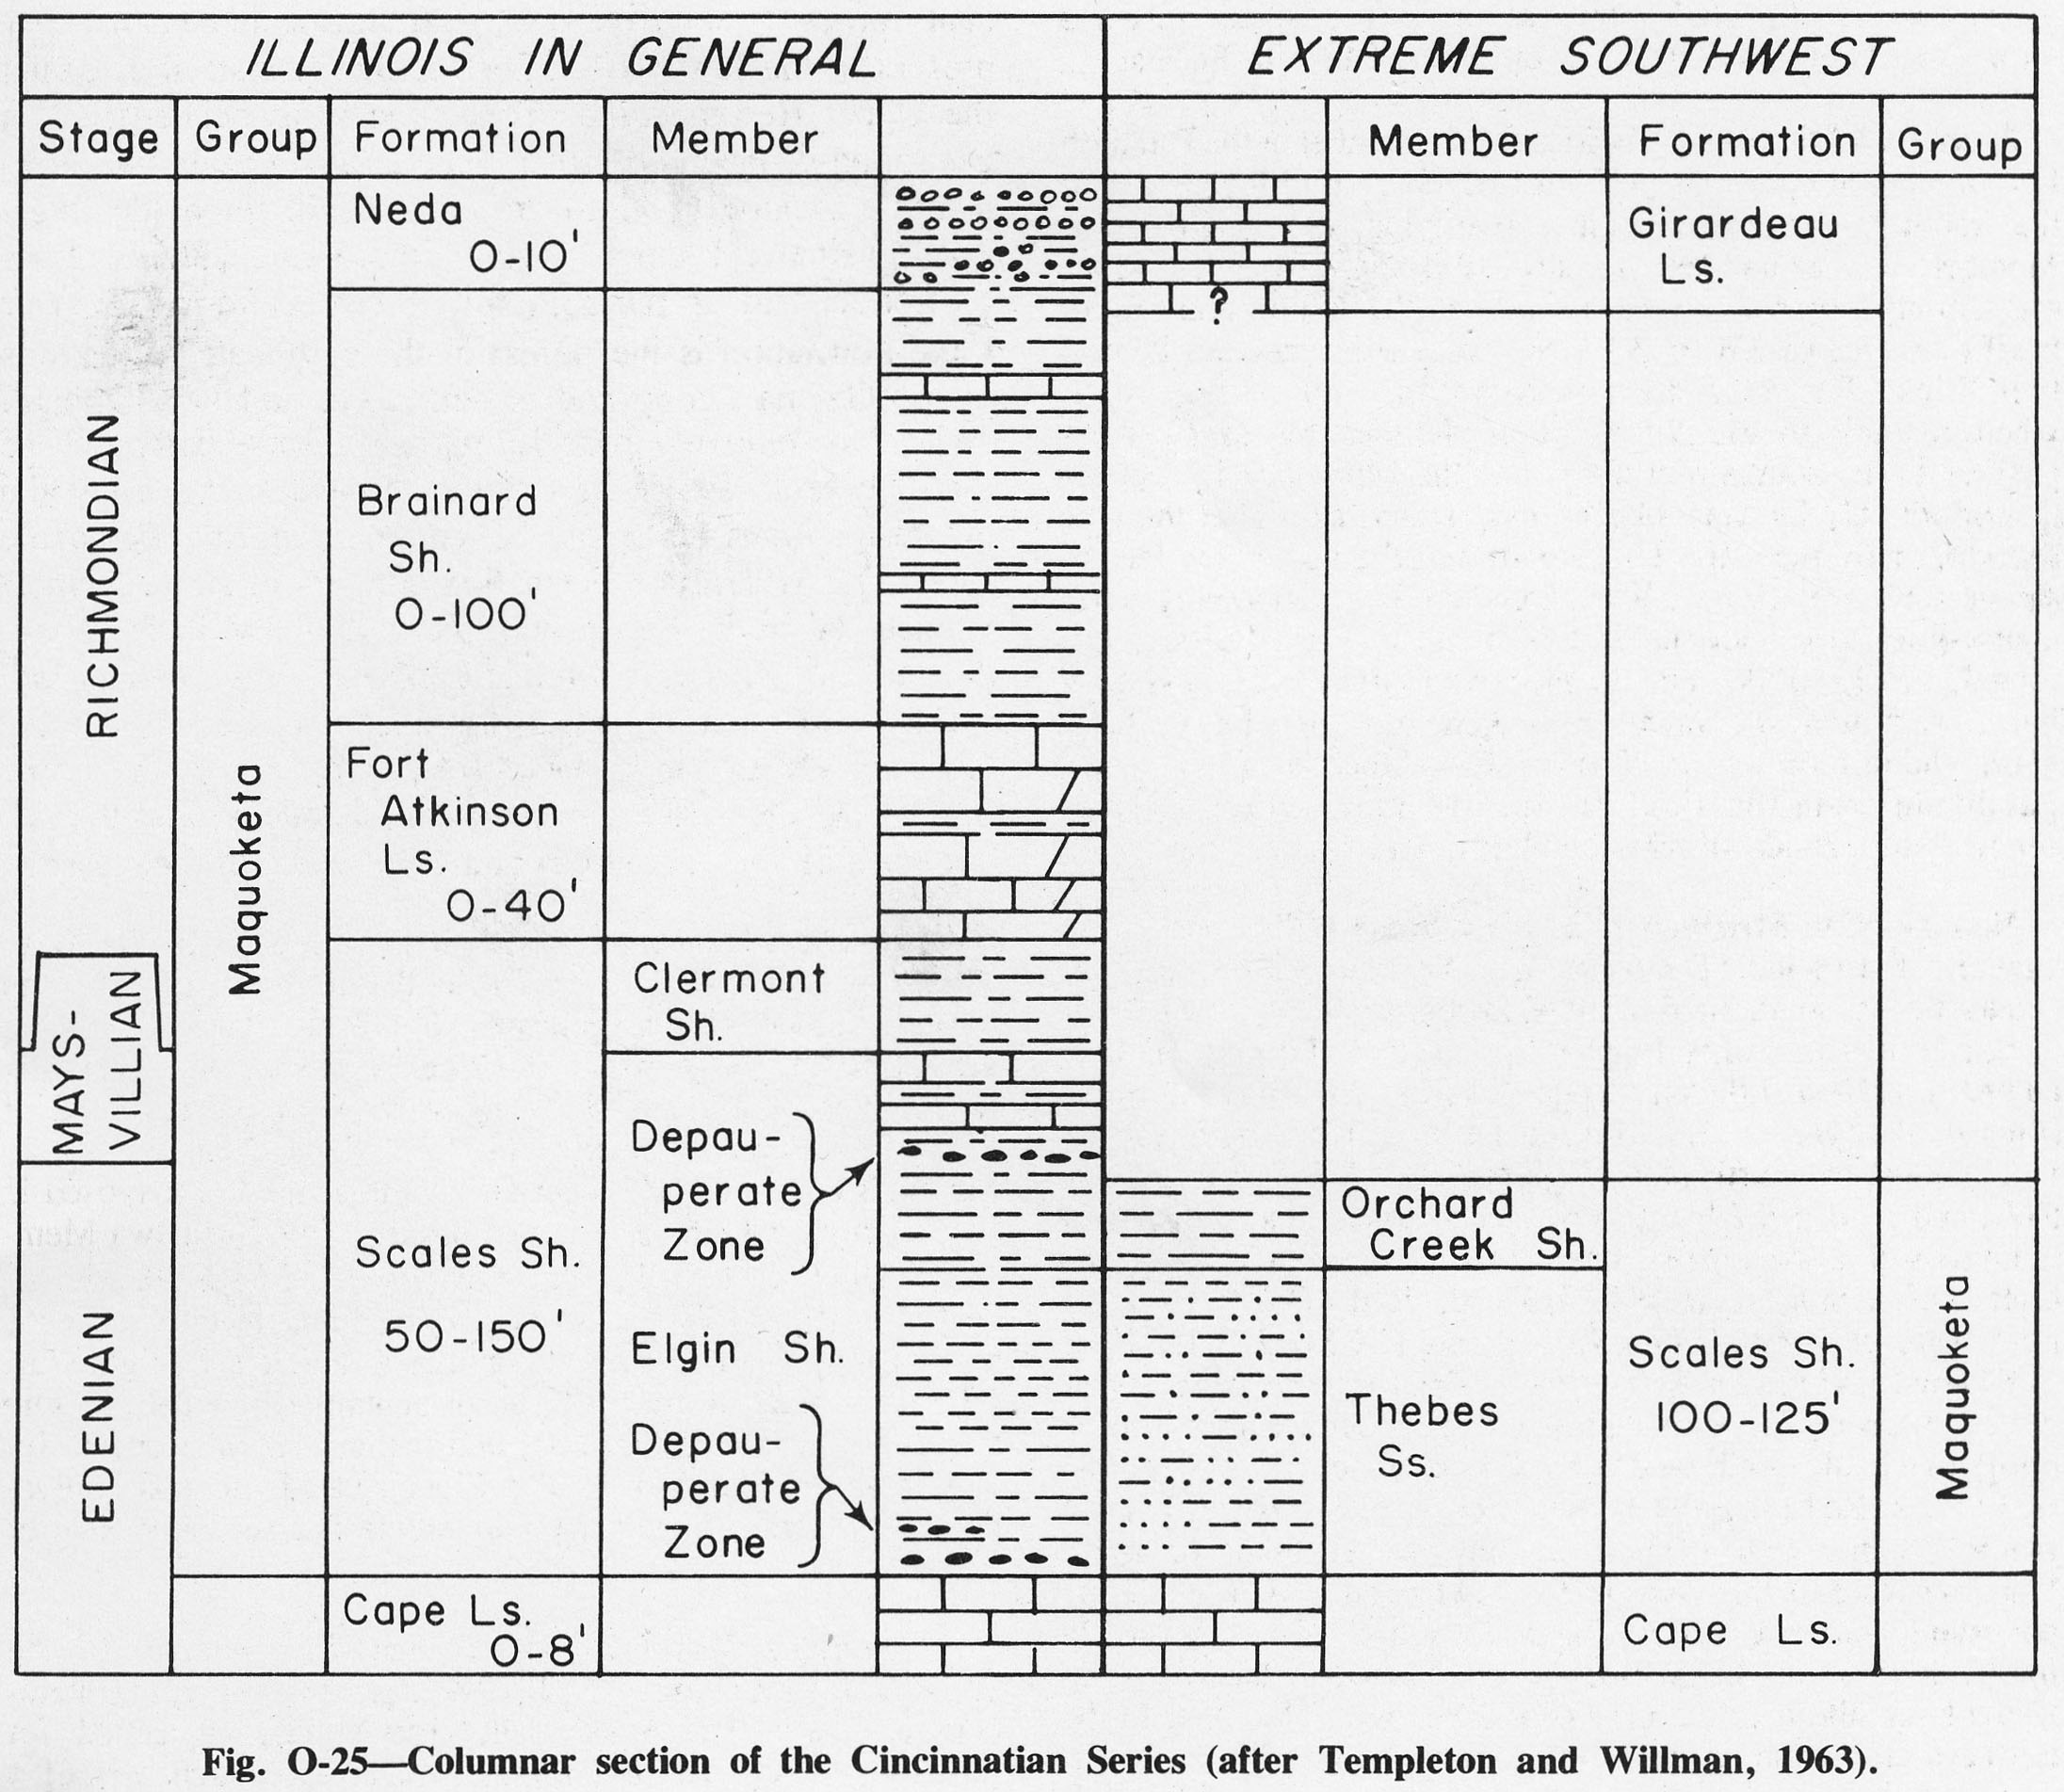
| 15:05, 4 April 2016 | Figure O-25.jpg (file) |  |
492 KB | Fig. O-25 -- Columnar section of the Cincinnatian Series (after Templeton and Willman, 1963). | 1 |
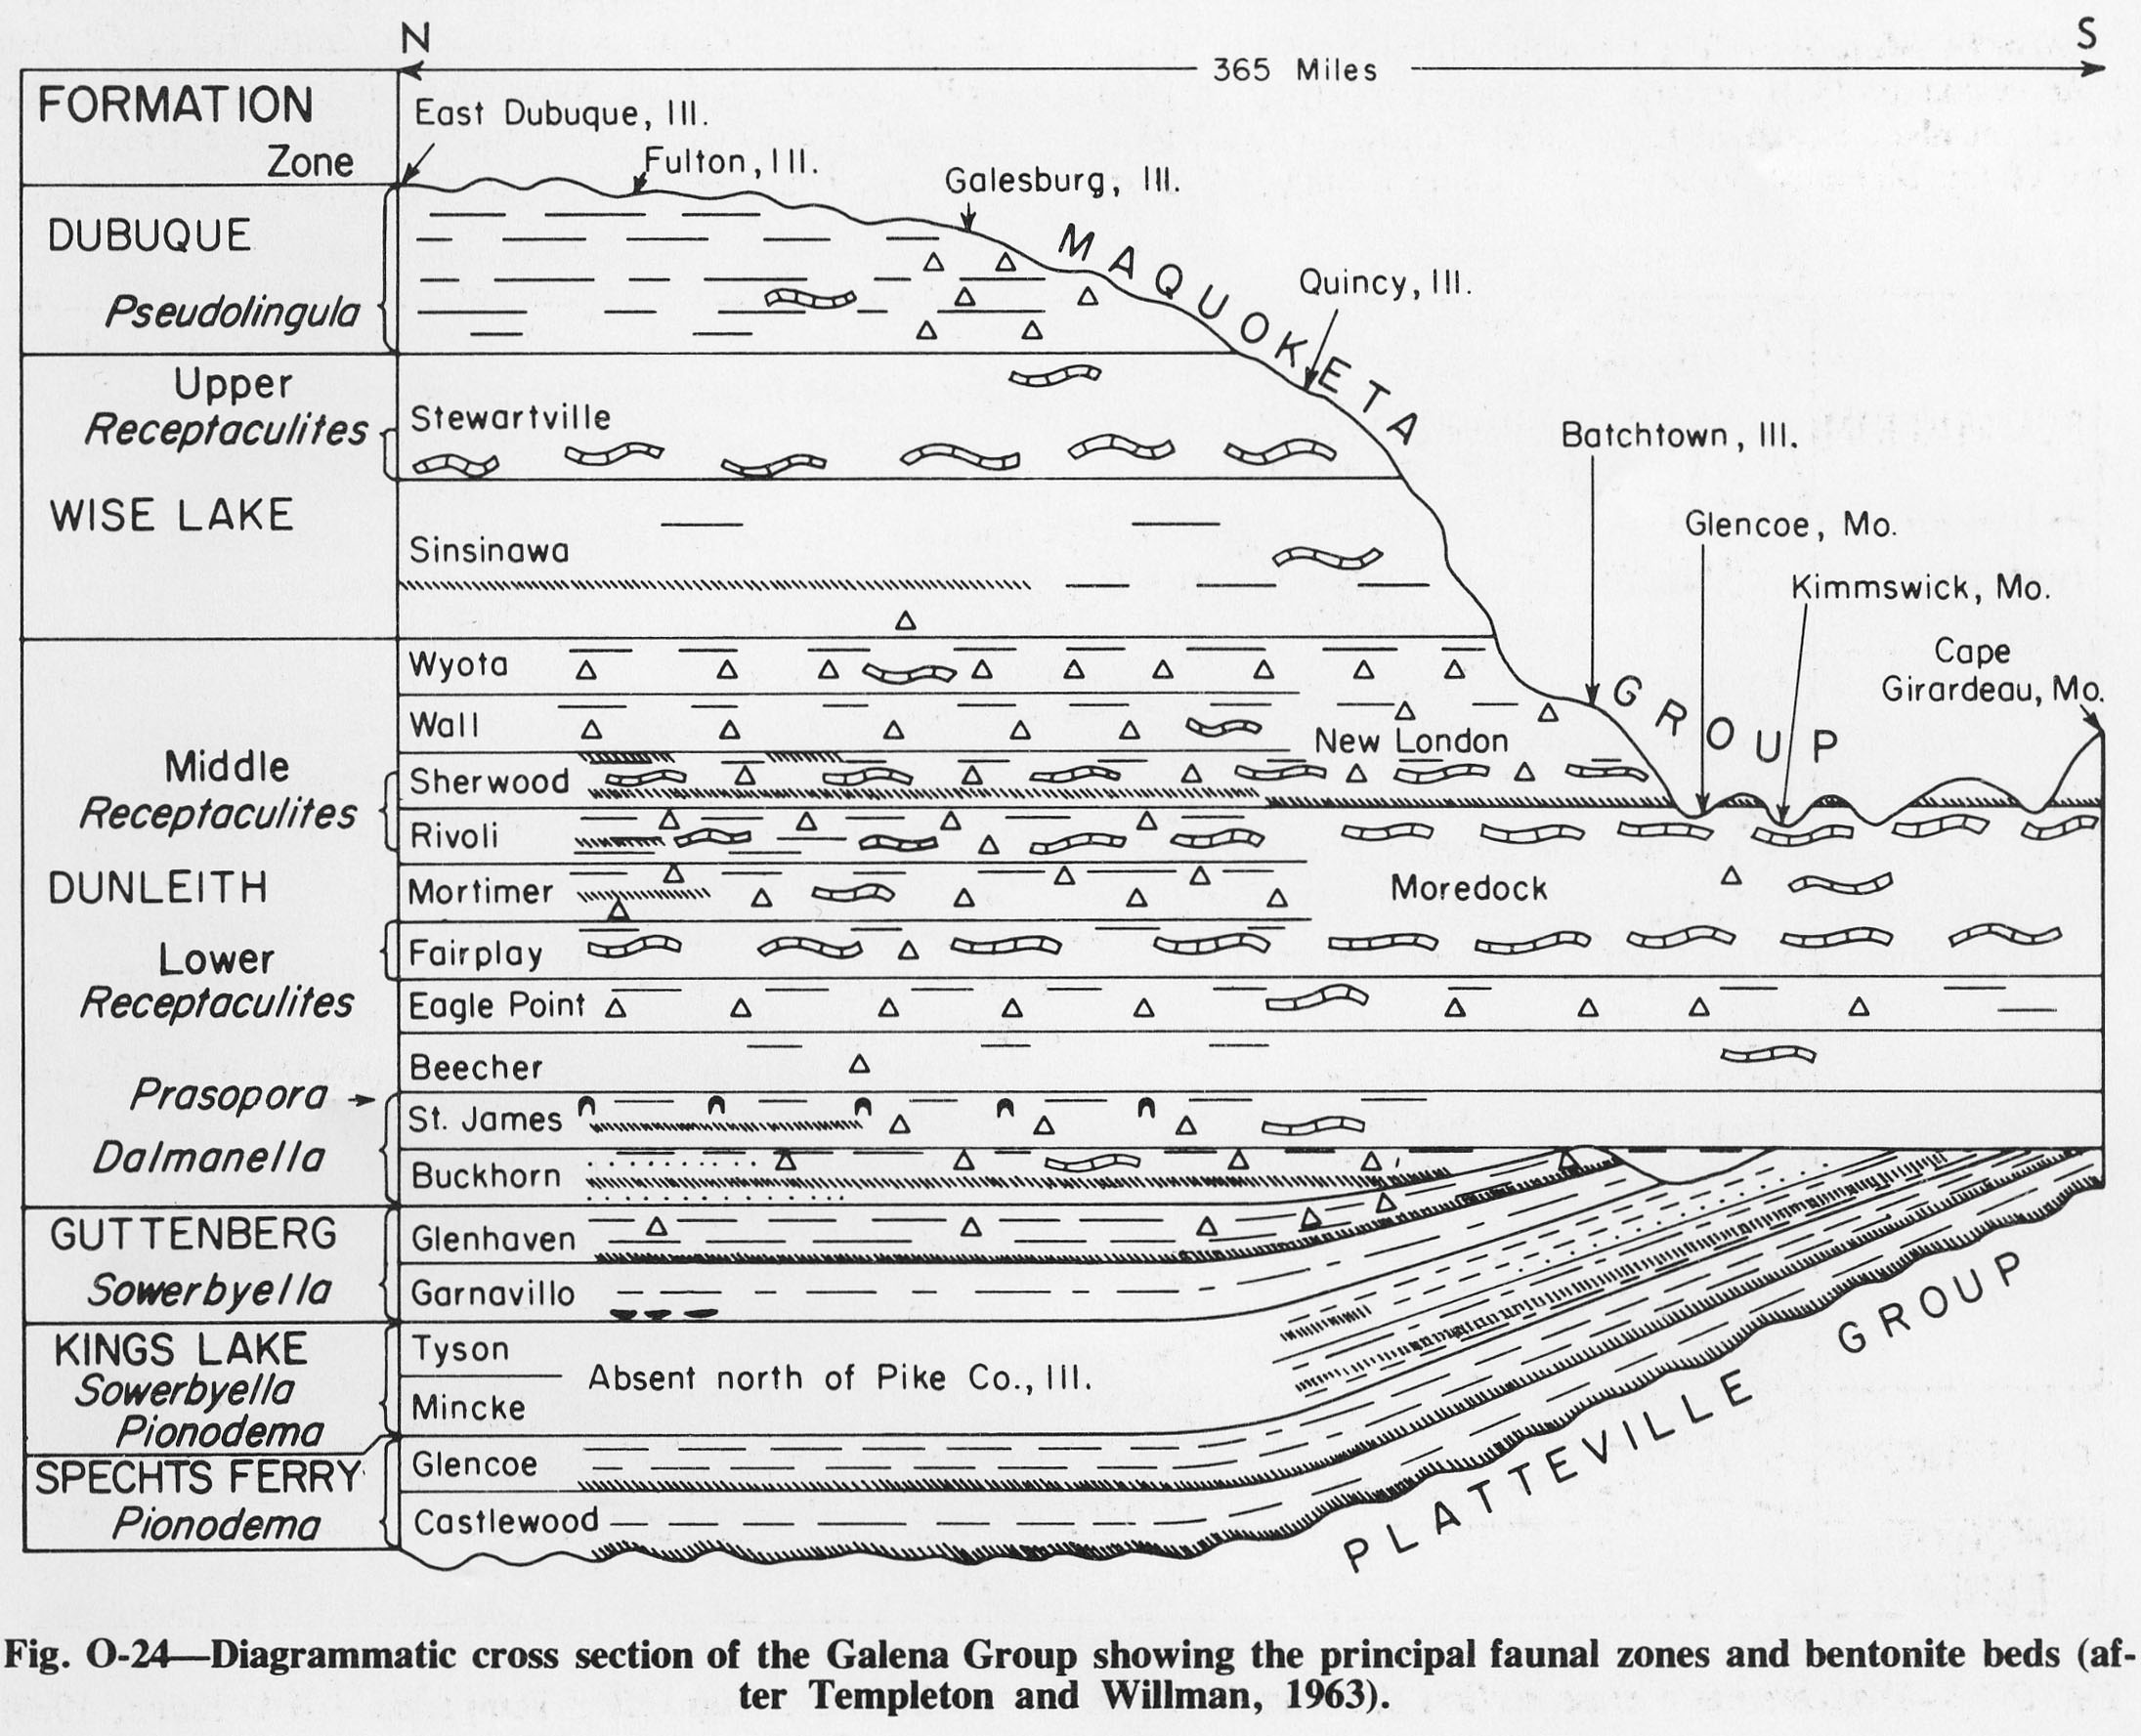
| 15:04, 4 April 2016 | Figure O-24.jpg (file) |  |
550 KB | Fig. O-24 -- Diagrammatic cross section of the Galena Group showing the principal faunal zones and bentonite beds (after Templeton and Willman, 1963). | 1 |
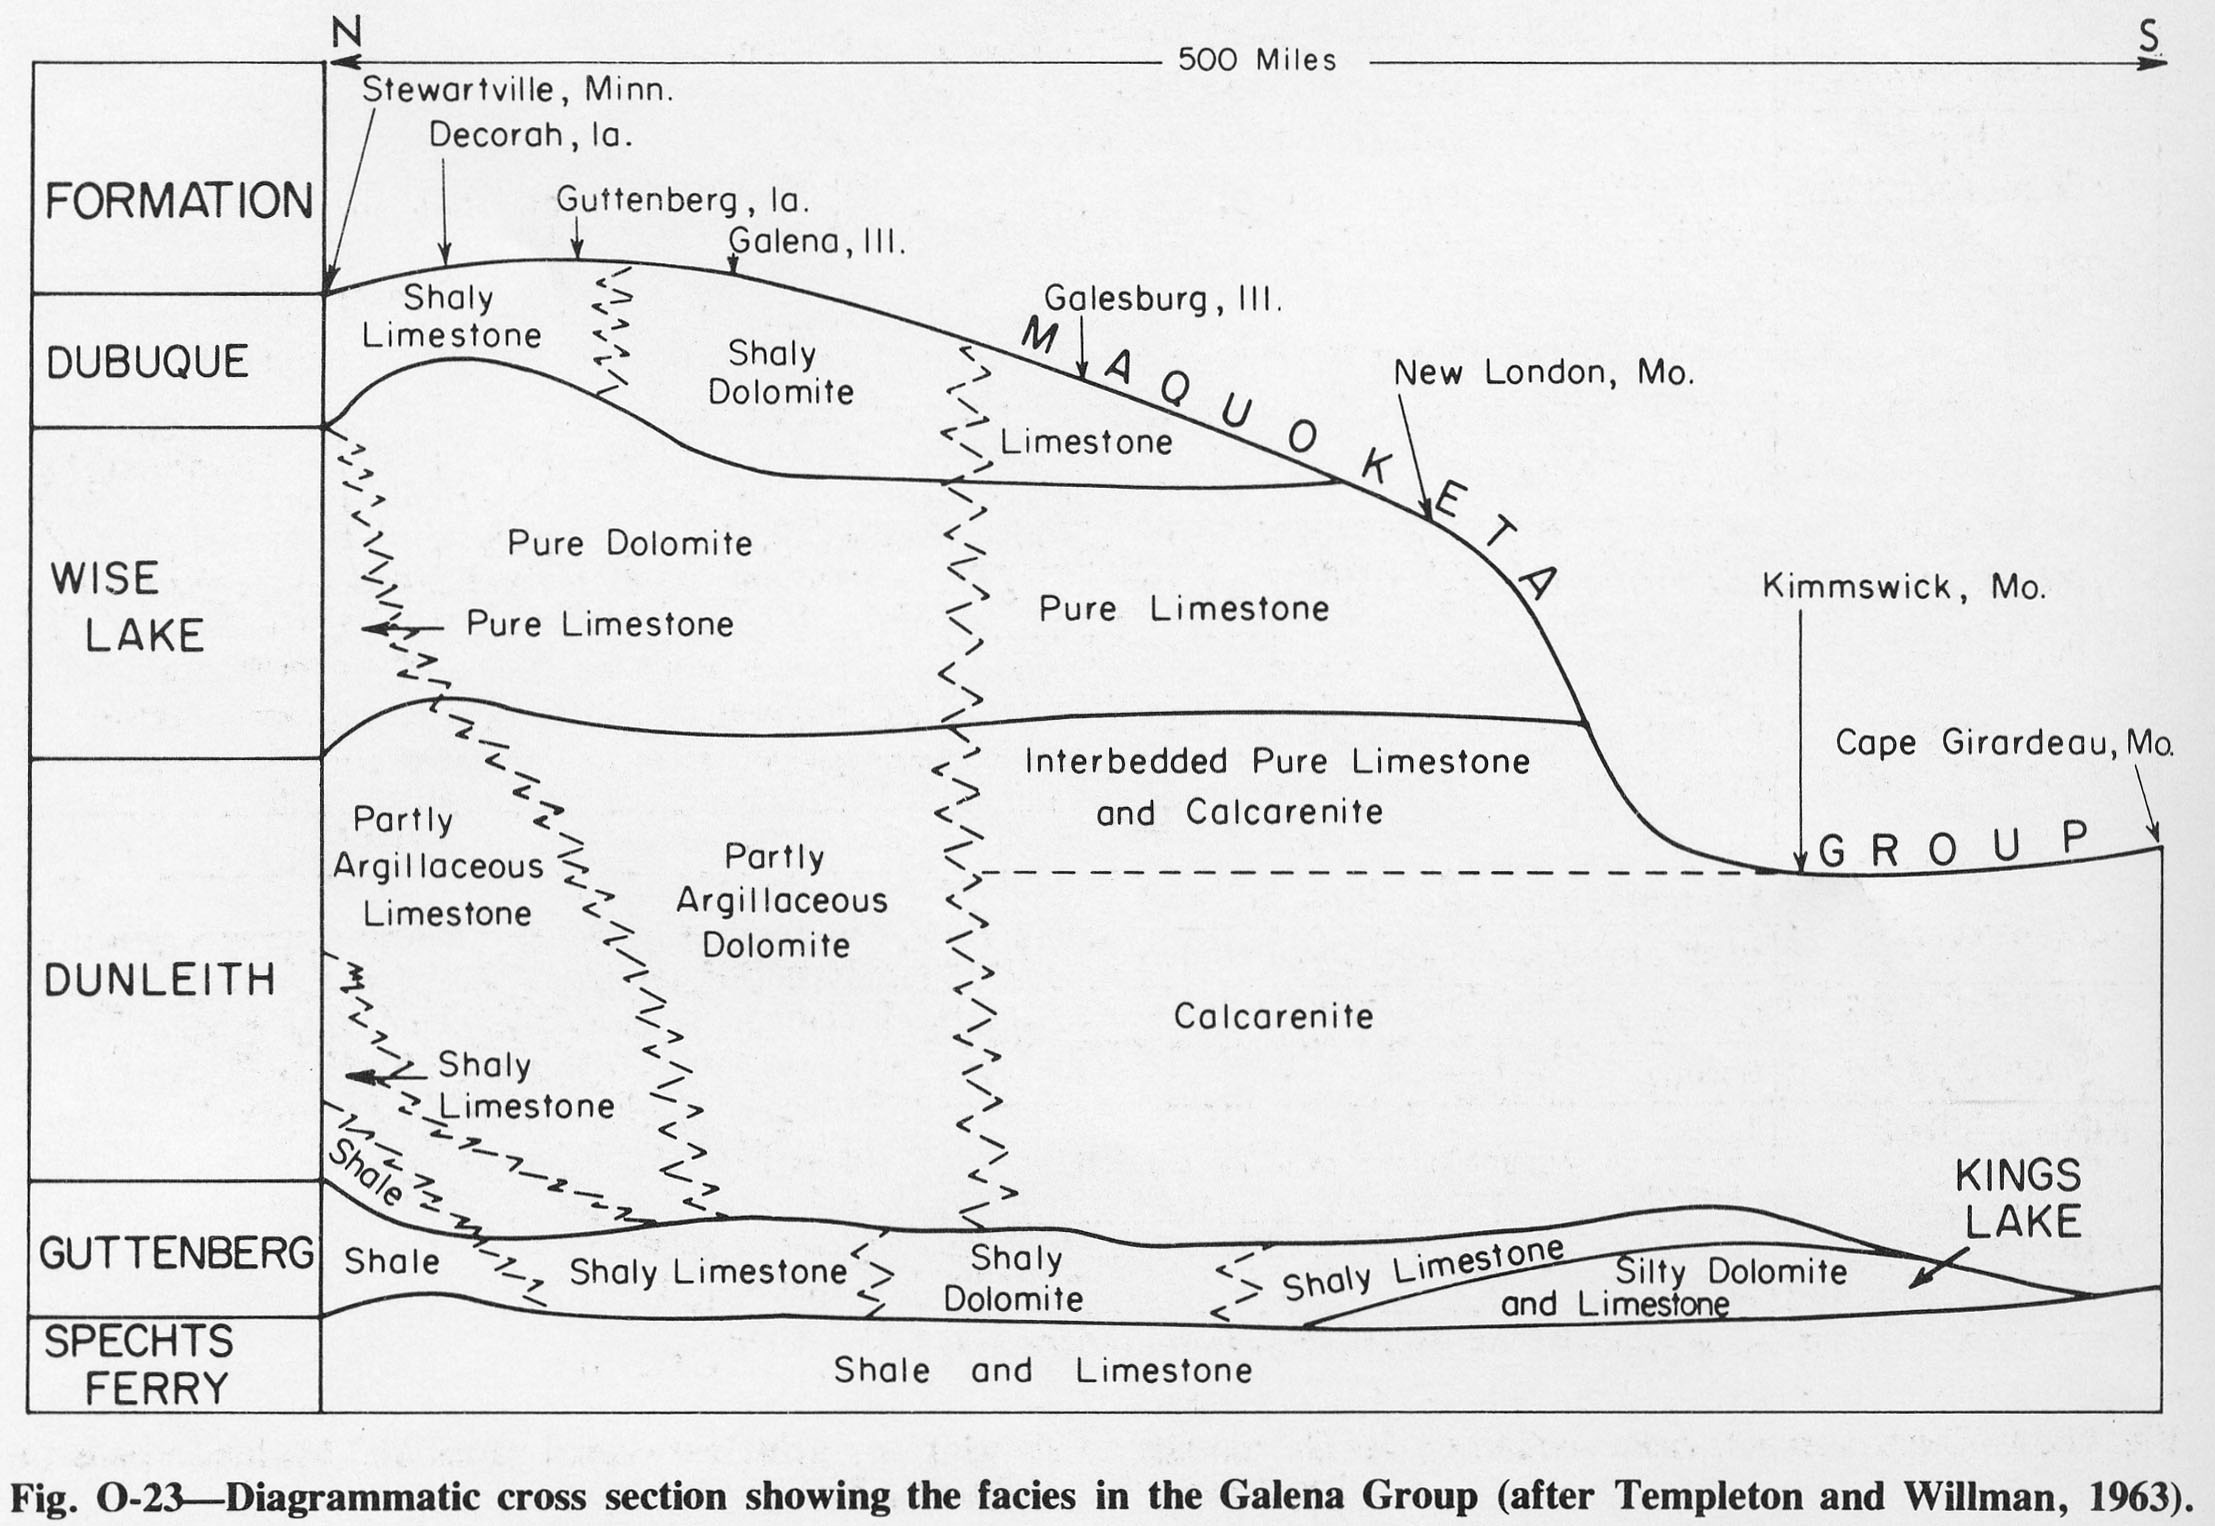
| 15:03, 4 April 2016 | Figure O-23.jpg (file) |  |
368 KB | Fig. O-23 -- Diagrammatic cross section showing the facies in the Galena Group. (after Templeton and Willman, 1963). | 1 |
| 15:02, 4 April 2016 | Figure O-22.jpg (file) |  |
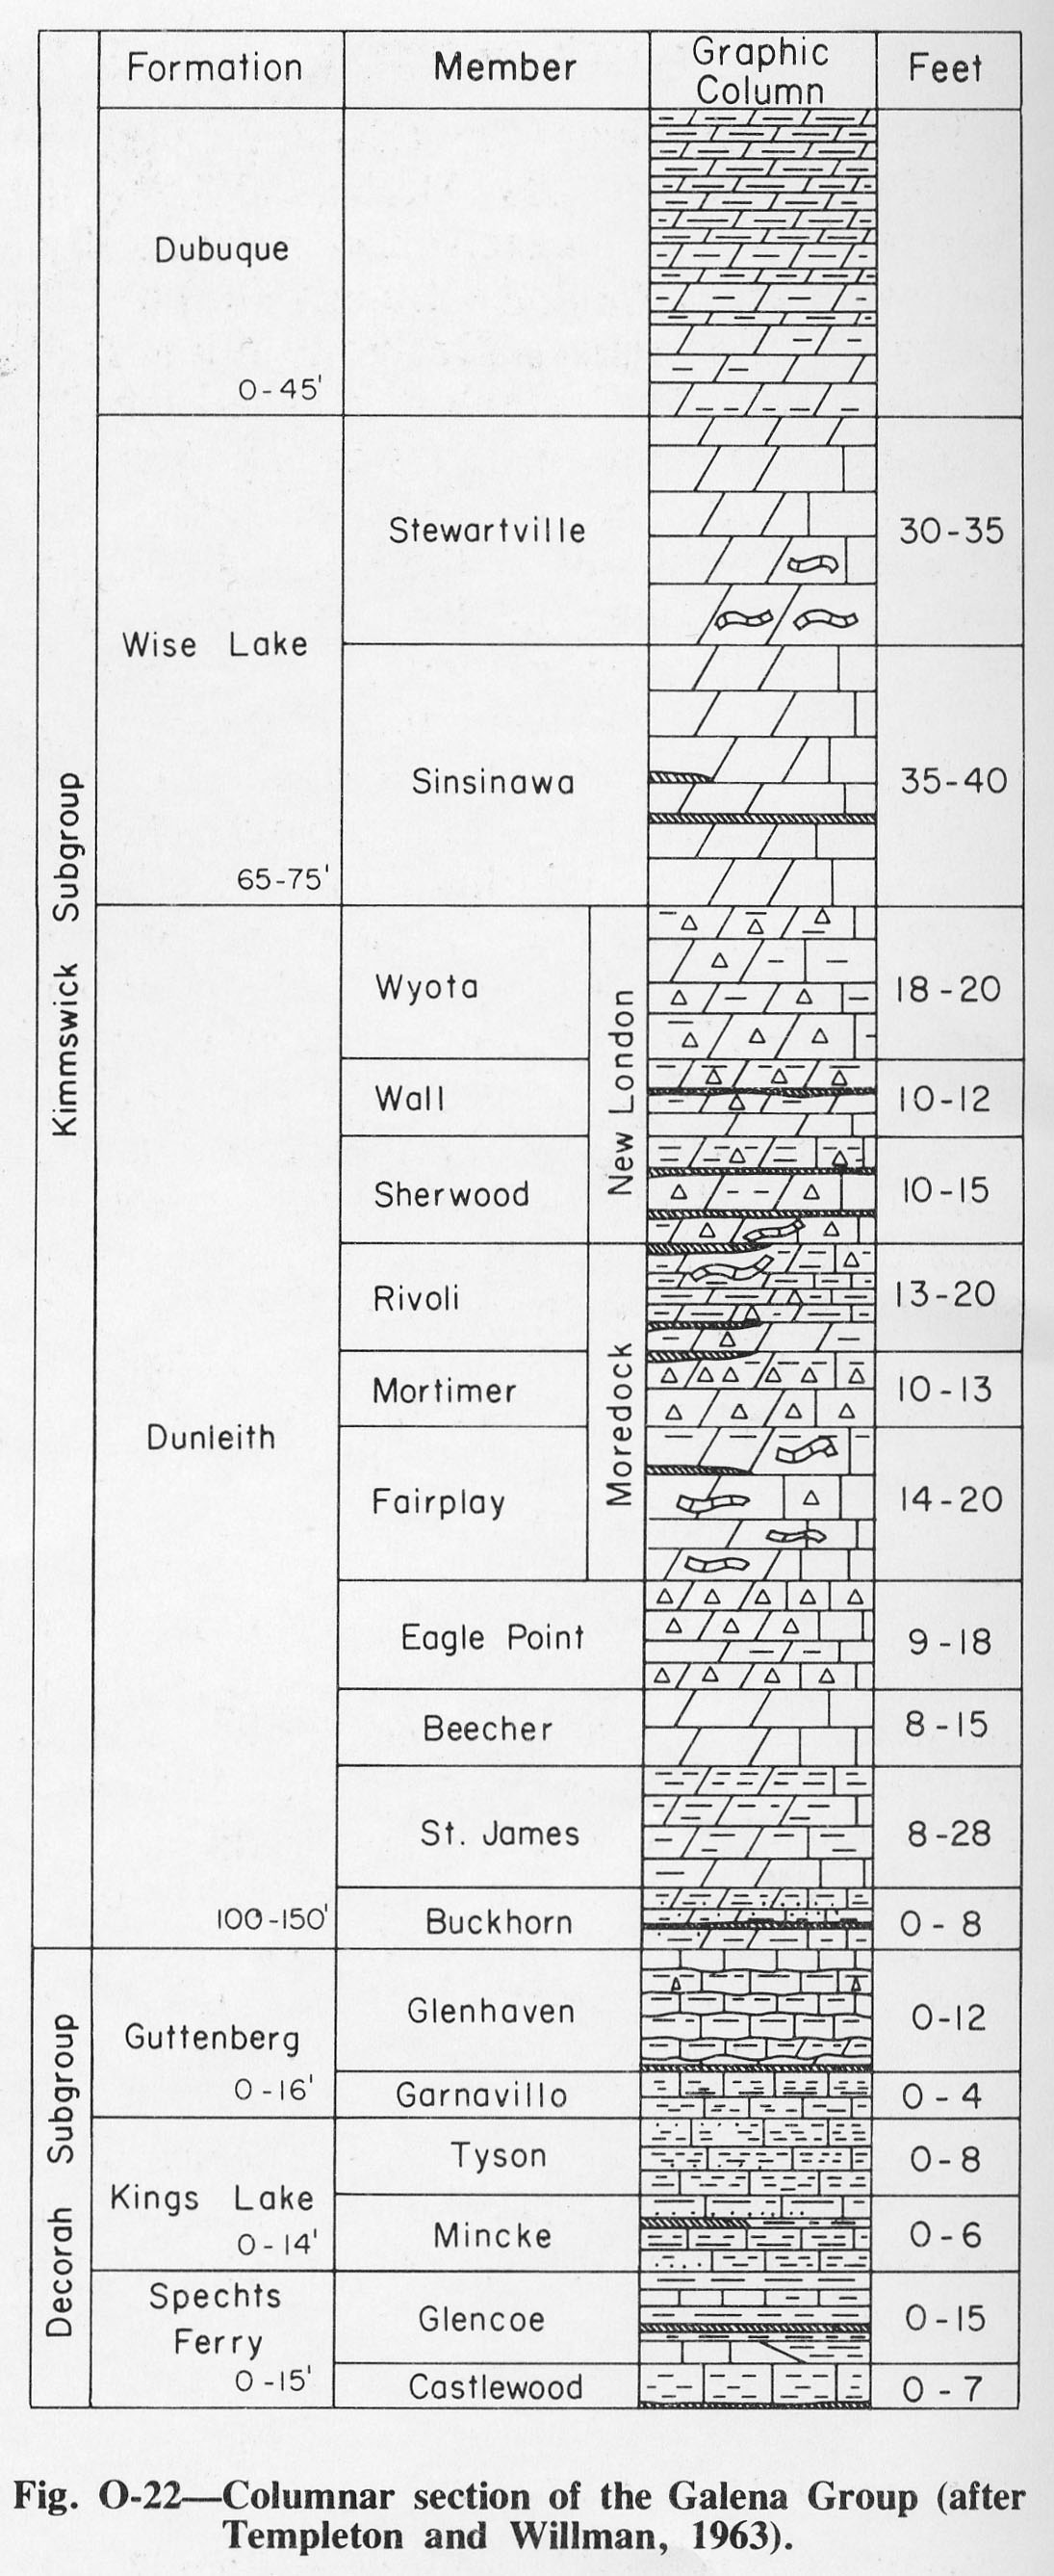
384 KB | Fig. O-22 -- Columnar section of the Galena Group (after Templeton and Willman, 1963). | 1 |
| 15:01, 4 April 2016 | Figure O-21.jpg (file) |  |
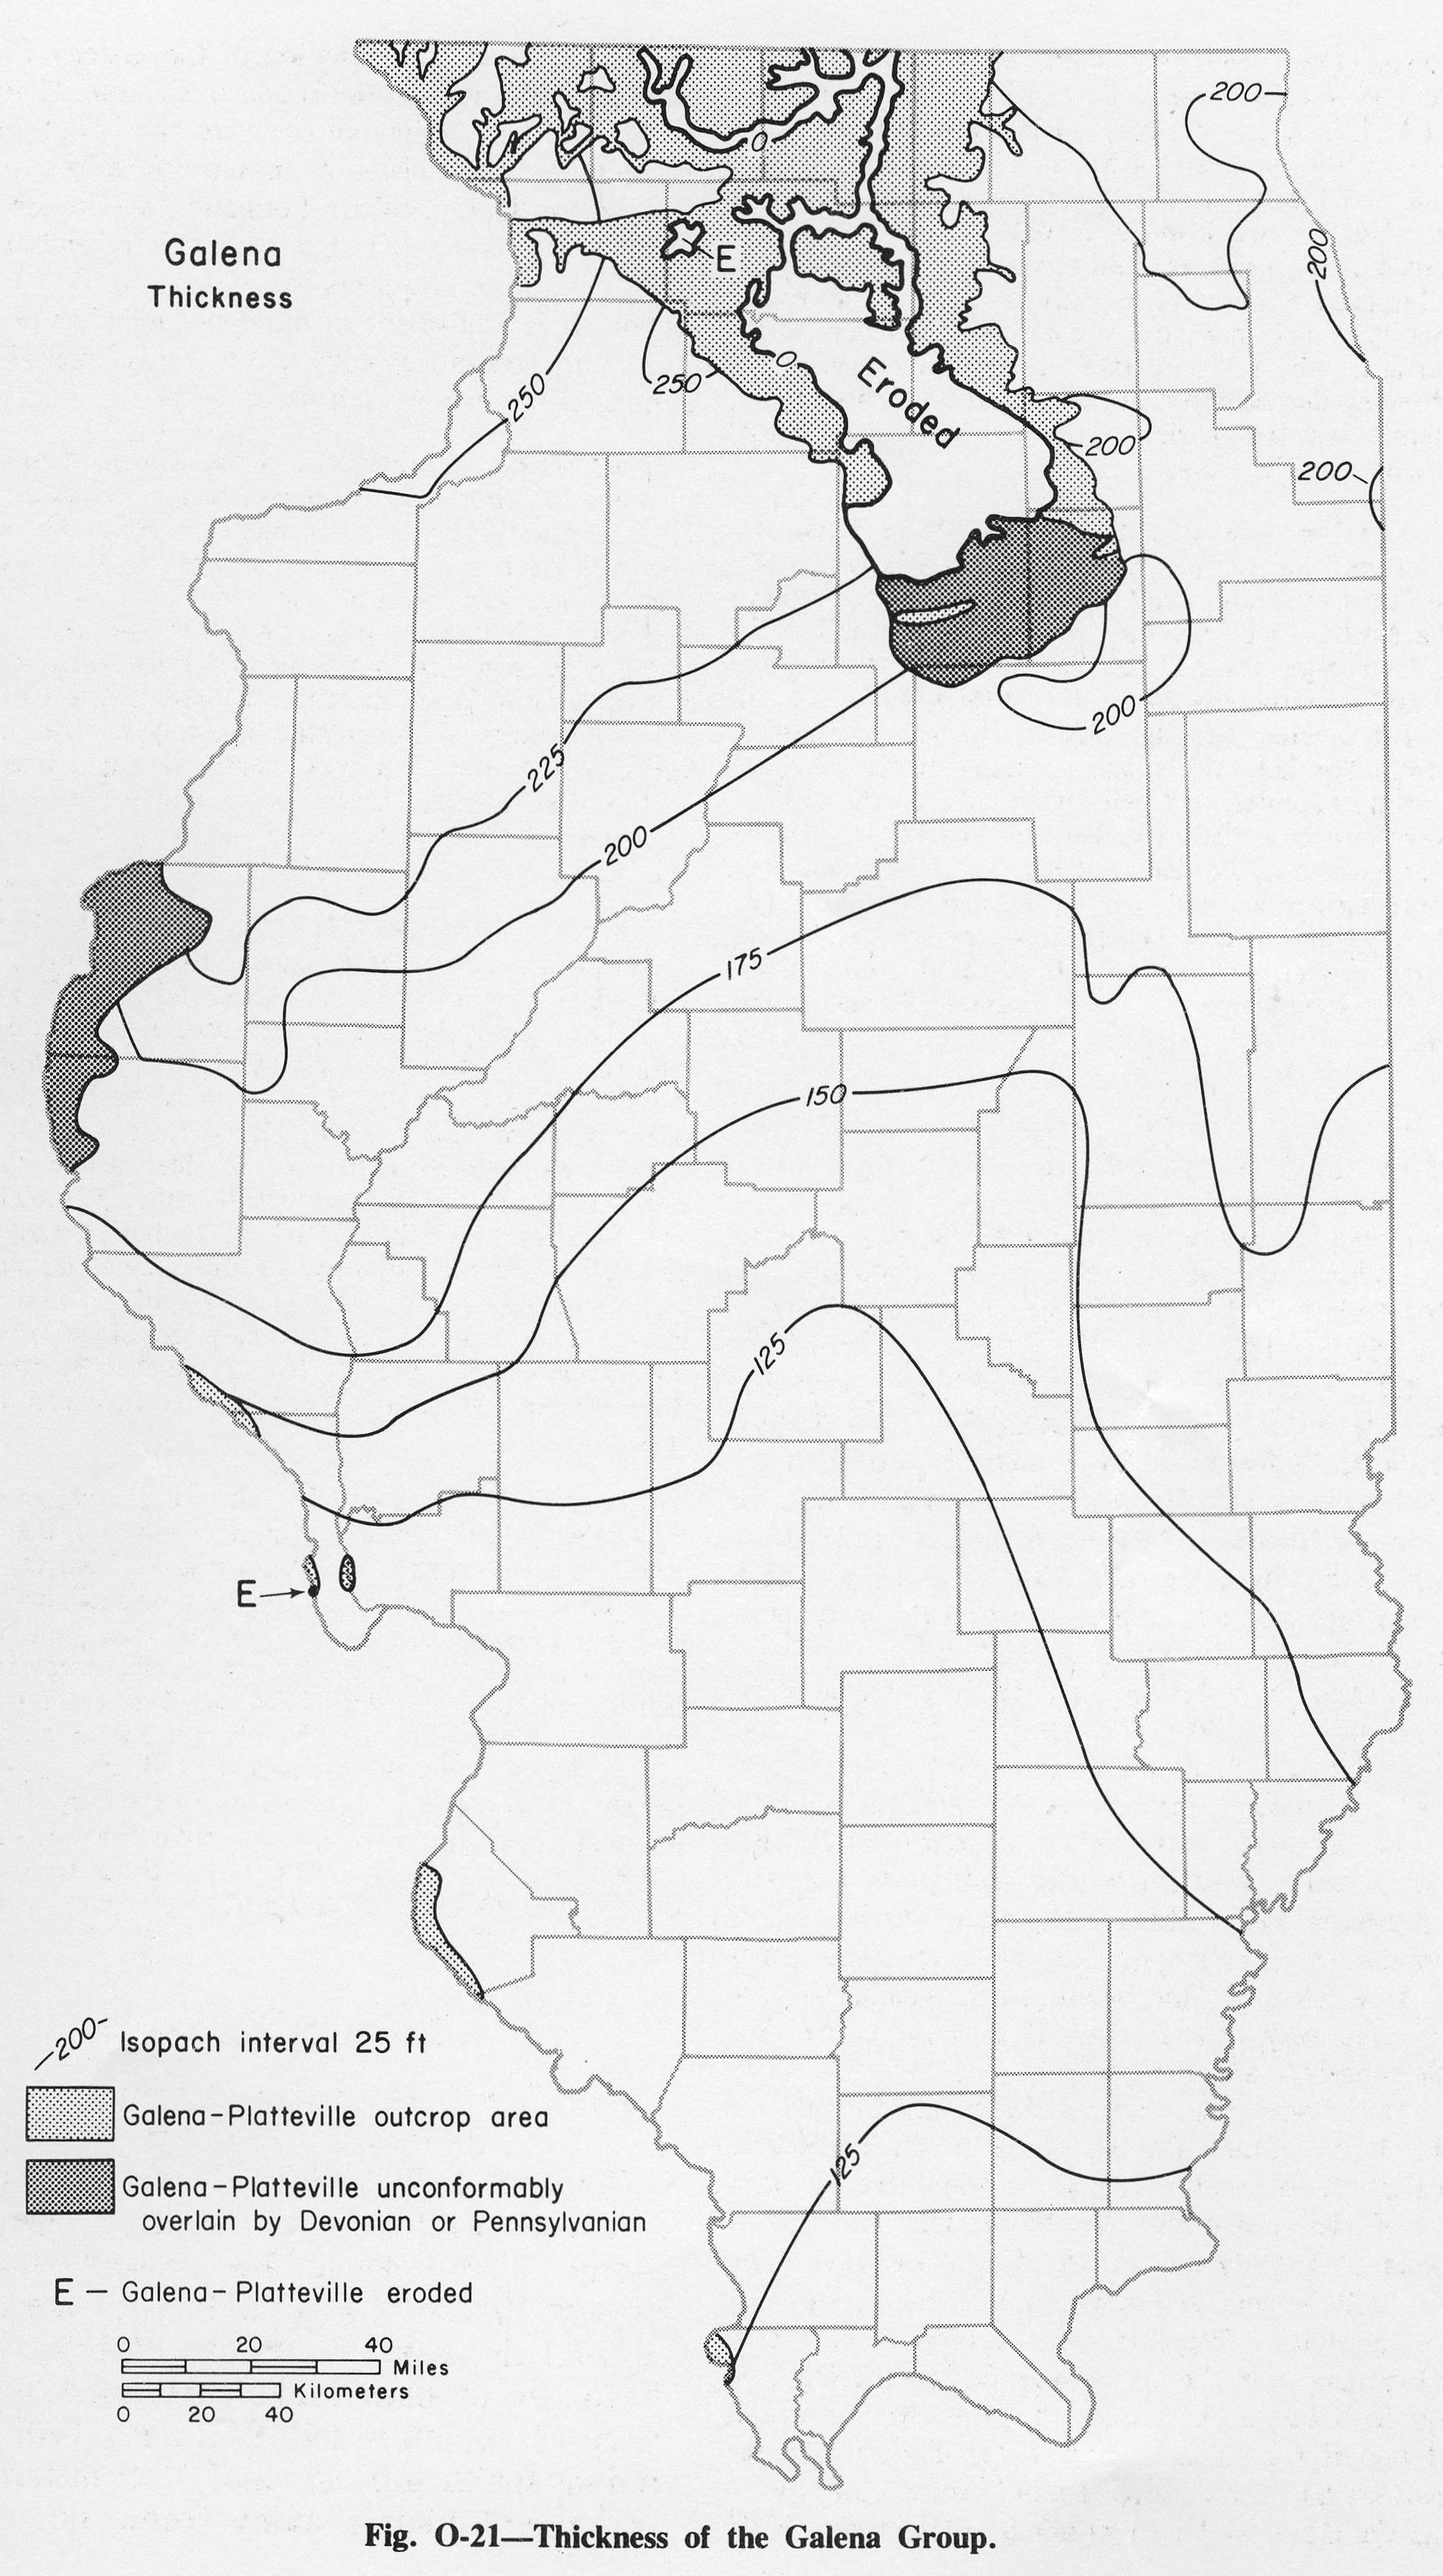
782 KB | Fig. O-21 -- Thickness of the Galena Group. | 1 |
| 15:00, 4 April 2016 | Figure O-20.jpg (file) |  |
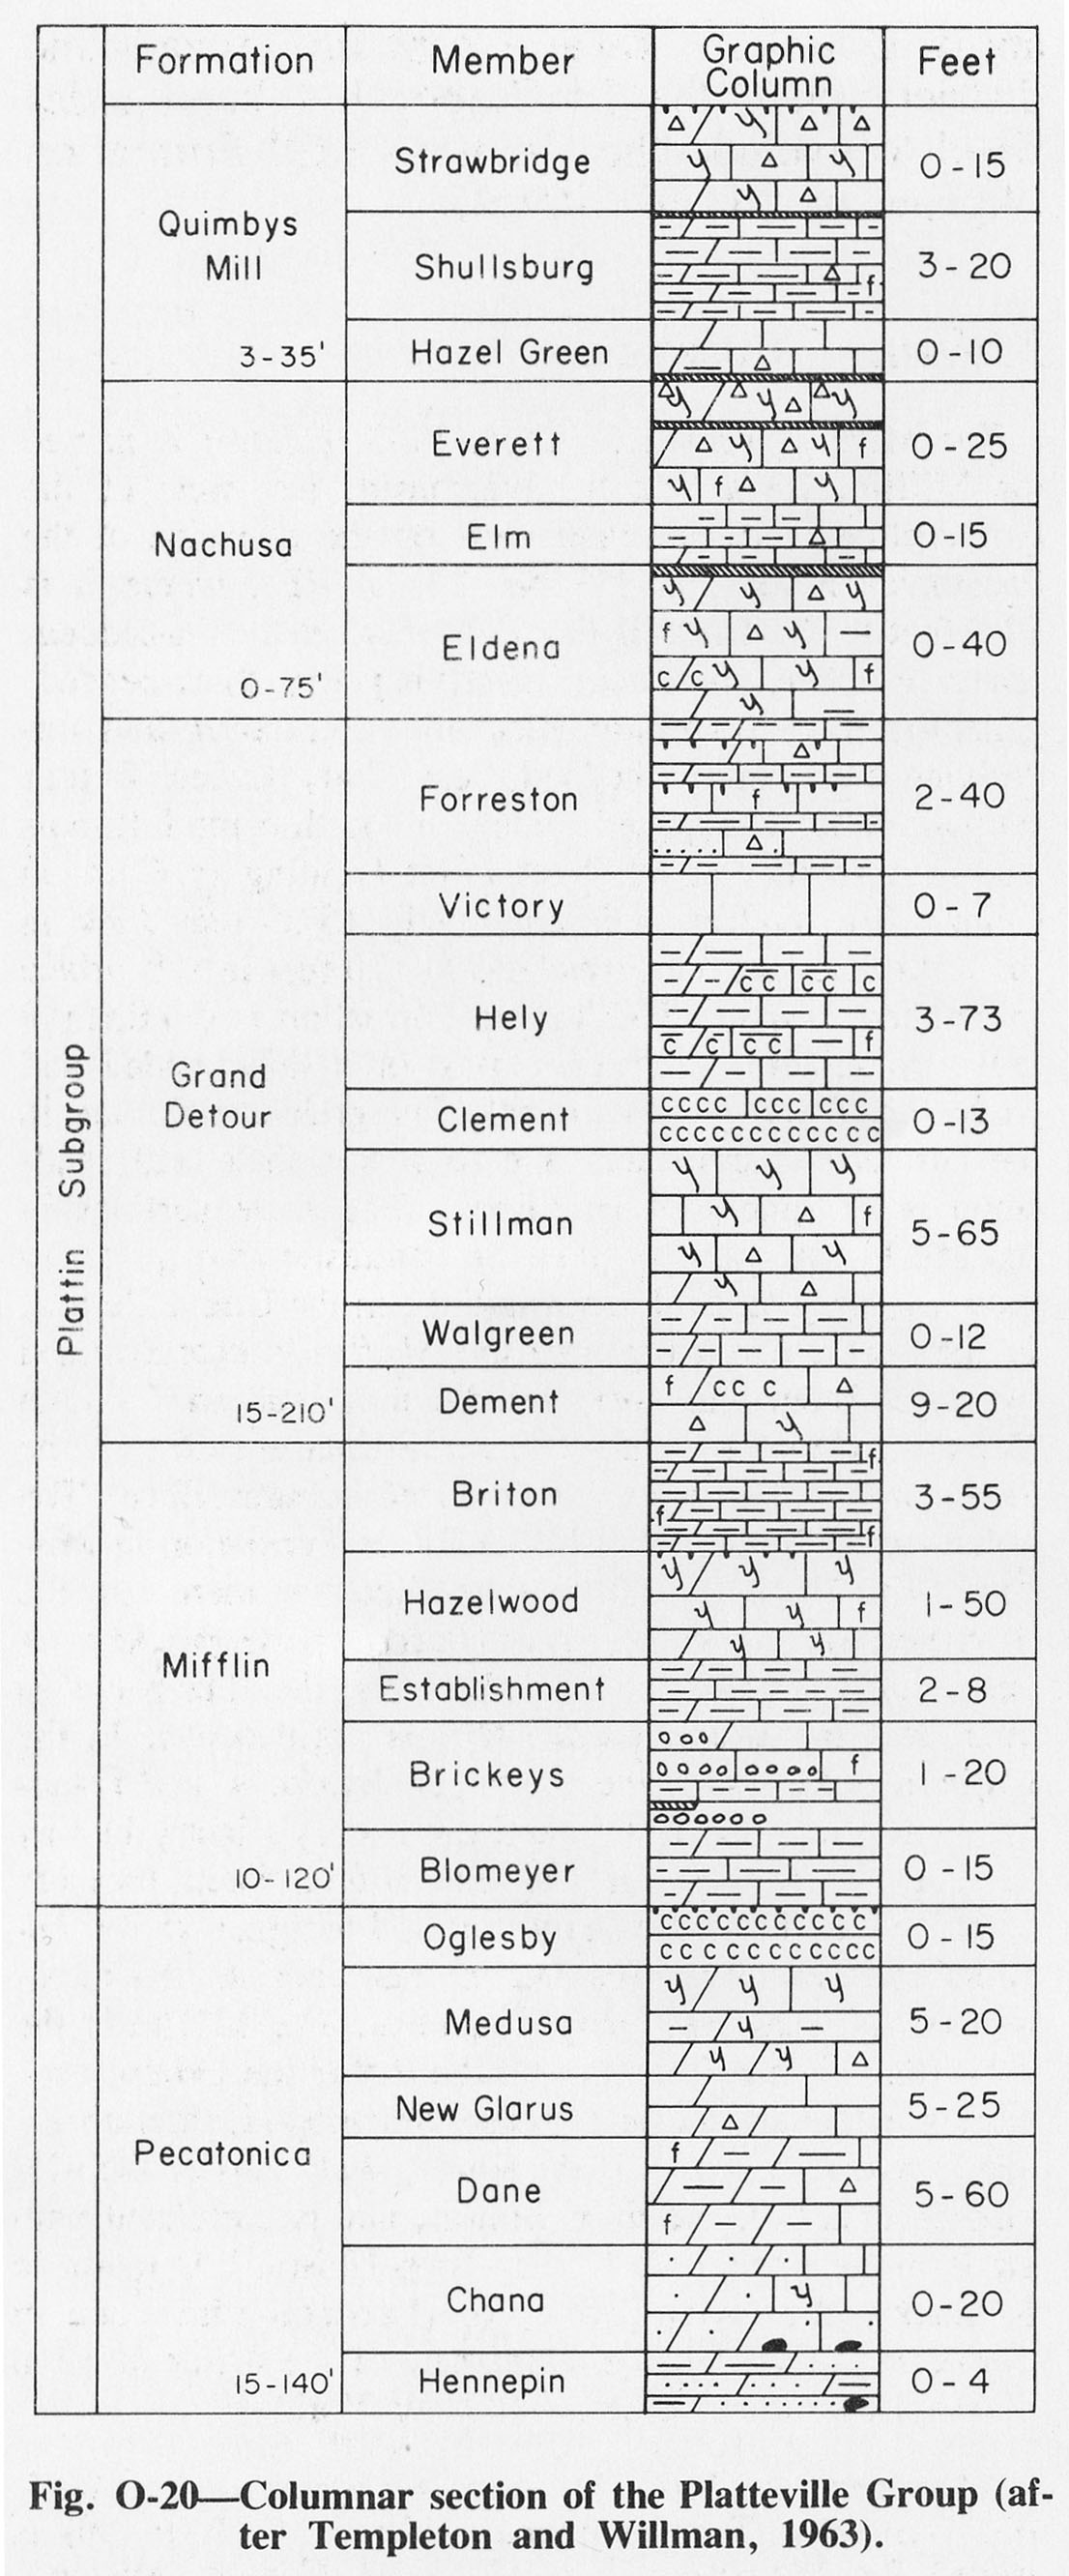
385 KB | Fig. O-21 -- Columnar Section of the Platteville GRoup (after Templeton and Willman, 1963). | 1 |
| 14:59, 4 April 2016 | Figure O-19.jpg (file) |  |
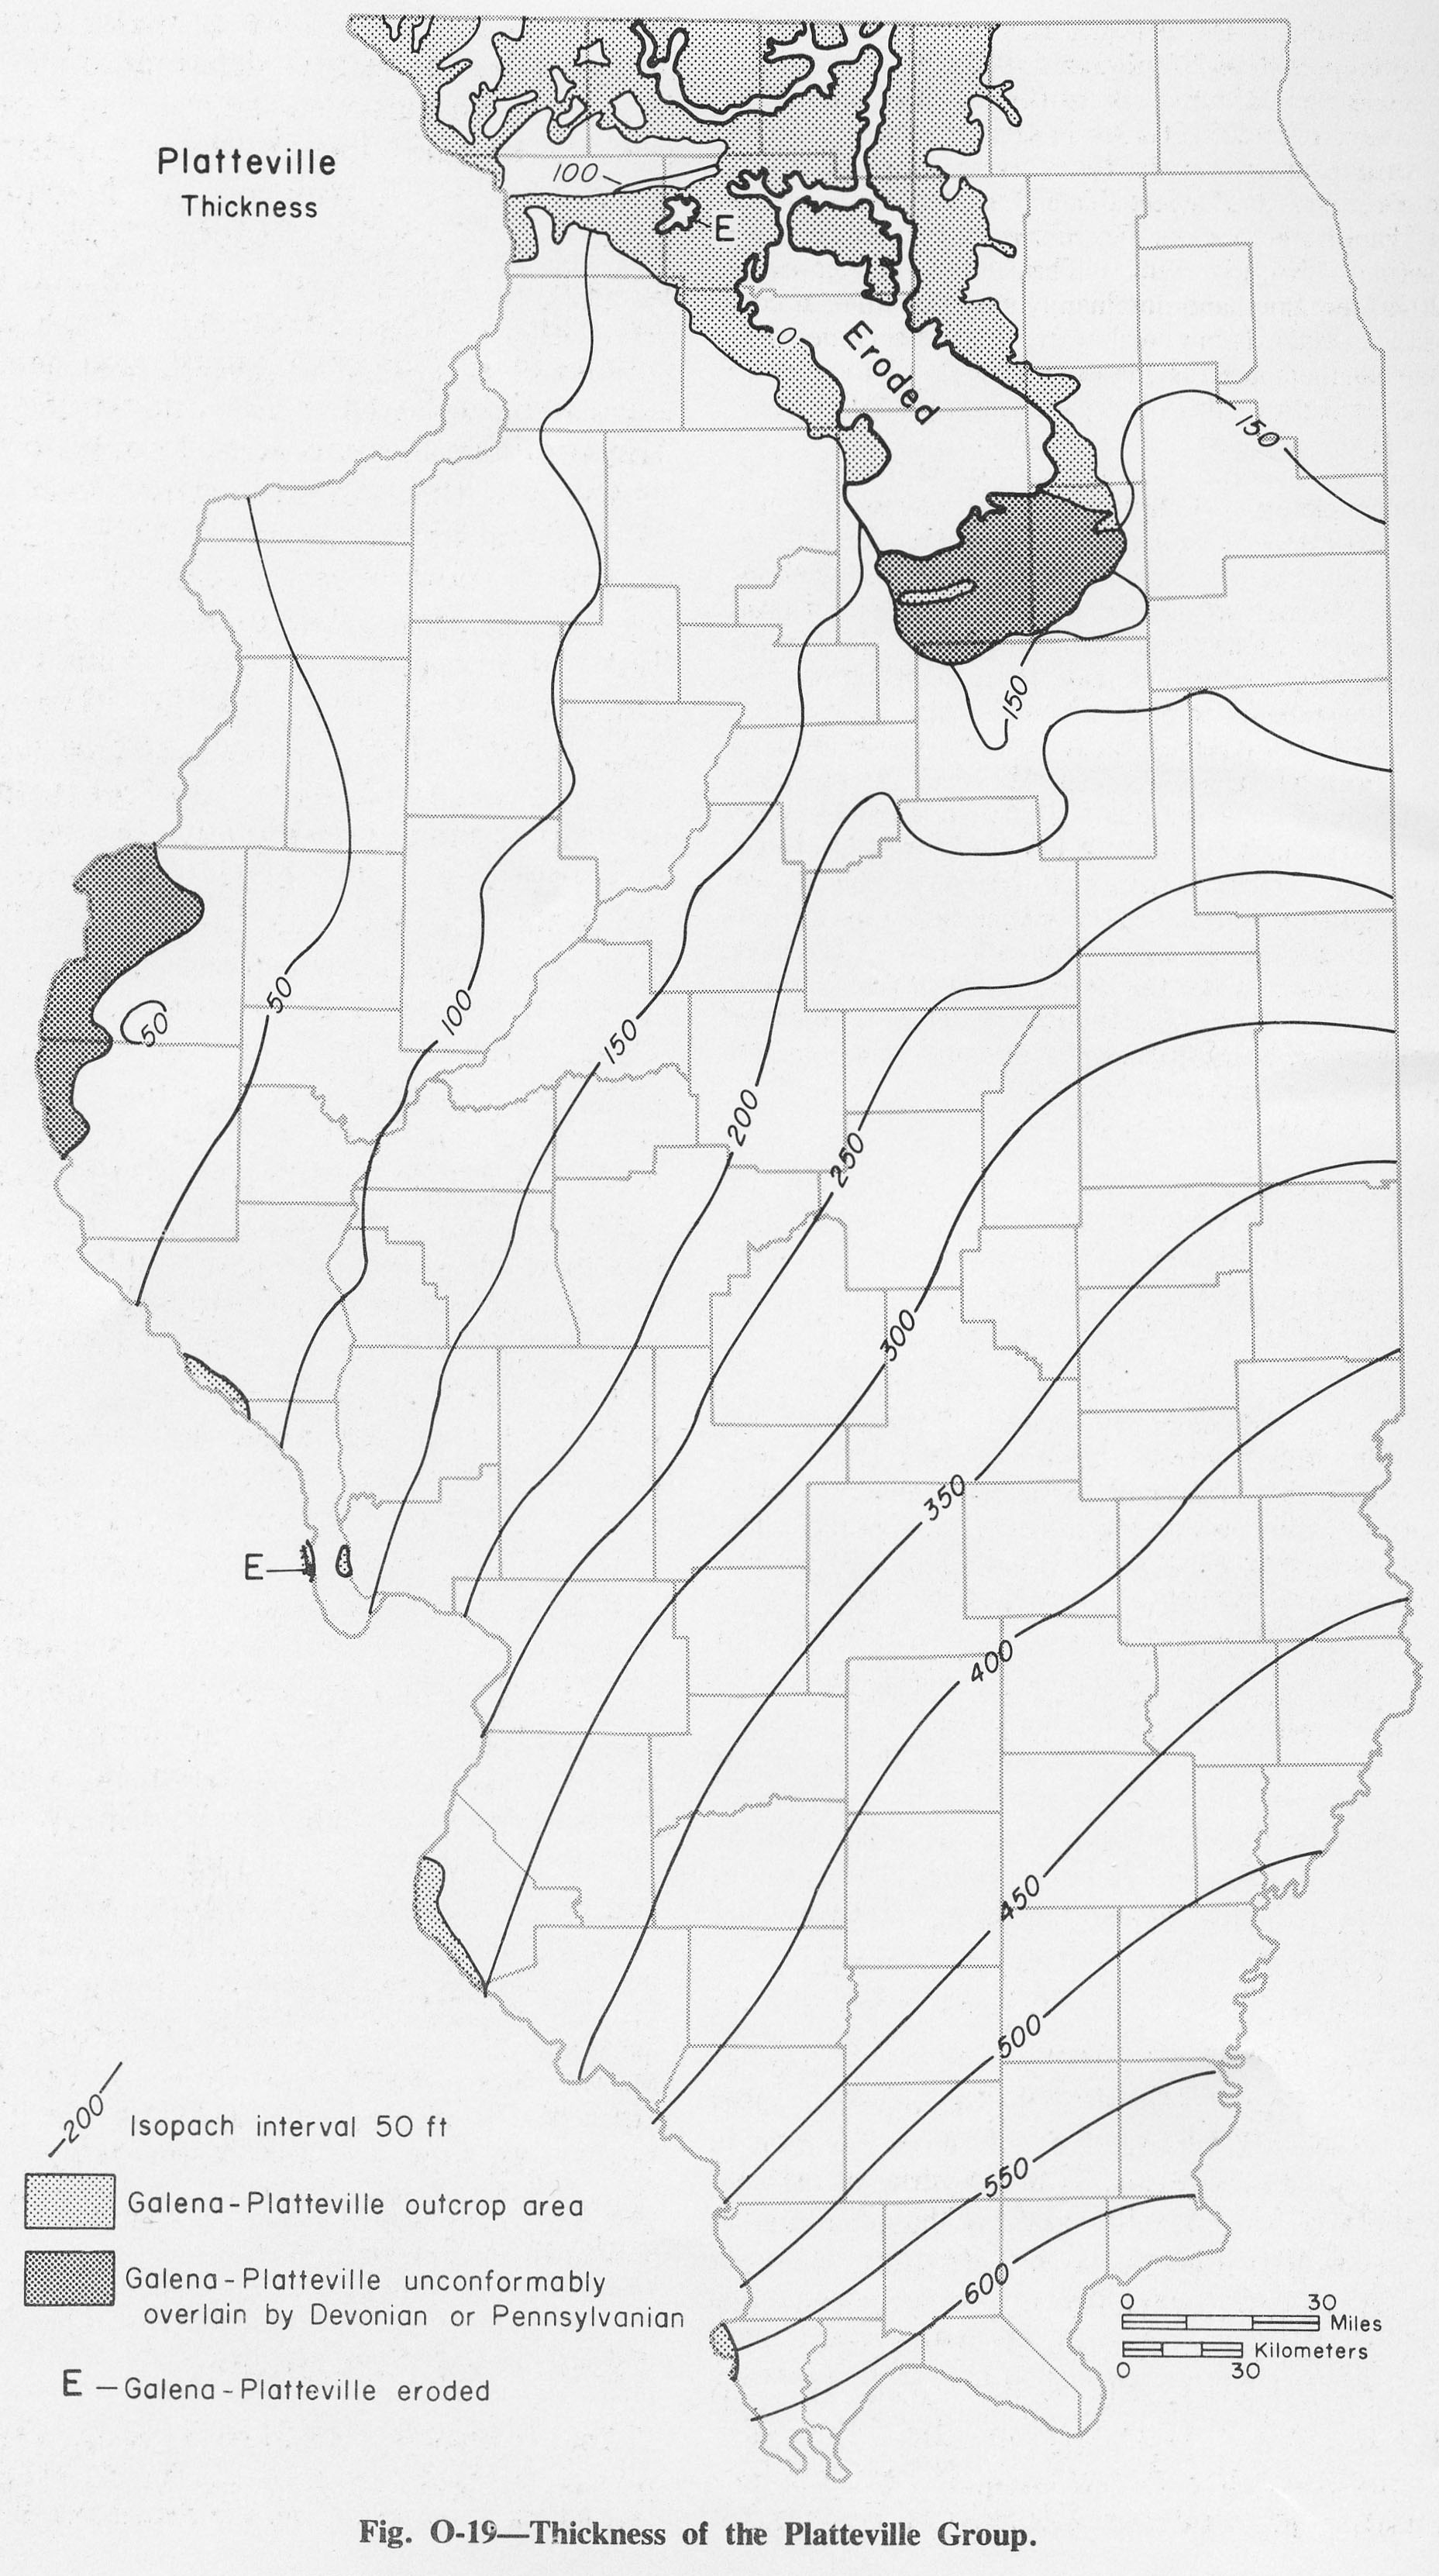
743 KB | Fig. O-19 -- Thickness of the Platteville Group. | 1 |
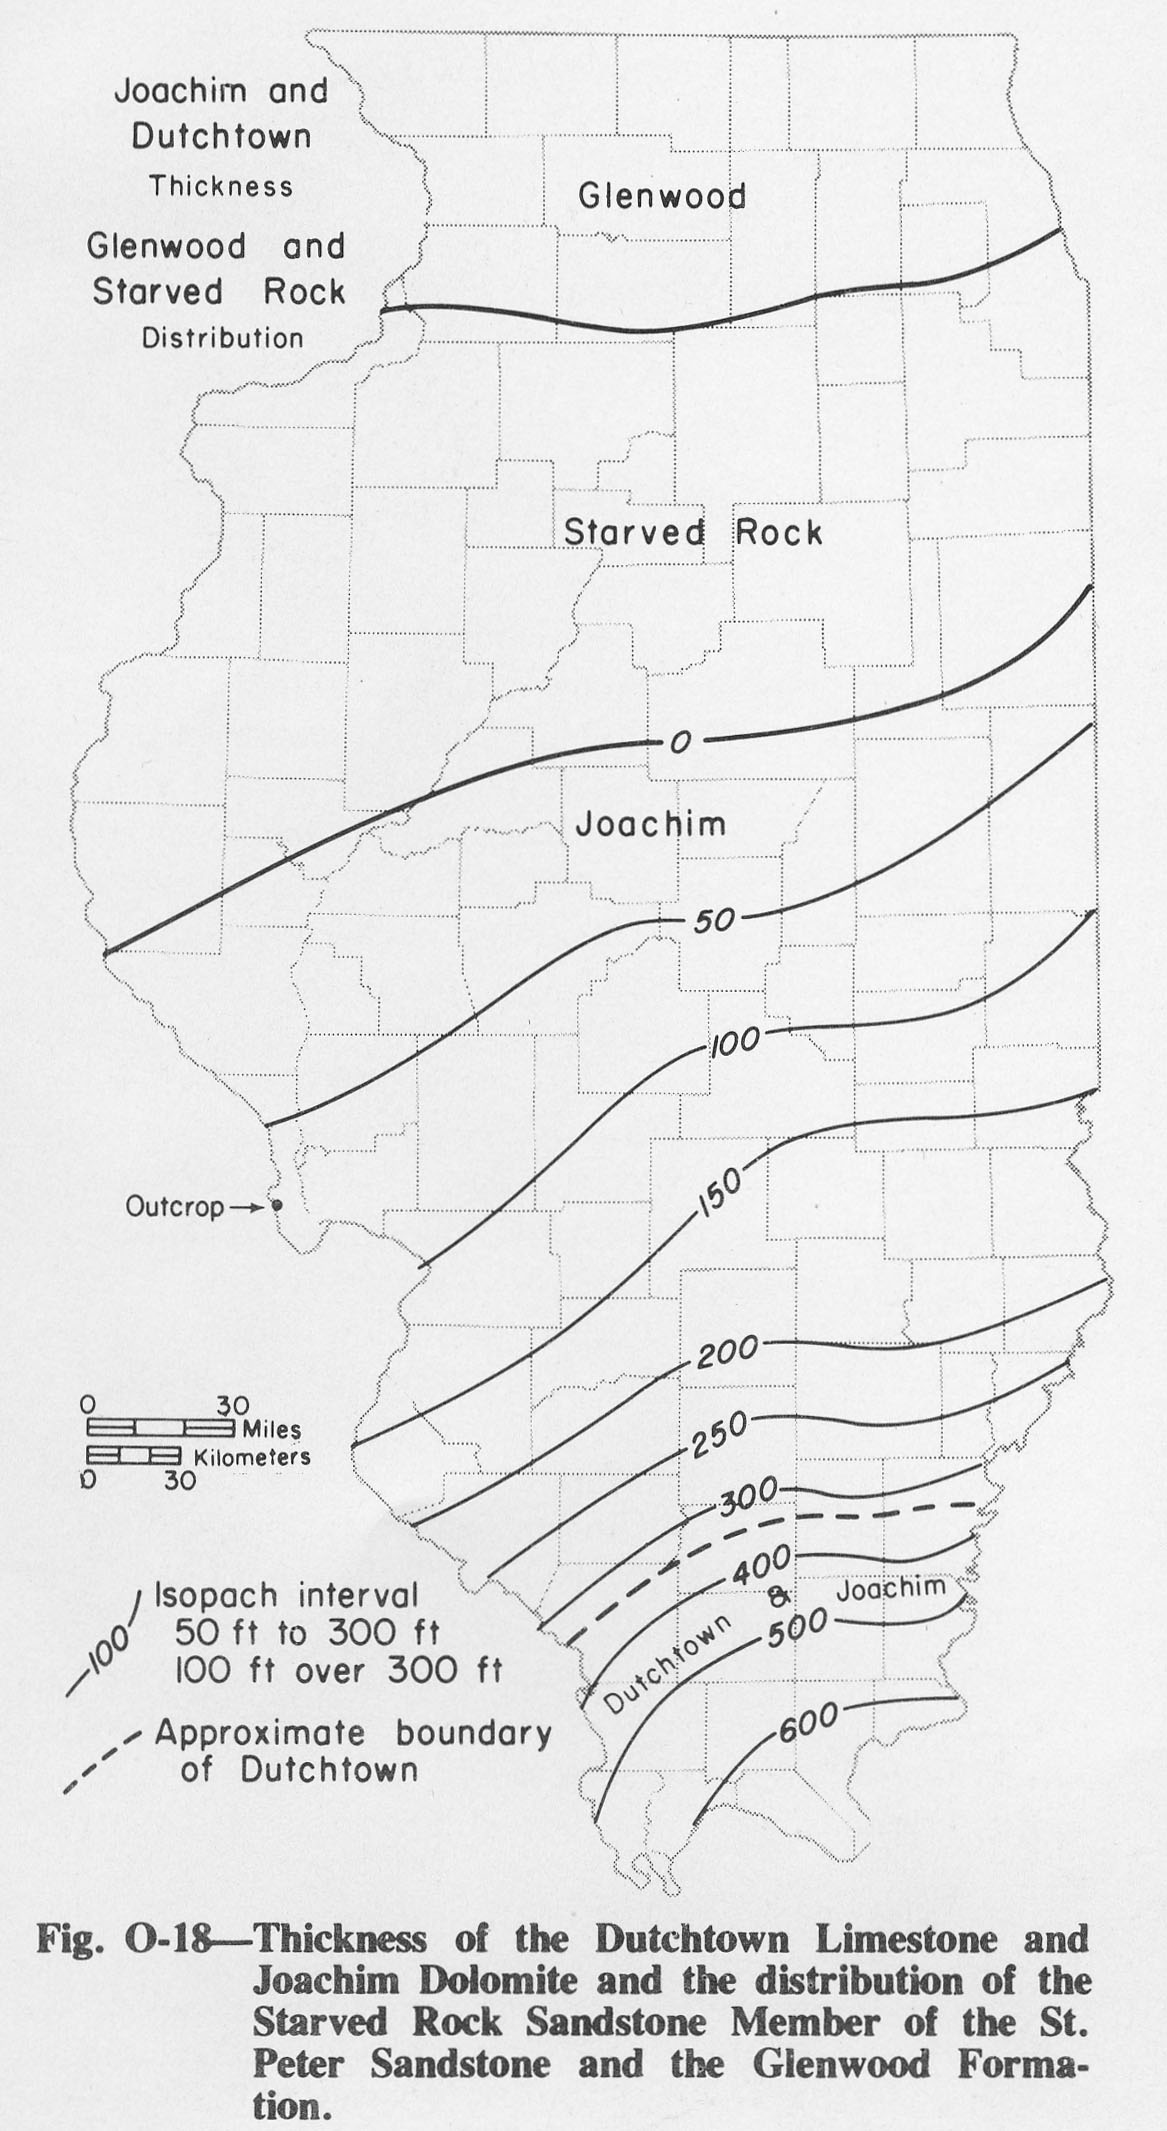
| 14:58, 4 April 2016 | Figure O-18.jpg (file) |  |
306 KB | Fig. O-18 -- Thickness of the Dutchtown Limestone and Joachim Dolomite and the distribution of the Starved Rock Sandstone Member of the St. Peter Sandstone and the Glenwood Formation. | 1 |
| 14:56, 4 April 2016 | Figure O-17.jpg (file) |  |
282 KB | Fig. O-17 -- Thickness of the St. Peter Sandstone. | 1 |
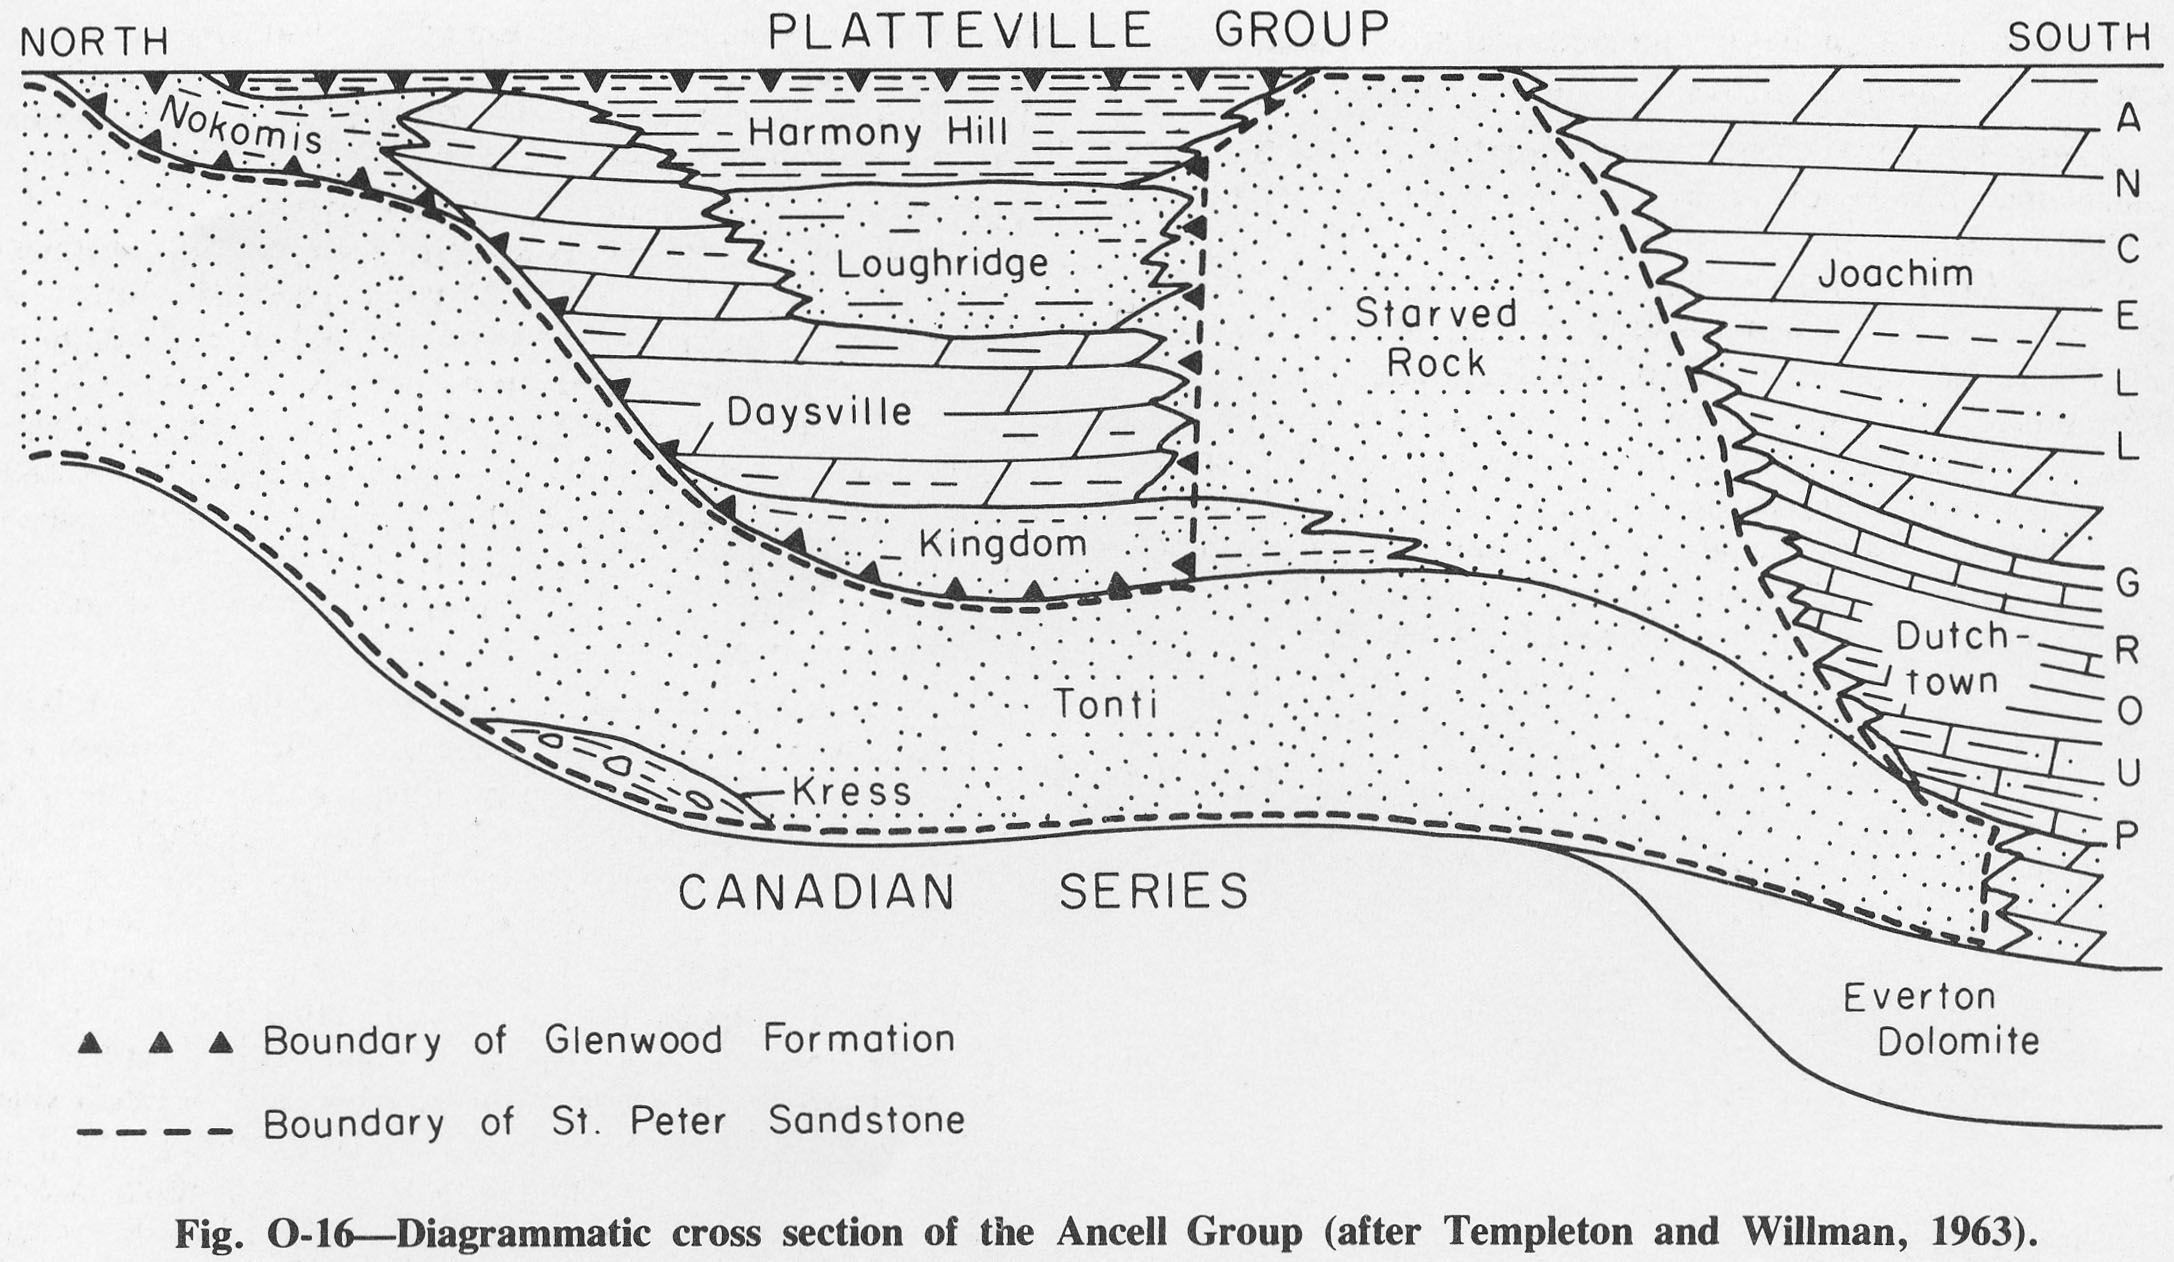
| 14:56, 4 April 2016 | Figure O-16.jpg (file) |  |
388 KB | Fig. O-16 -- Diagrammatic cross section of the Ancell Group (after Templeton and Willman, 1963). | 1 |
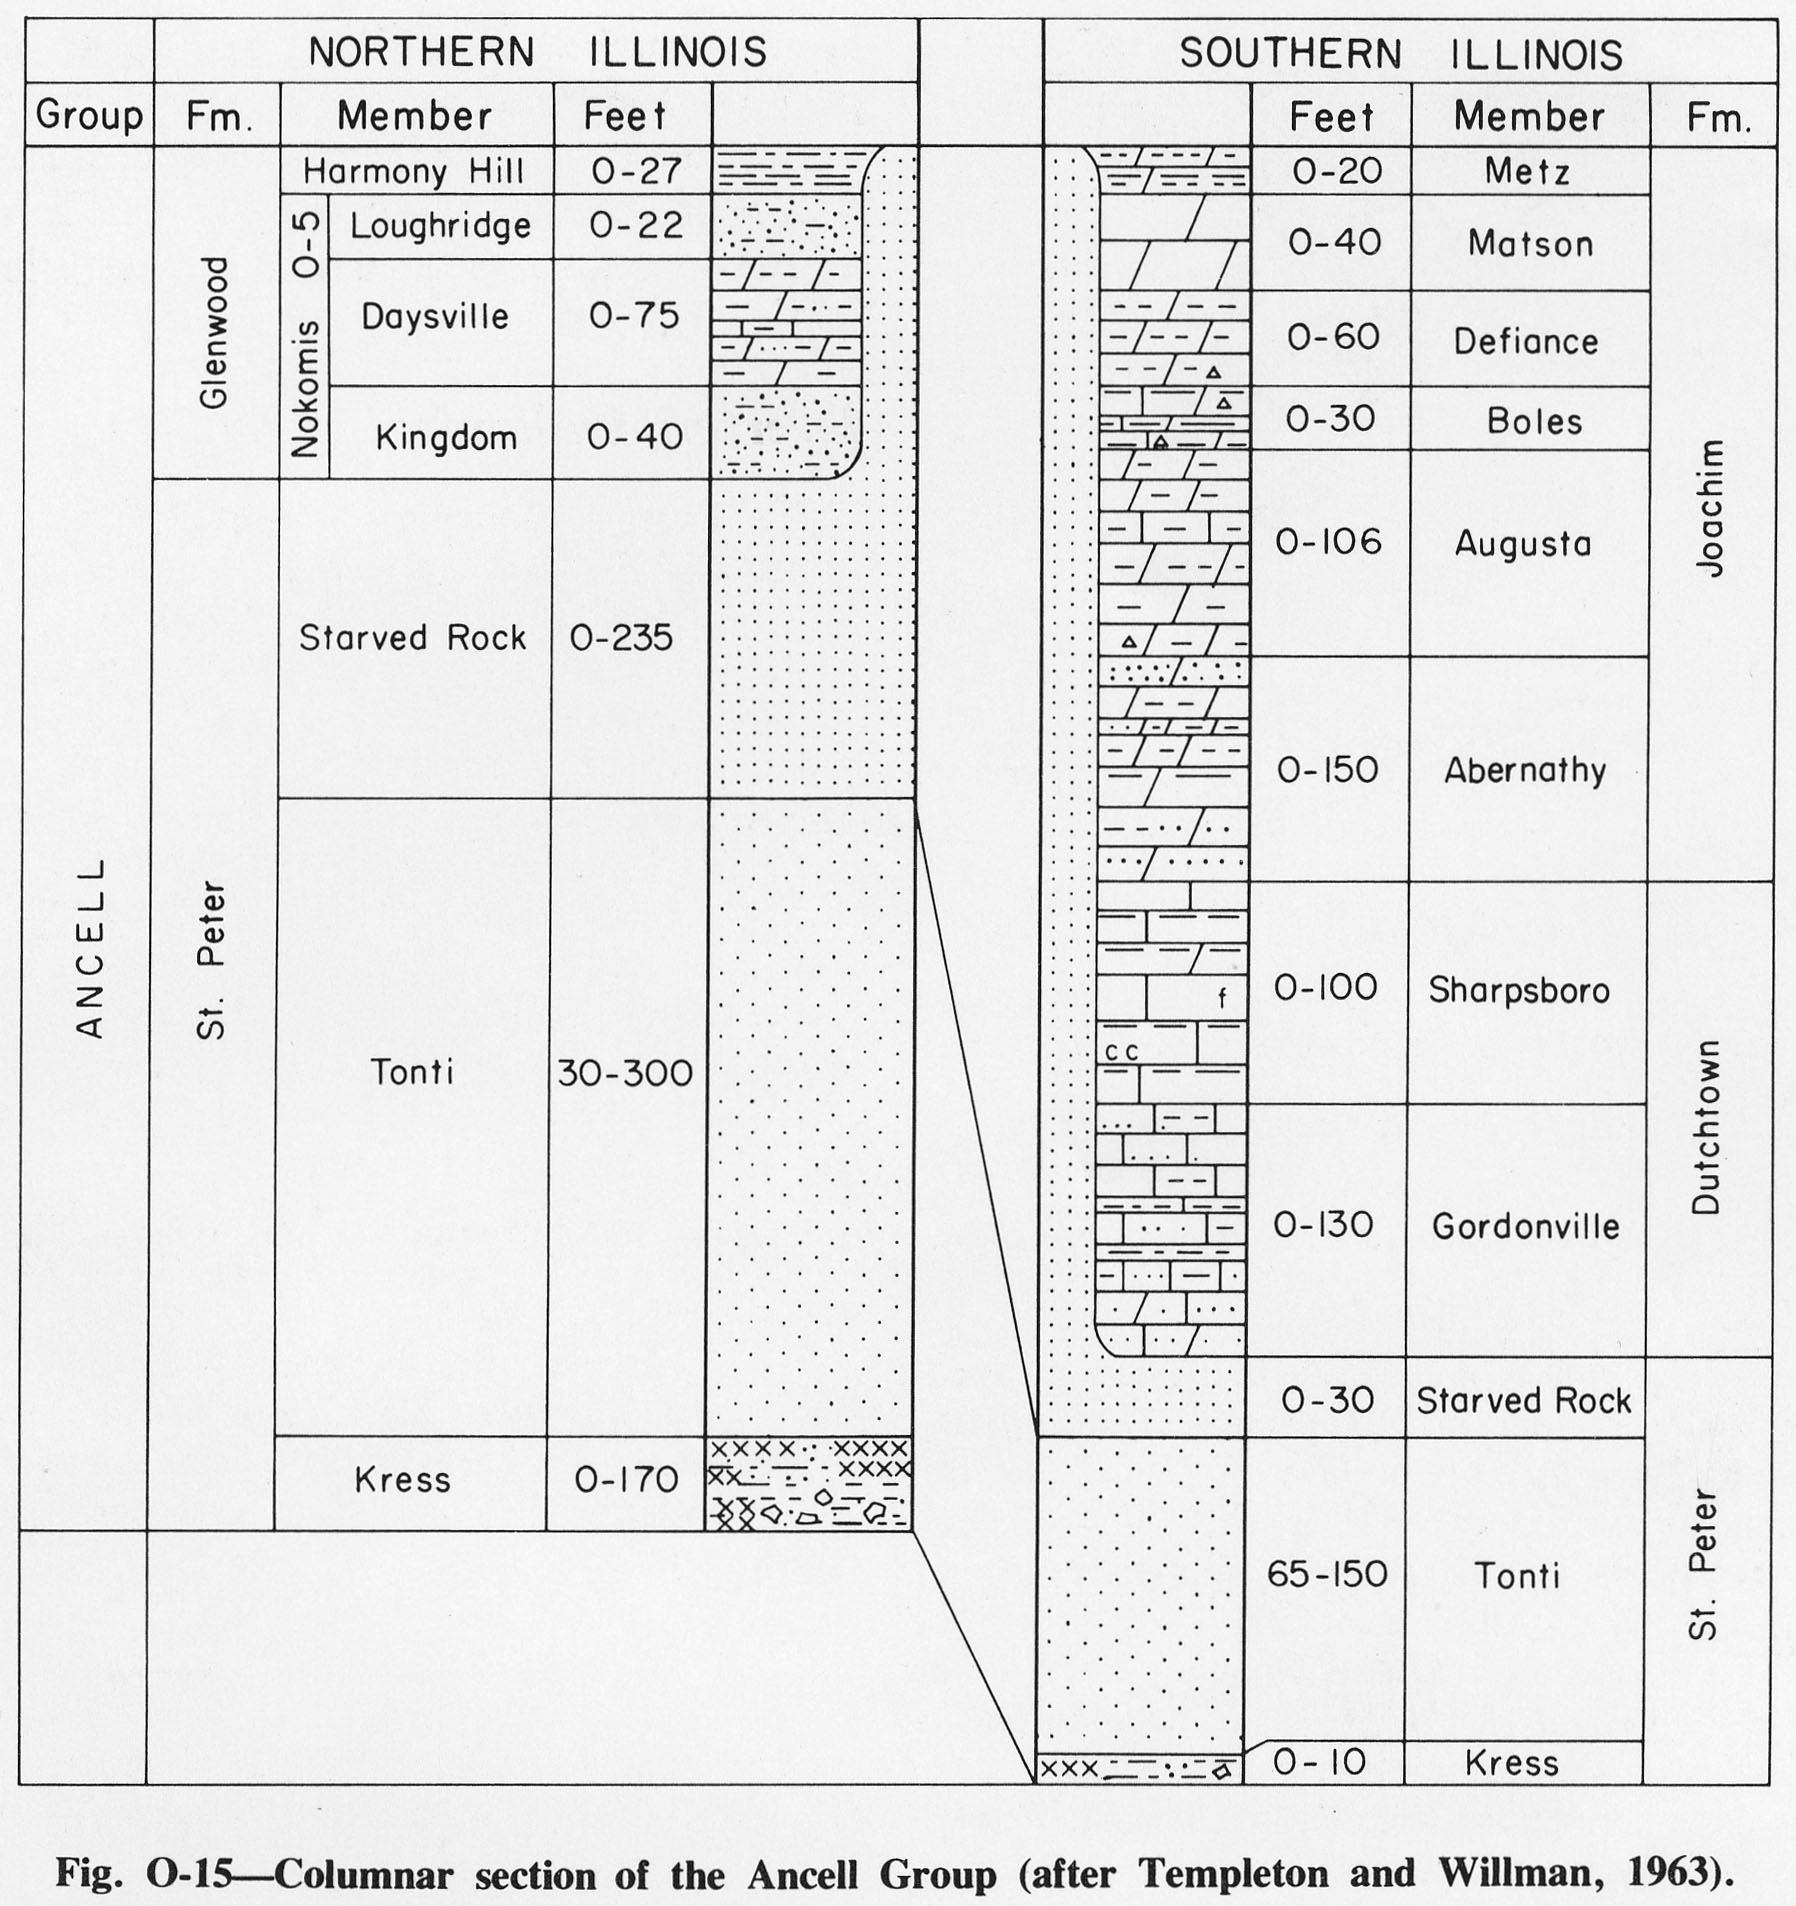
| 14:55, 4 April 2016 | Figure O-15.jpg (file) |  |
388 KB | Fig. O-15 -- Columnar section of the Ancell Group (after Templeton and Willman, 1963). | 1 |
| 14:54, 4 April 2016 | Figure O-14.jpg (file) |  |
330 KB | Fig. O-14 -- Thickness of the Ottawa Limestone Megagroup. | 1 |
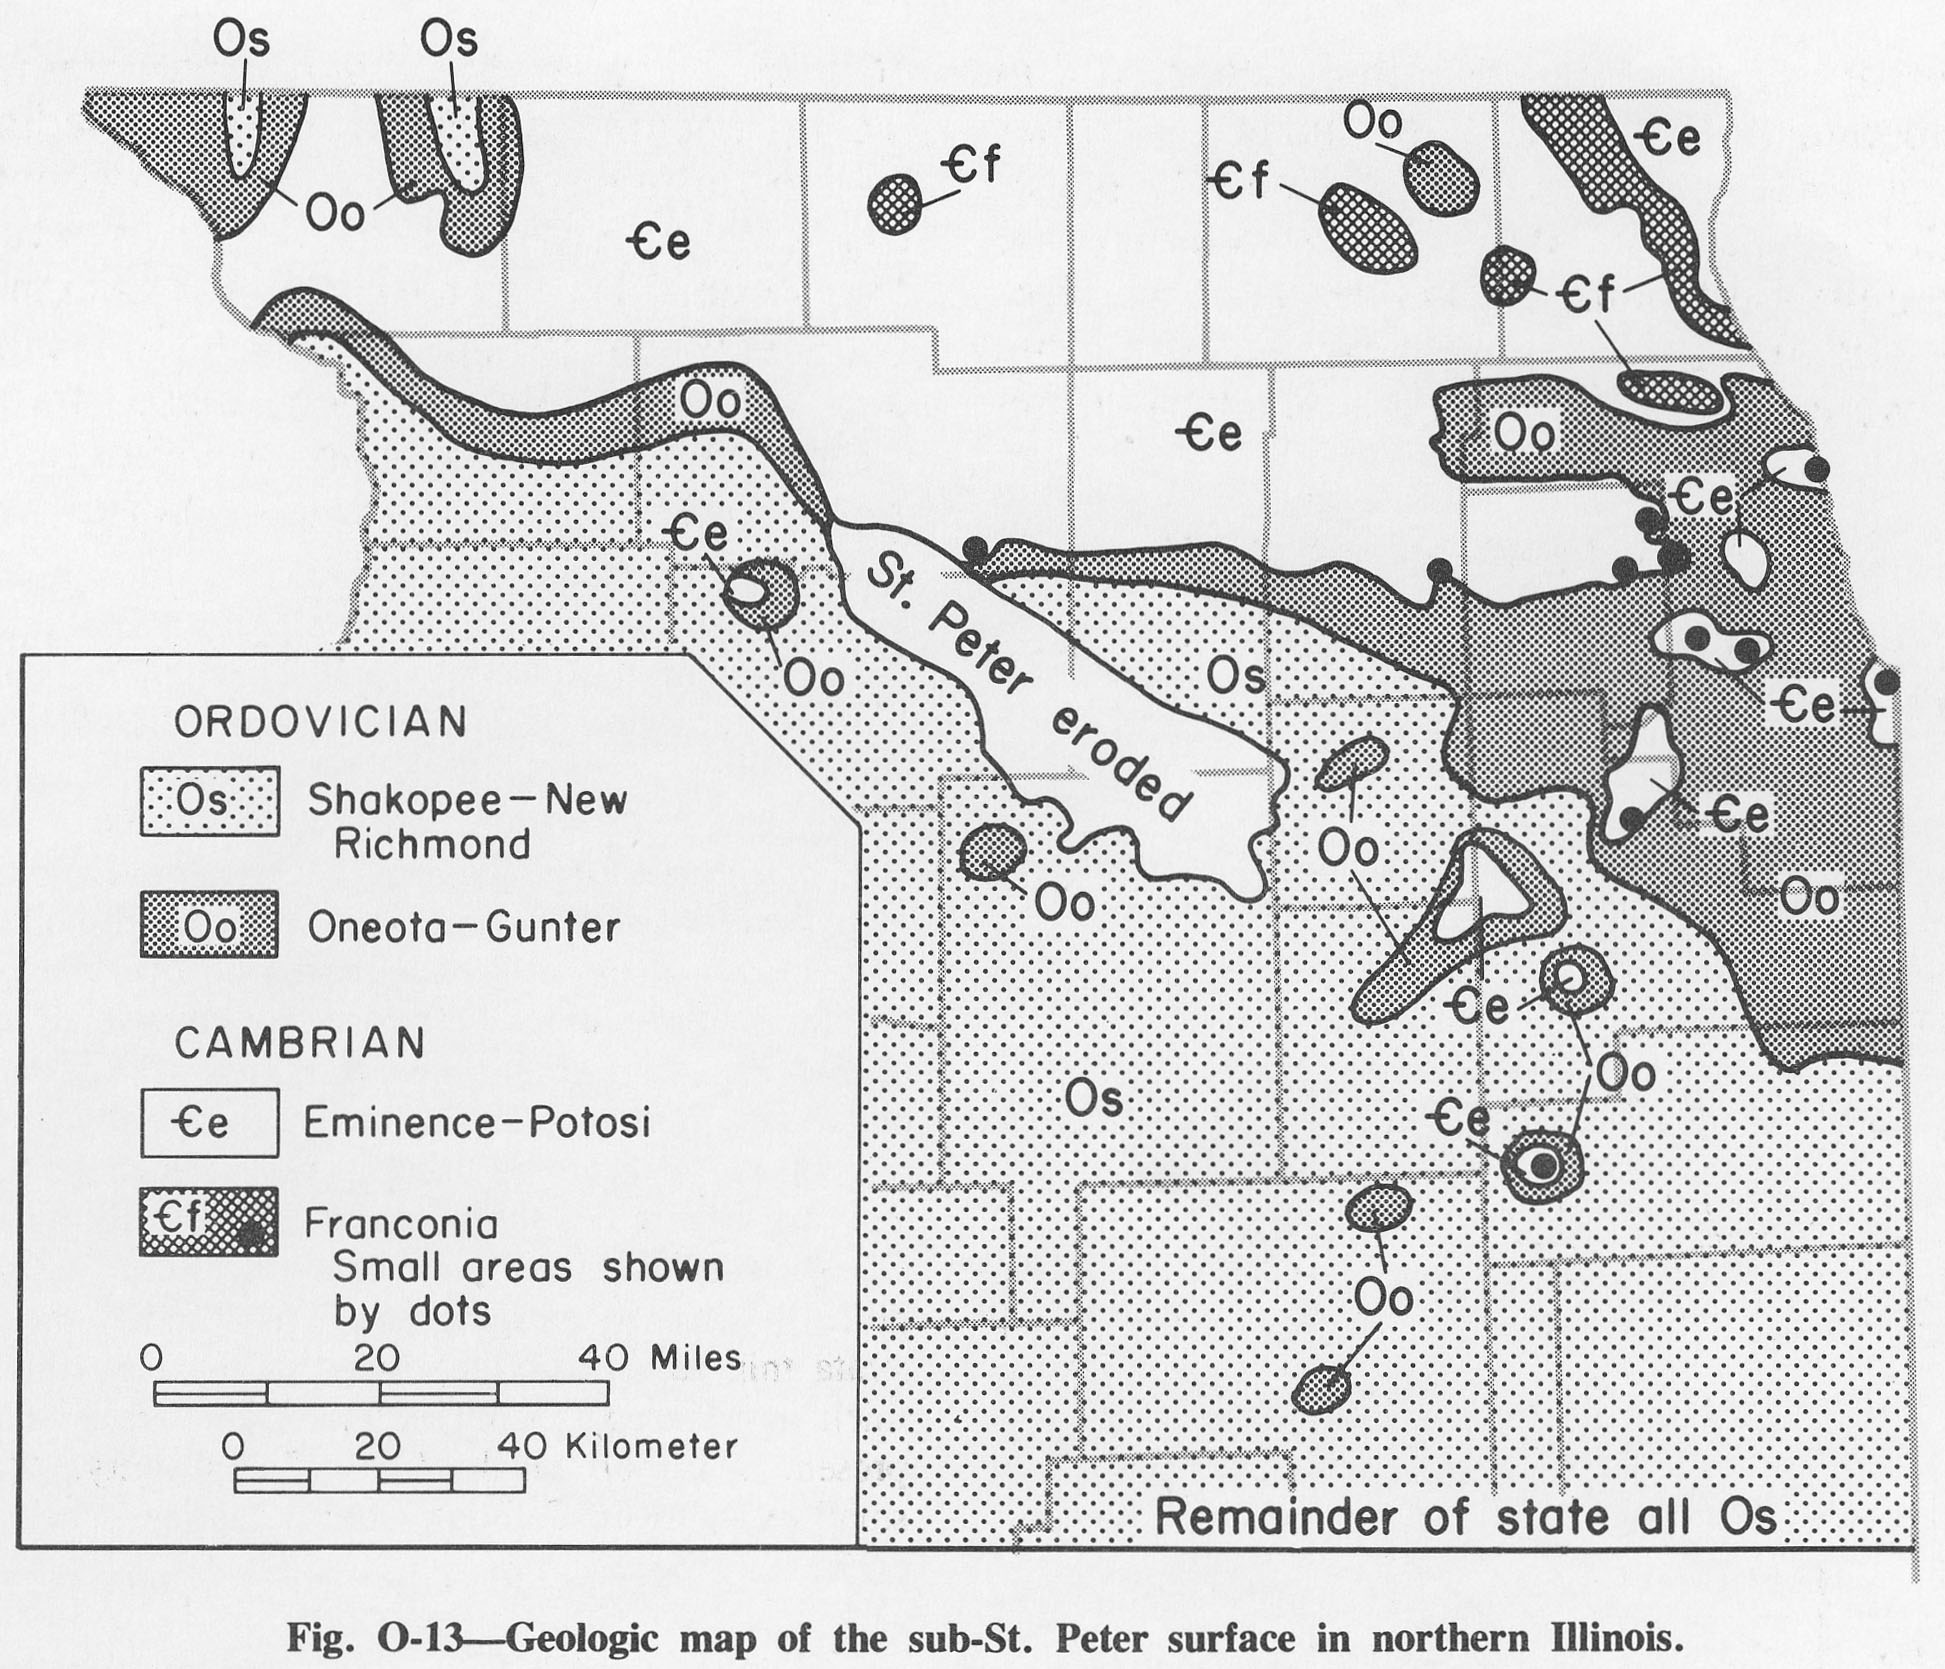
| 14:53, 4 April 2016 | Figure O-13.jpg (file) |  |
639 KB | Fig. O-13 -- Geologic map of the sub-St. Peter surface in northern Illinois. | 1 |
| 14:52, 4 April 2016 | Figure O-12.jpg (file) |  |
583 KB | Fig. O-12 -- Development of the classification of the Champlainian Series. | 1 |
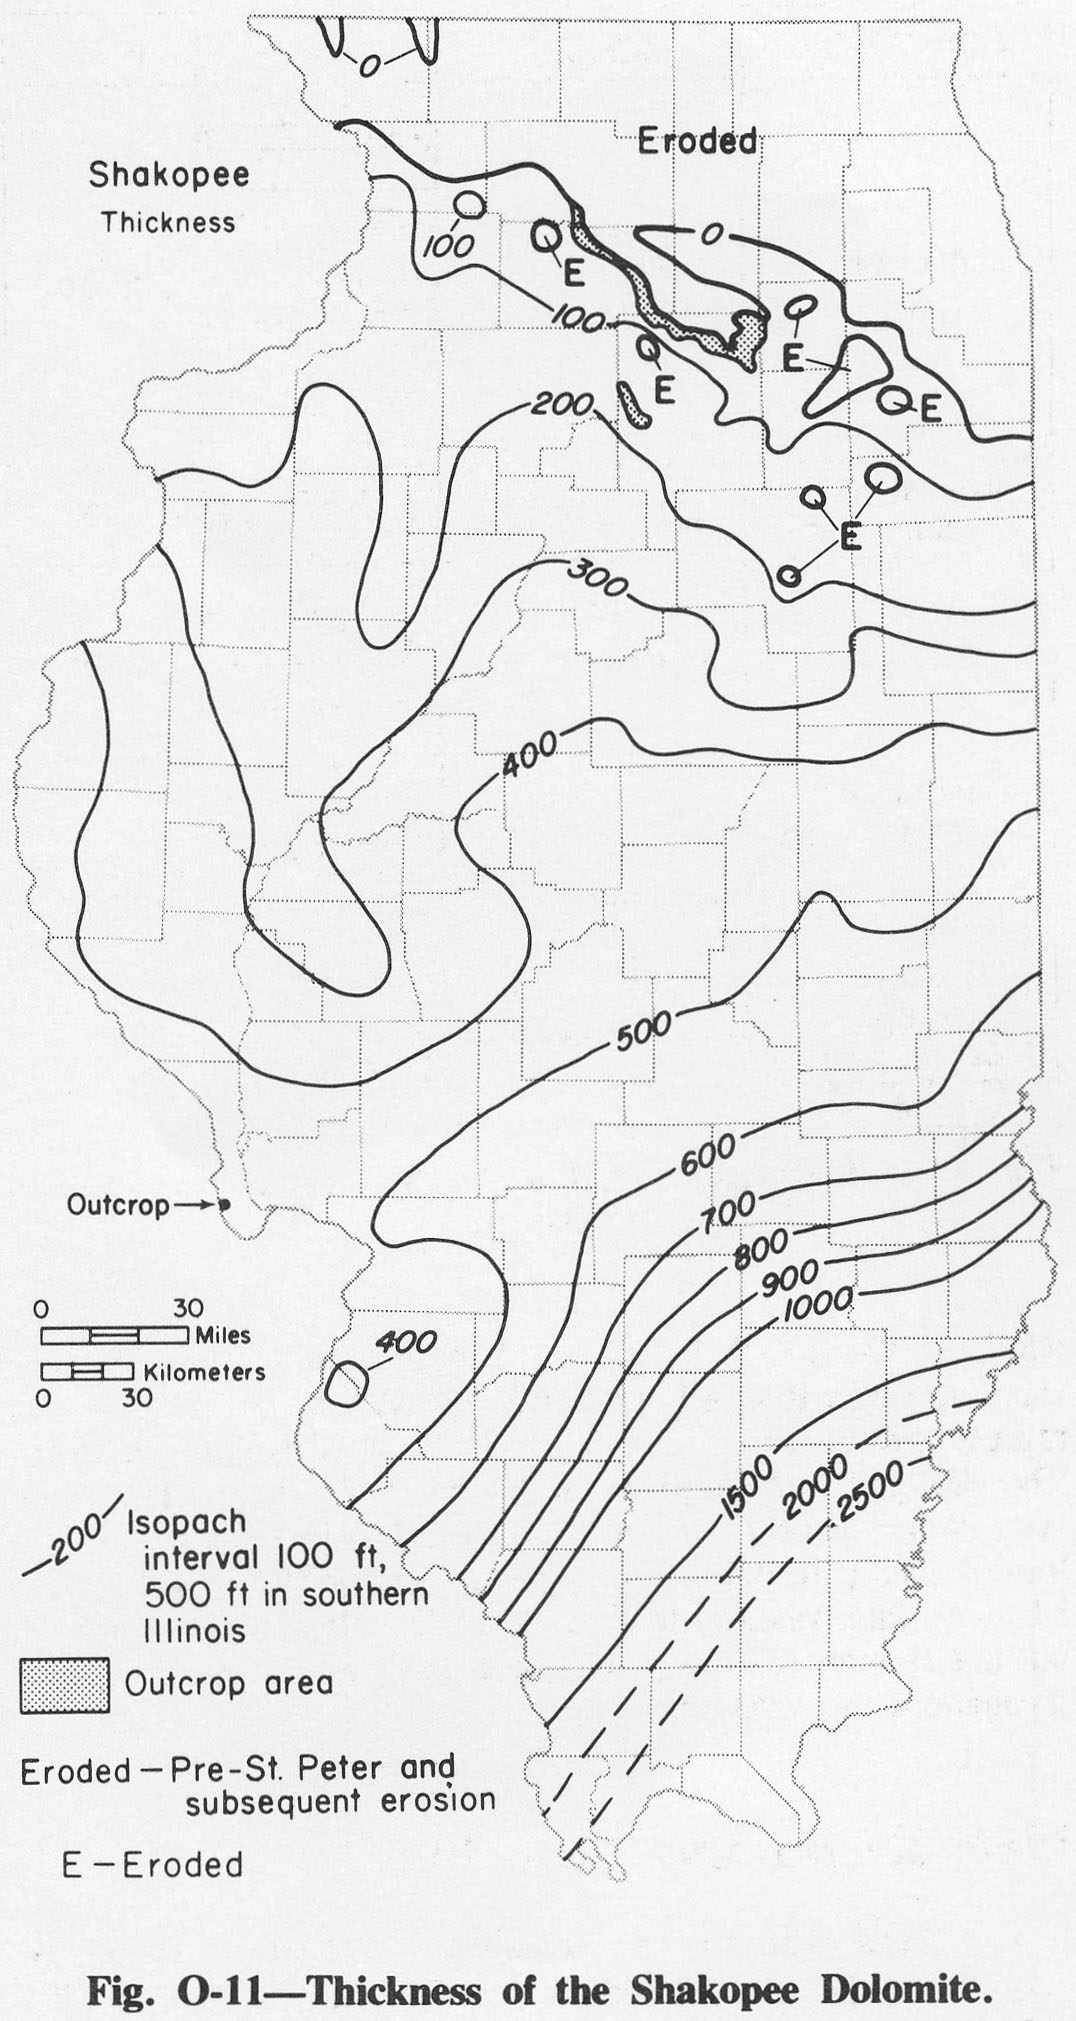
| 14:51, 4 April 2016 | Figure O-11.jpg (file) |  |
306 KB | Fig. O-11 -- Thickness of the Shakoppe Dolomite. | 1 |
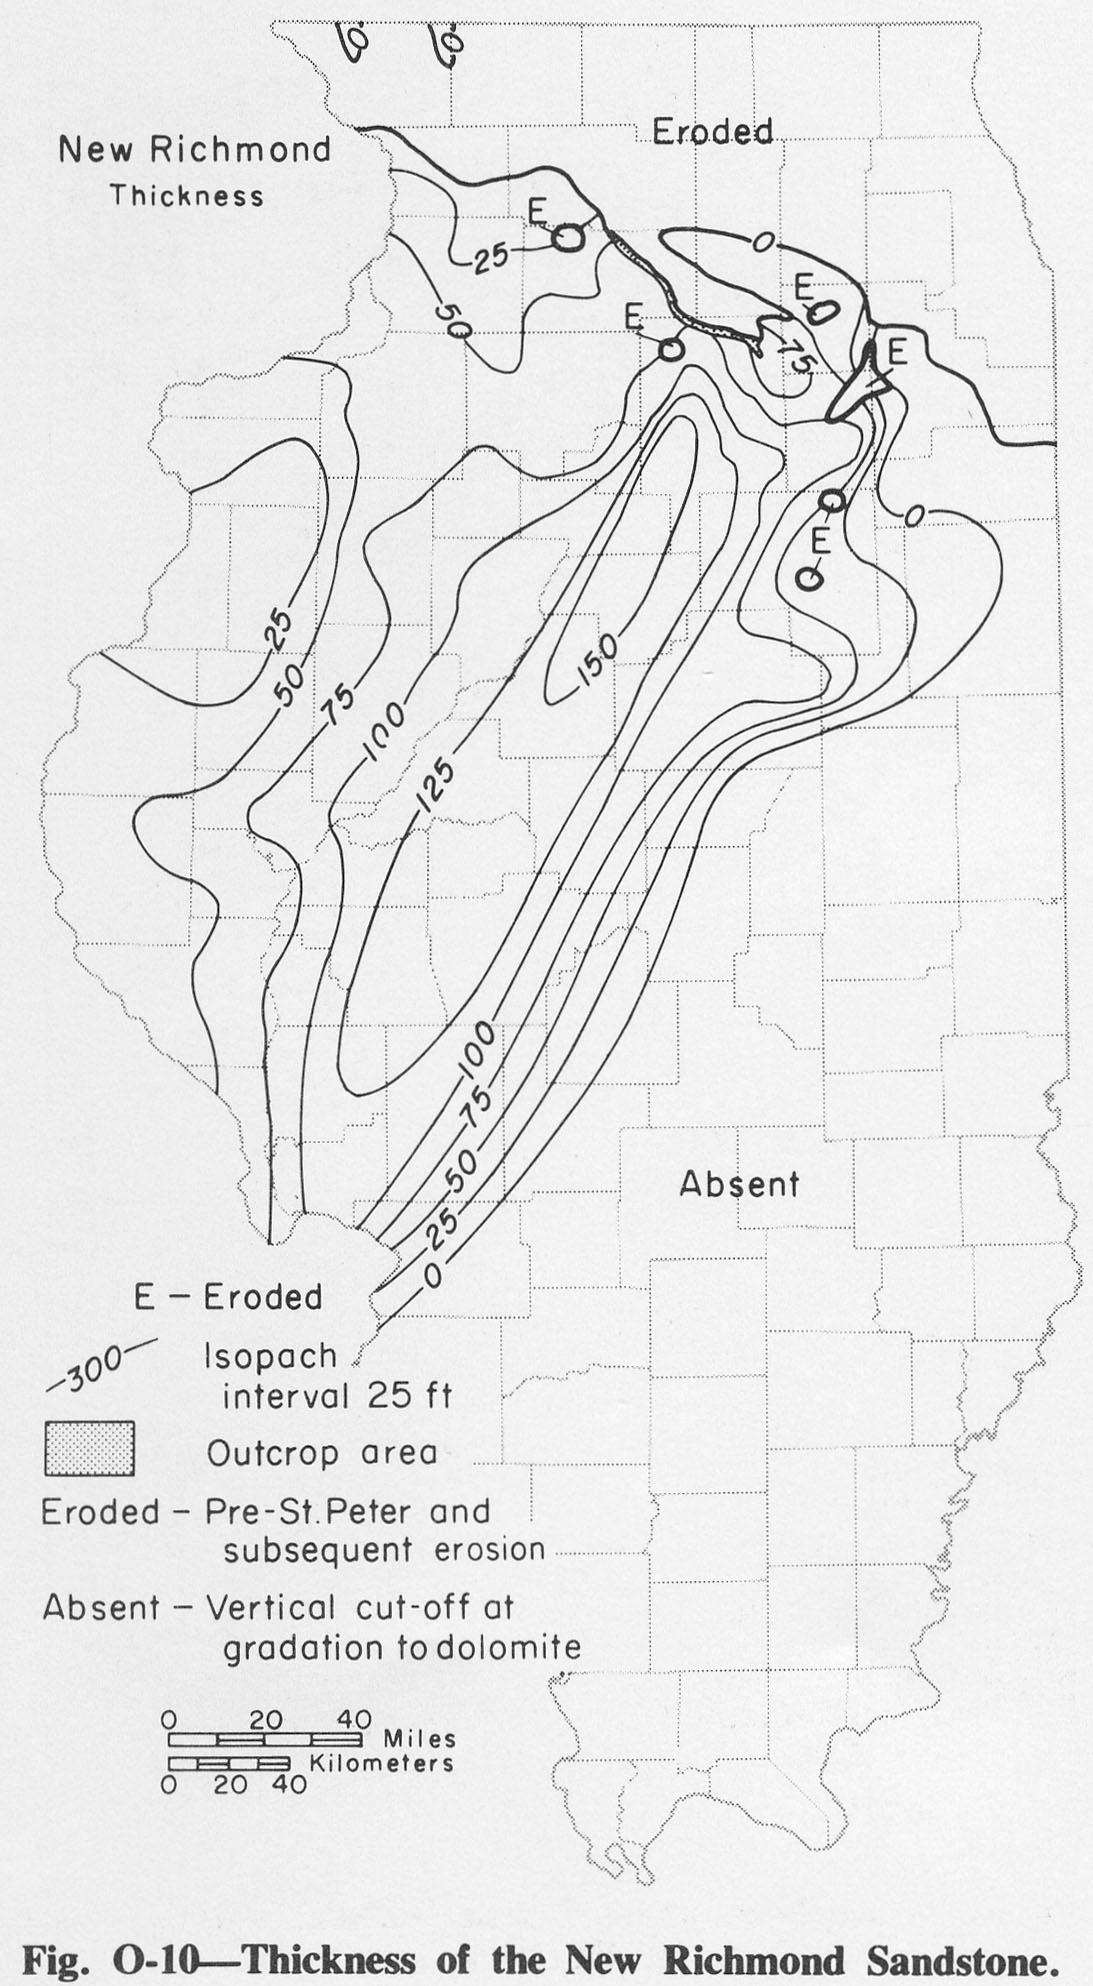
| 14:51, 4 April 2016 | Figure O-10.jpg (file) |  |
287 KB | Fig. O-10 -- Thickness of the New Richmond Sandstone. | 1 |
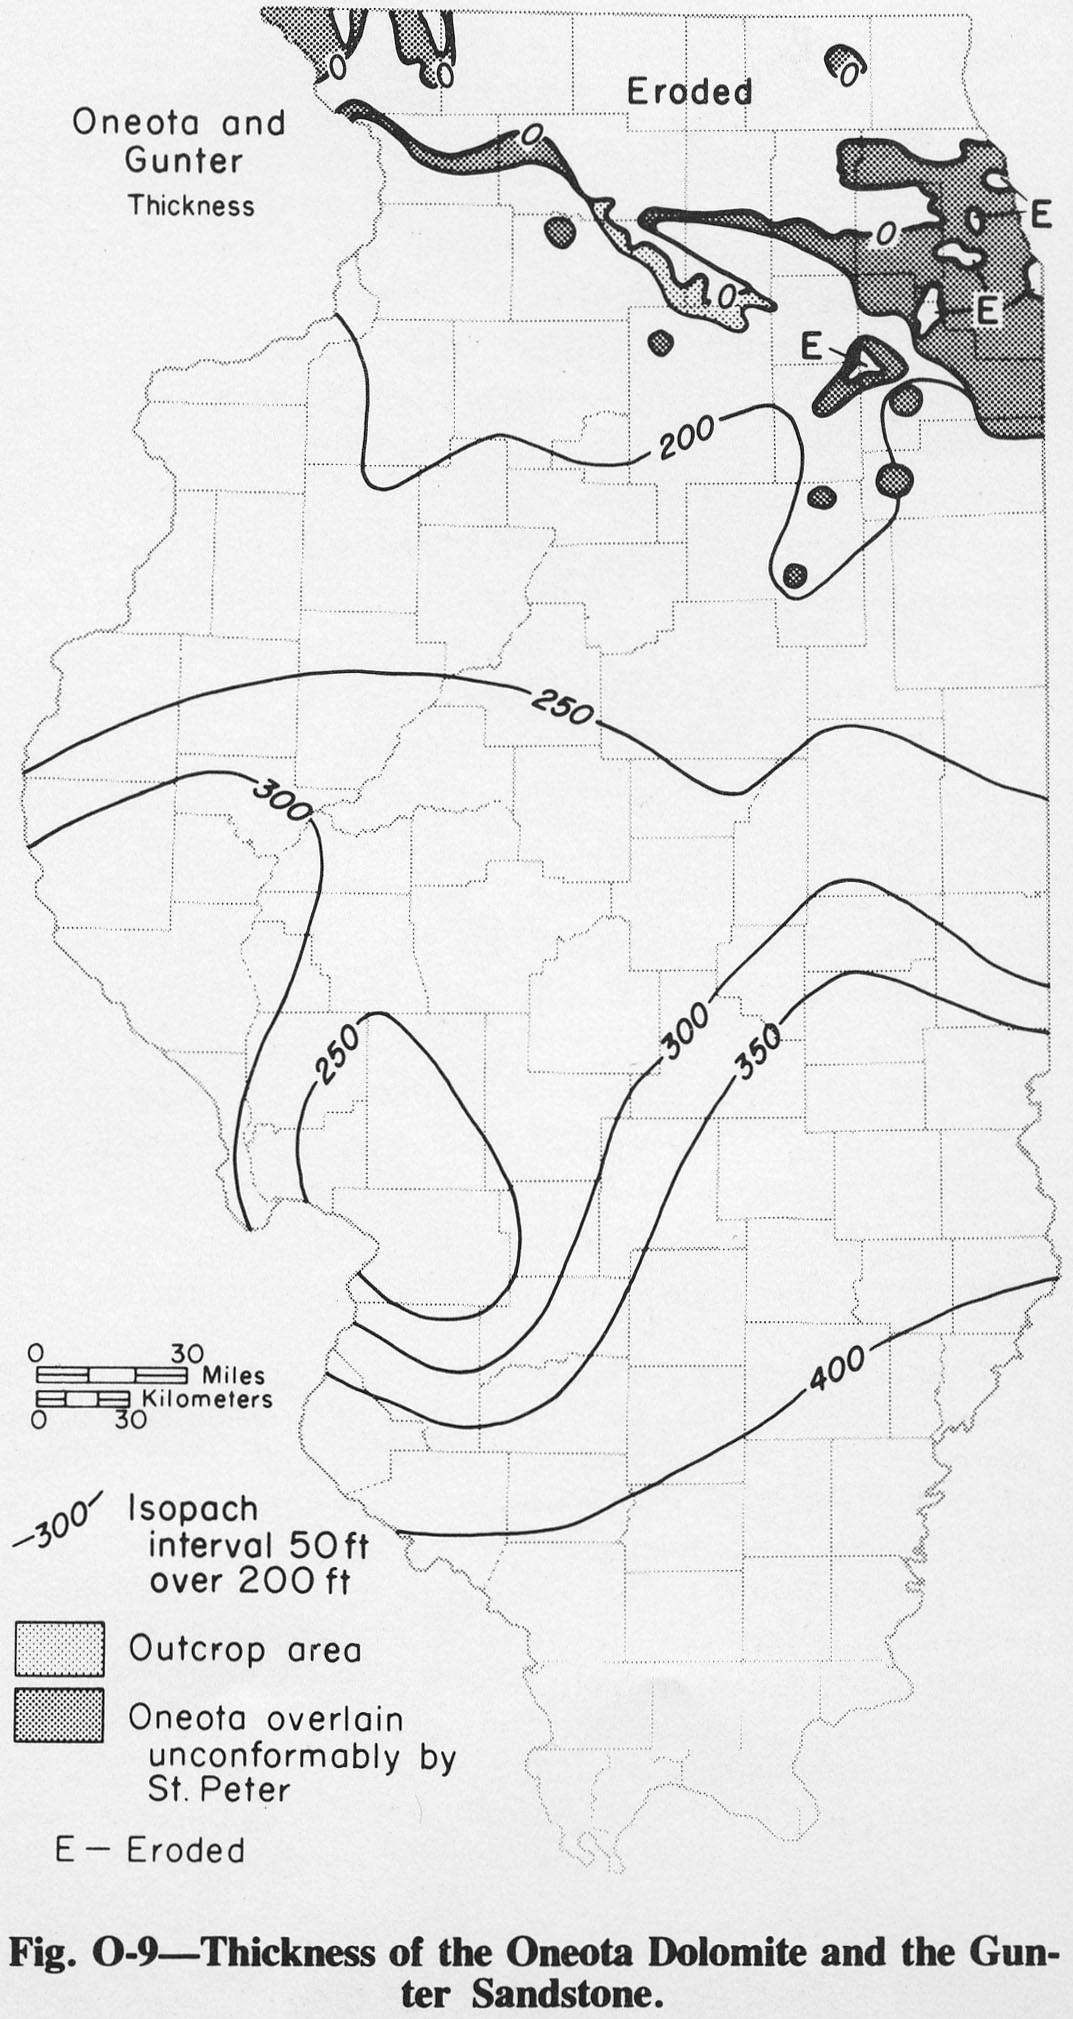
| 14:50, 4 April 2016 | Figure O-9.jpg (file) |  |
291 KB | Fig. O-9 -- Thickness of the Oneota Dolomite and the Gunter Sandstone. | 1 |
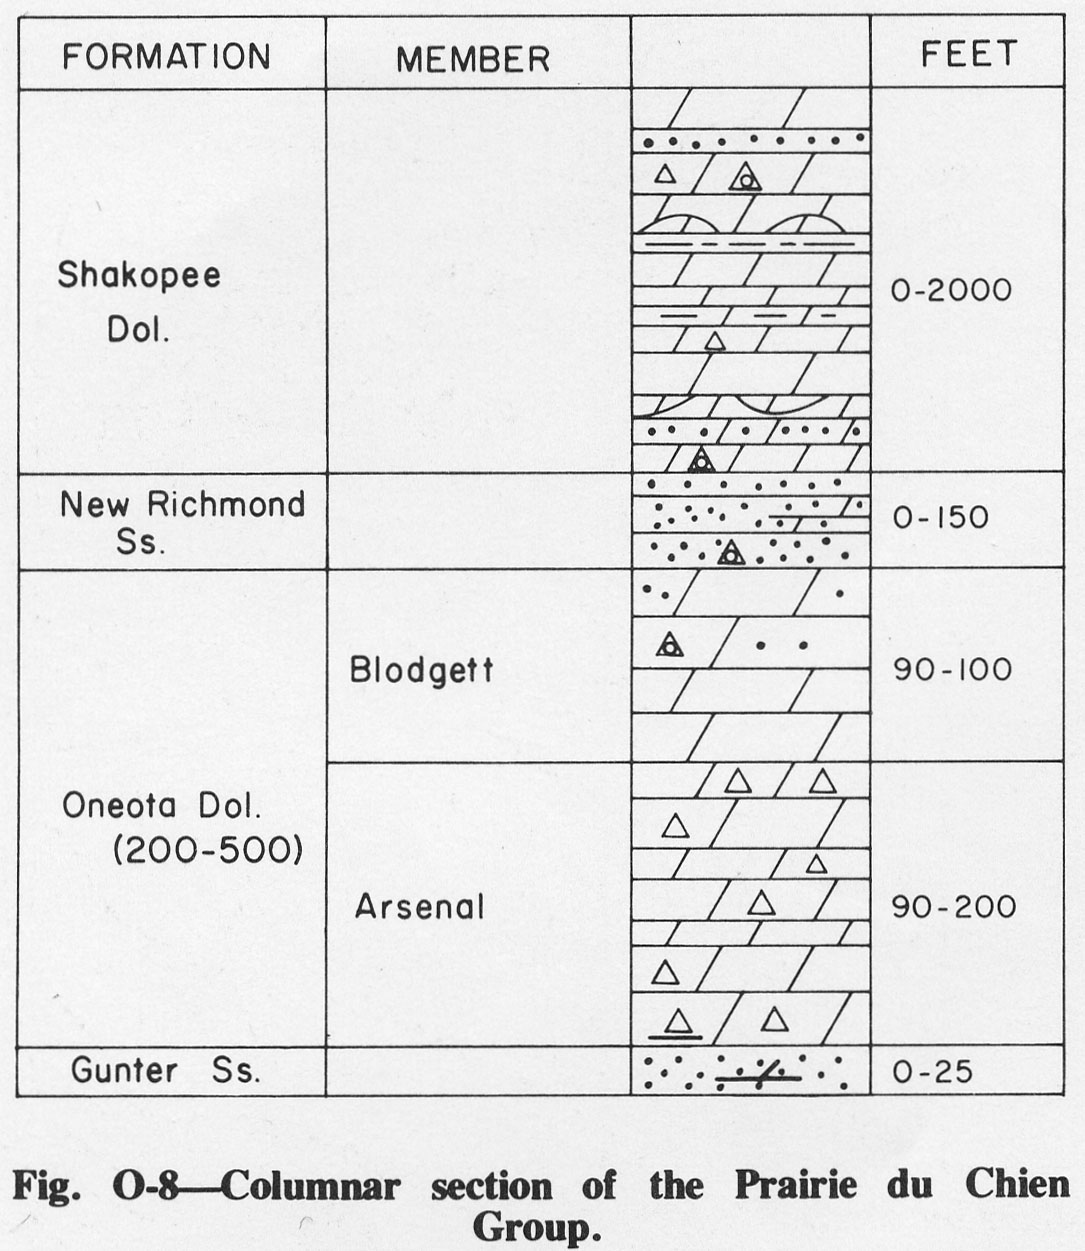
| 14:49, 4 April 2016 | Figure O-8.jpg (file) |  |
225 KB | Fig. O-8 -- Columnar section of the Prairie du Chien Group. | 1 |
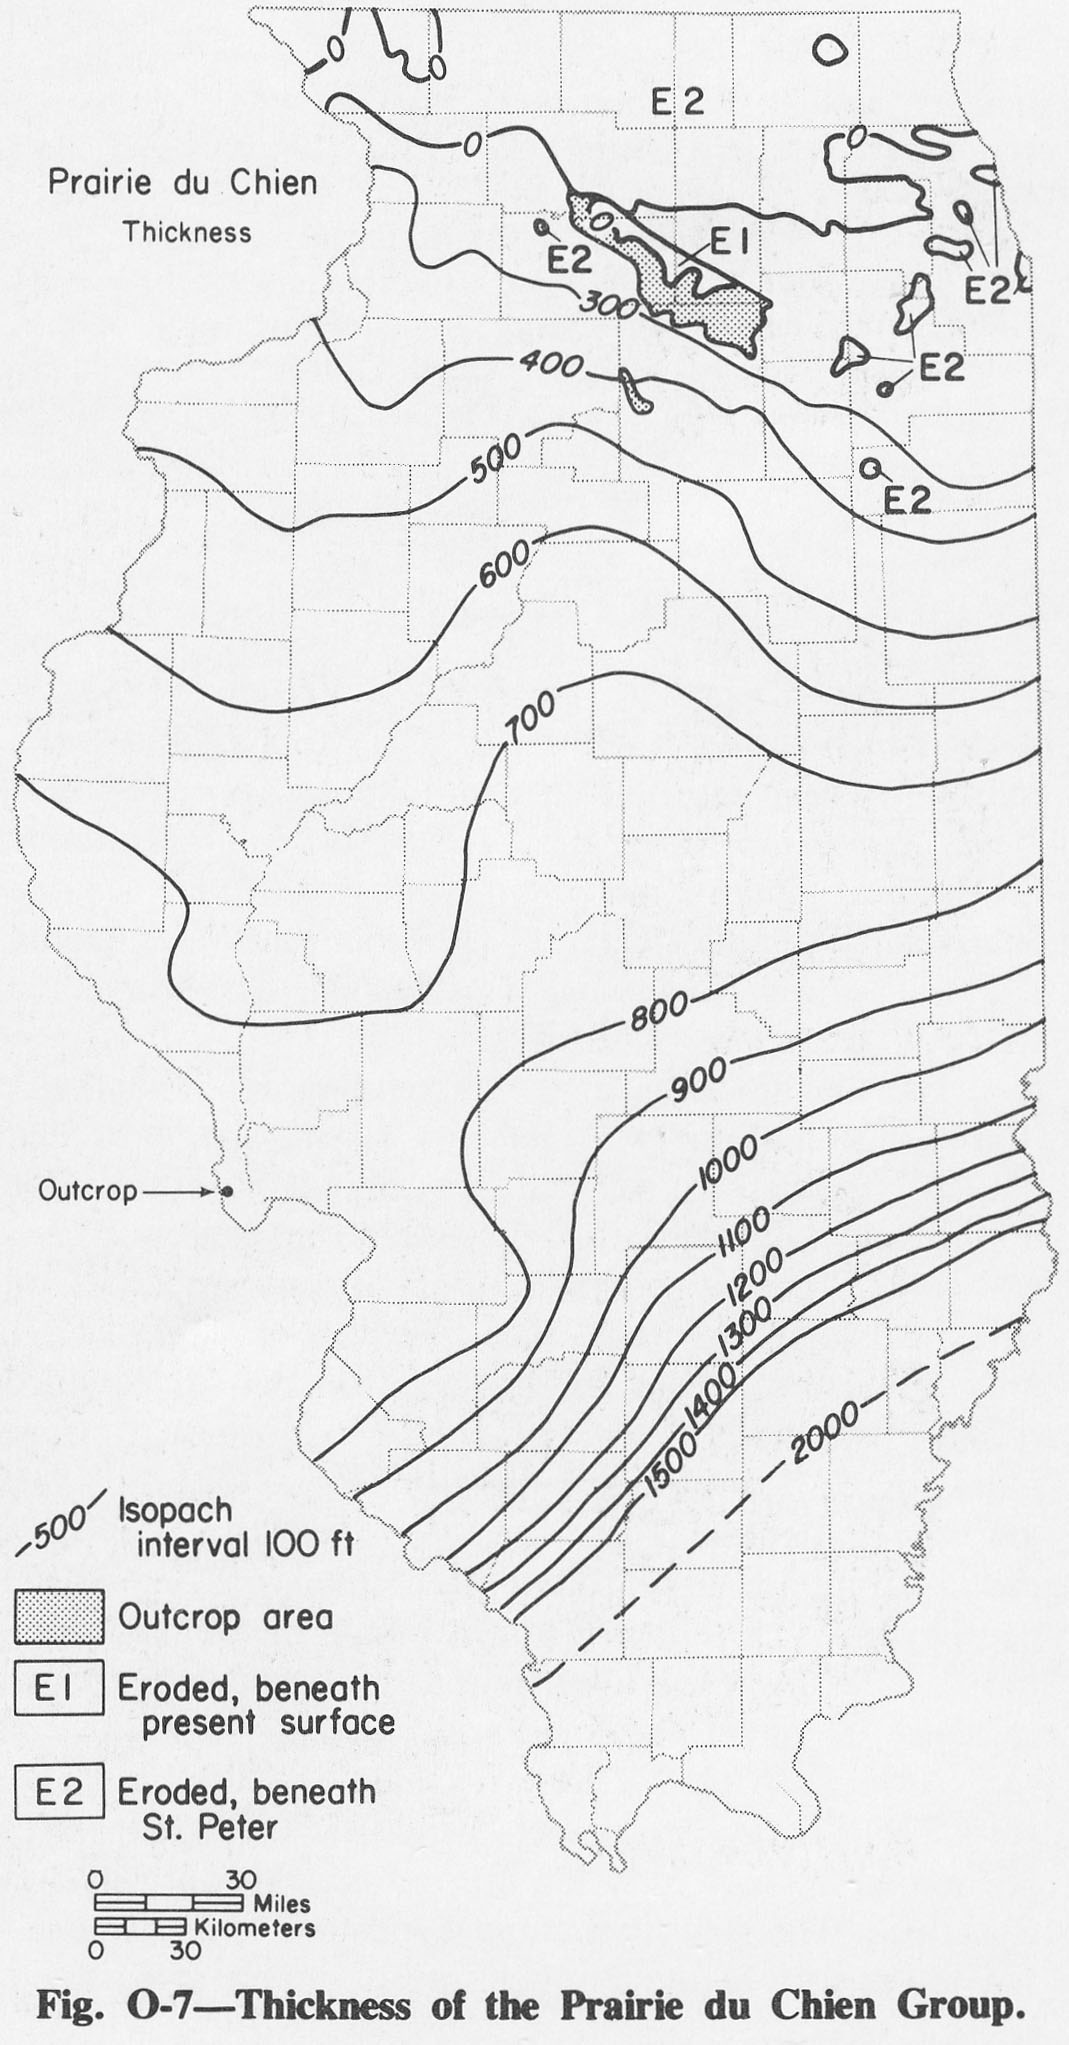
| 14:48, 4 April 2016 | Figure O-7.jpg (file) |  |
289 KB | Fig. O-7 -- Thickness of the Prairie du Chien Group. | 1 |
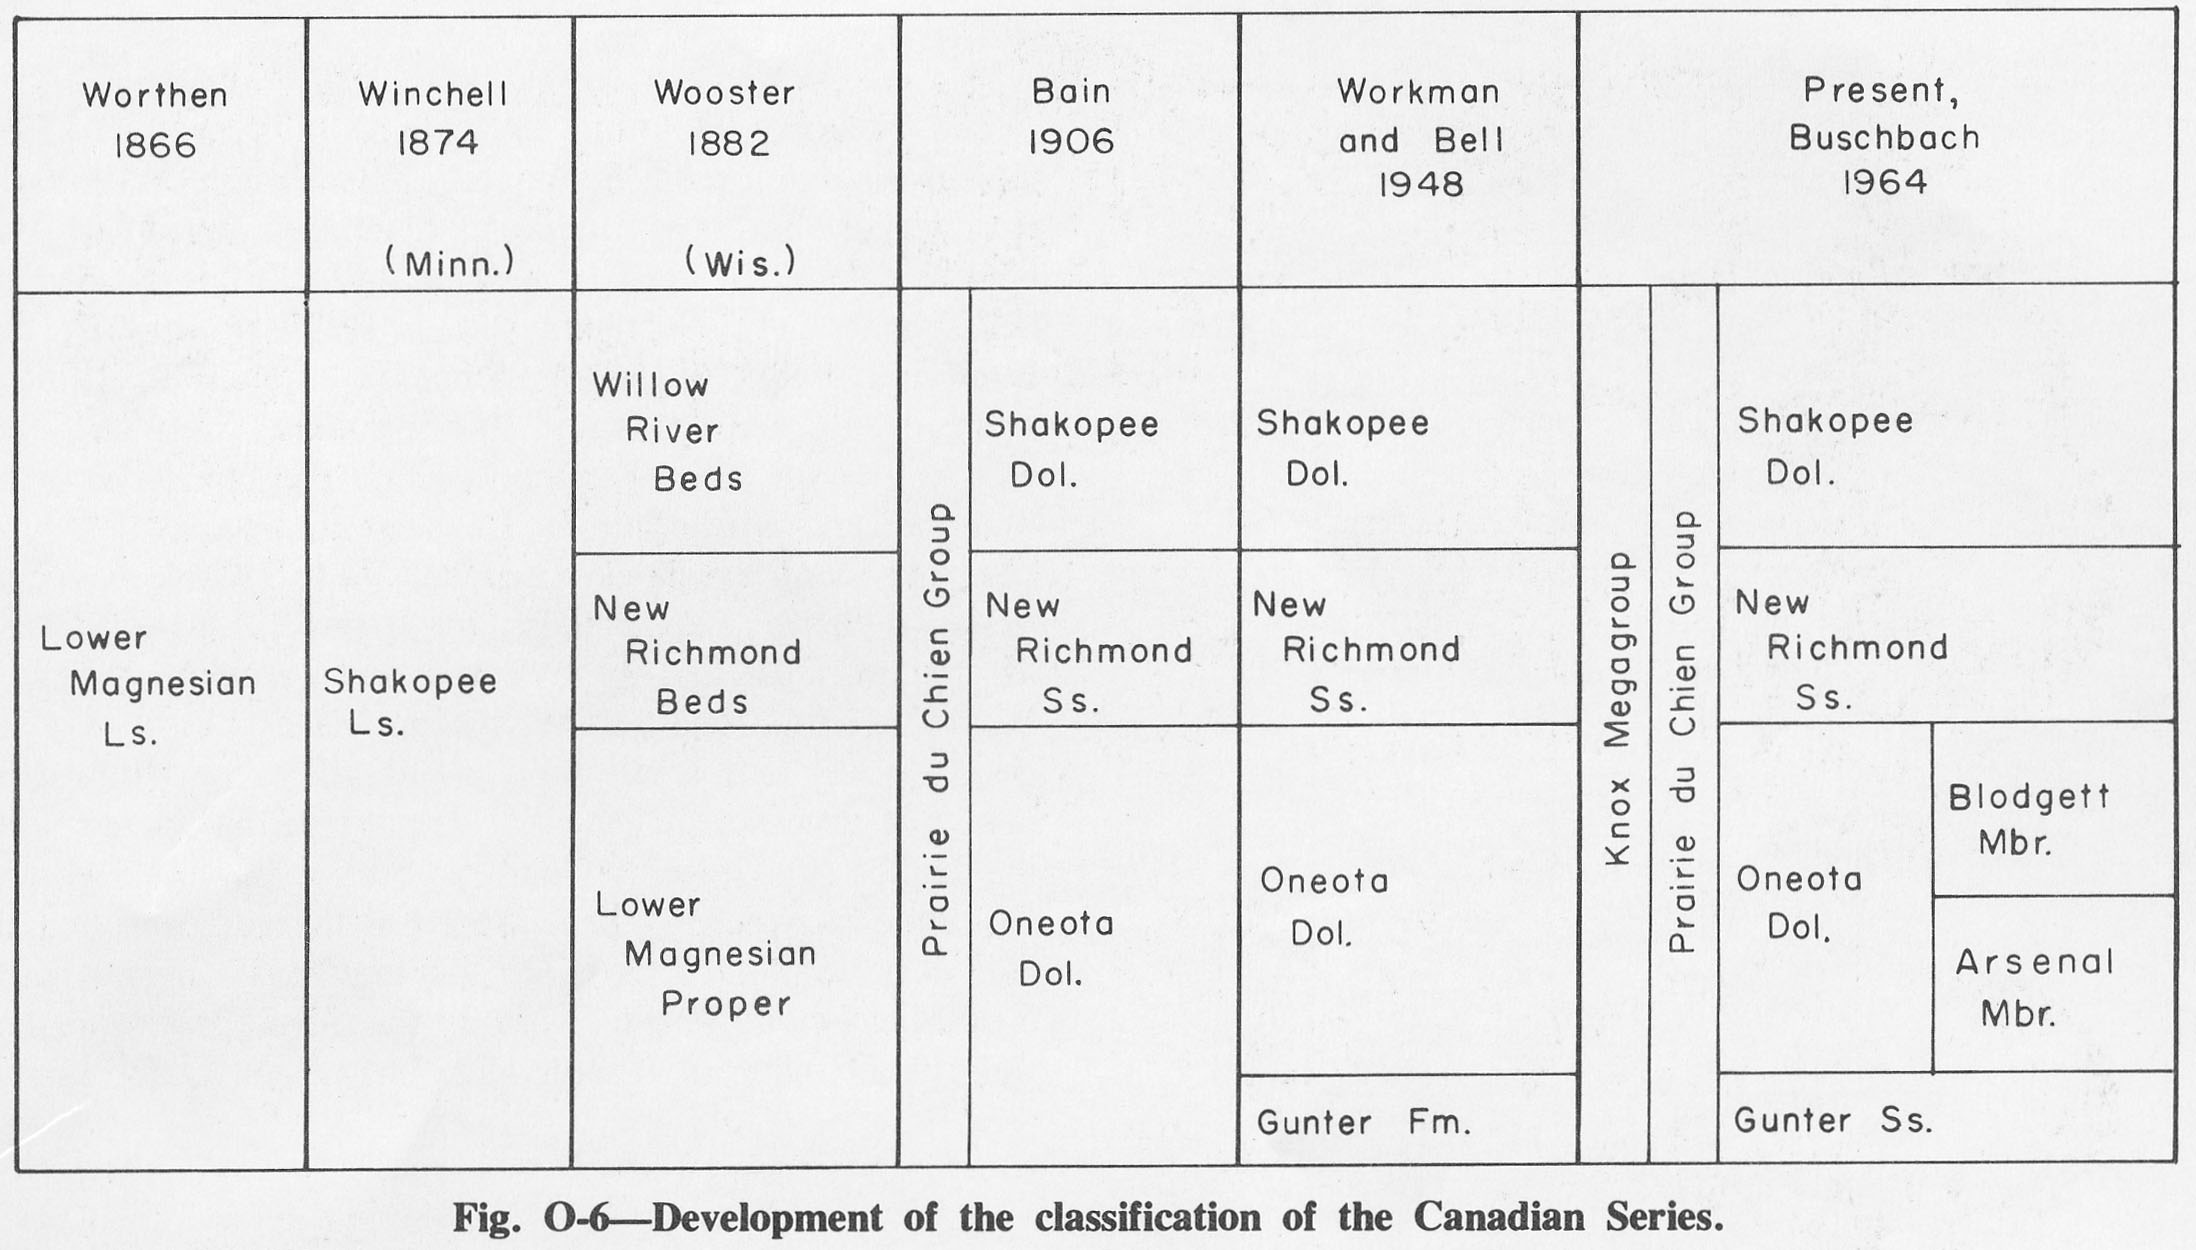
| 14:47, 4 April 2016 | Figure O-6.jpg (file) |  |
251 KB | Fig. O-6 -- Development of the Classification of the Canadian Series. | 1 |
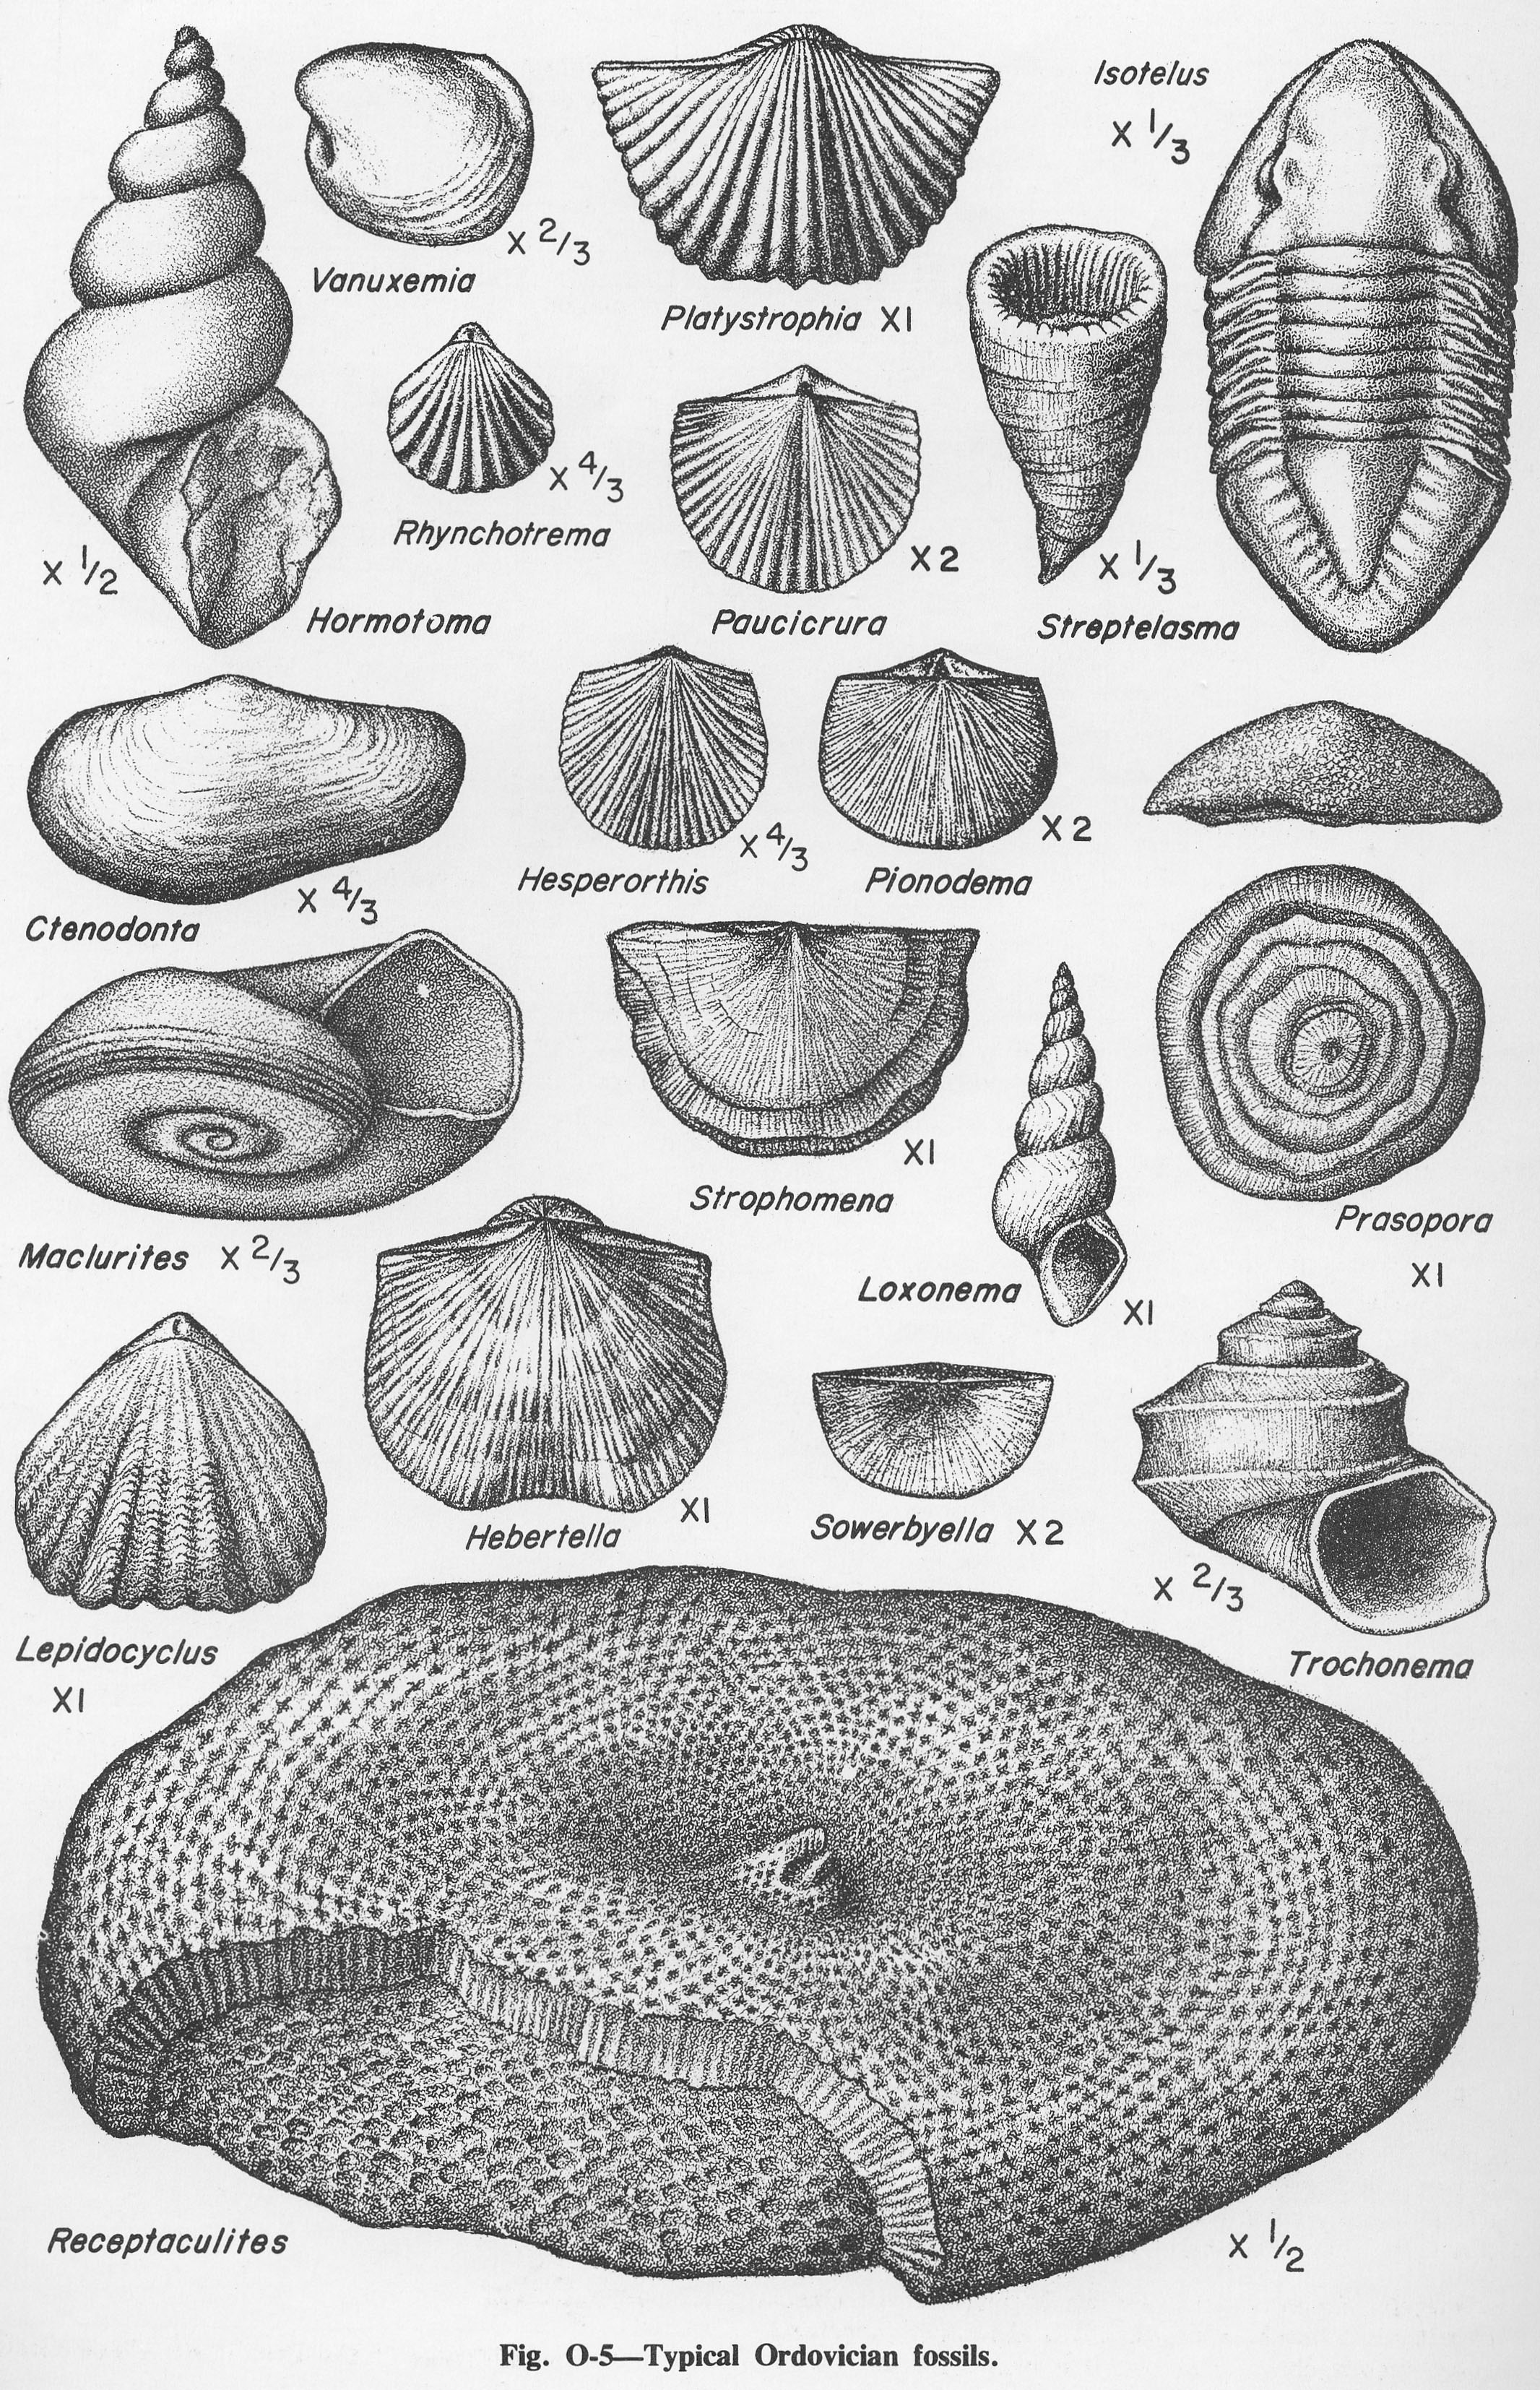
| 14:46, 4 April 2016 | Figure O-5.jpg (file) |  |
1.9 MB | Fig. O-5 -- Typical Ordovician fossils | 1 |
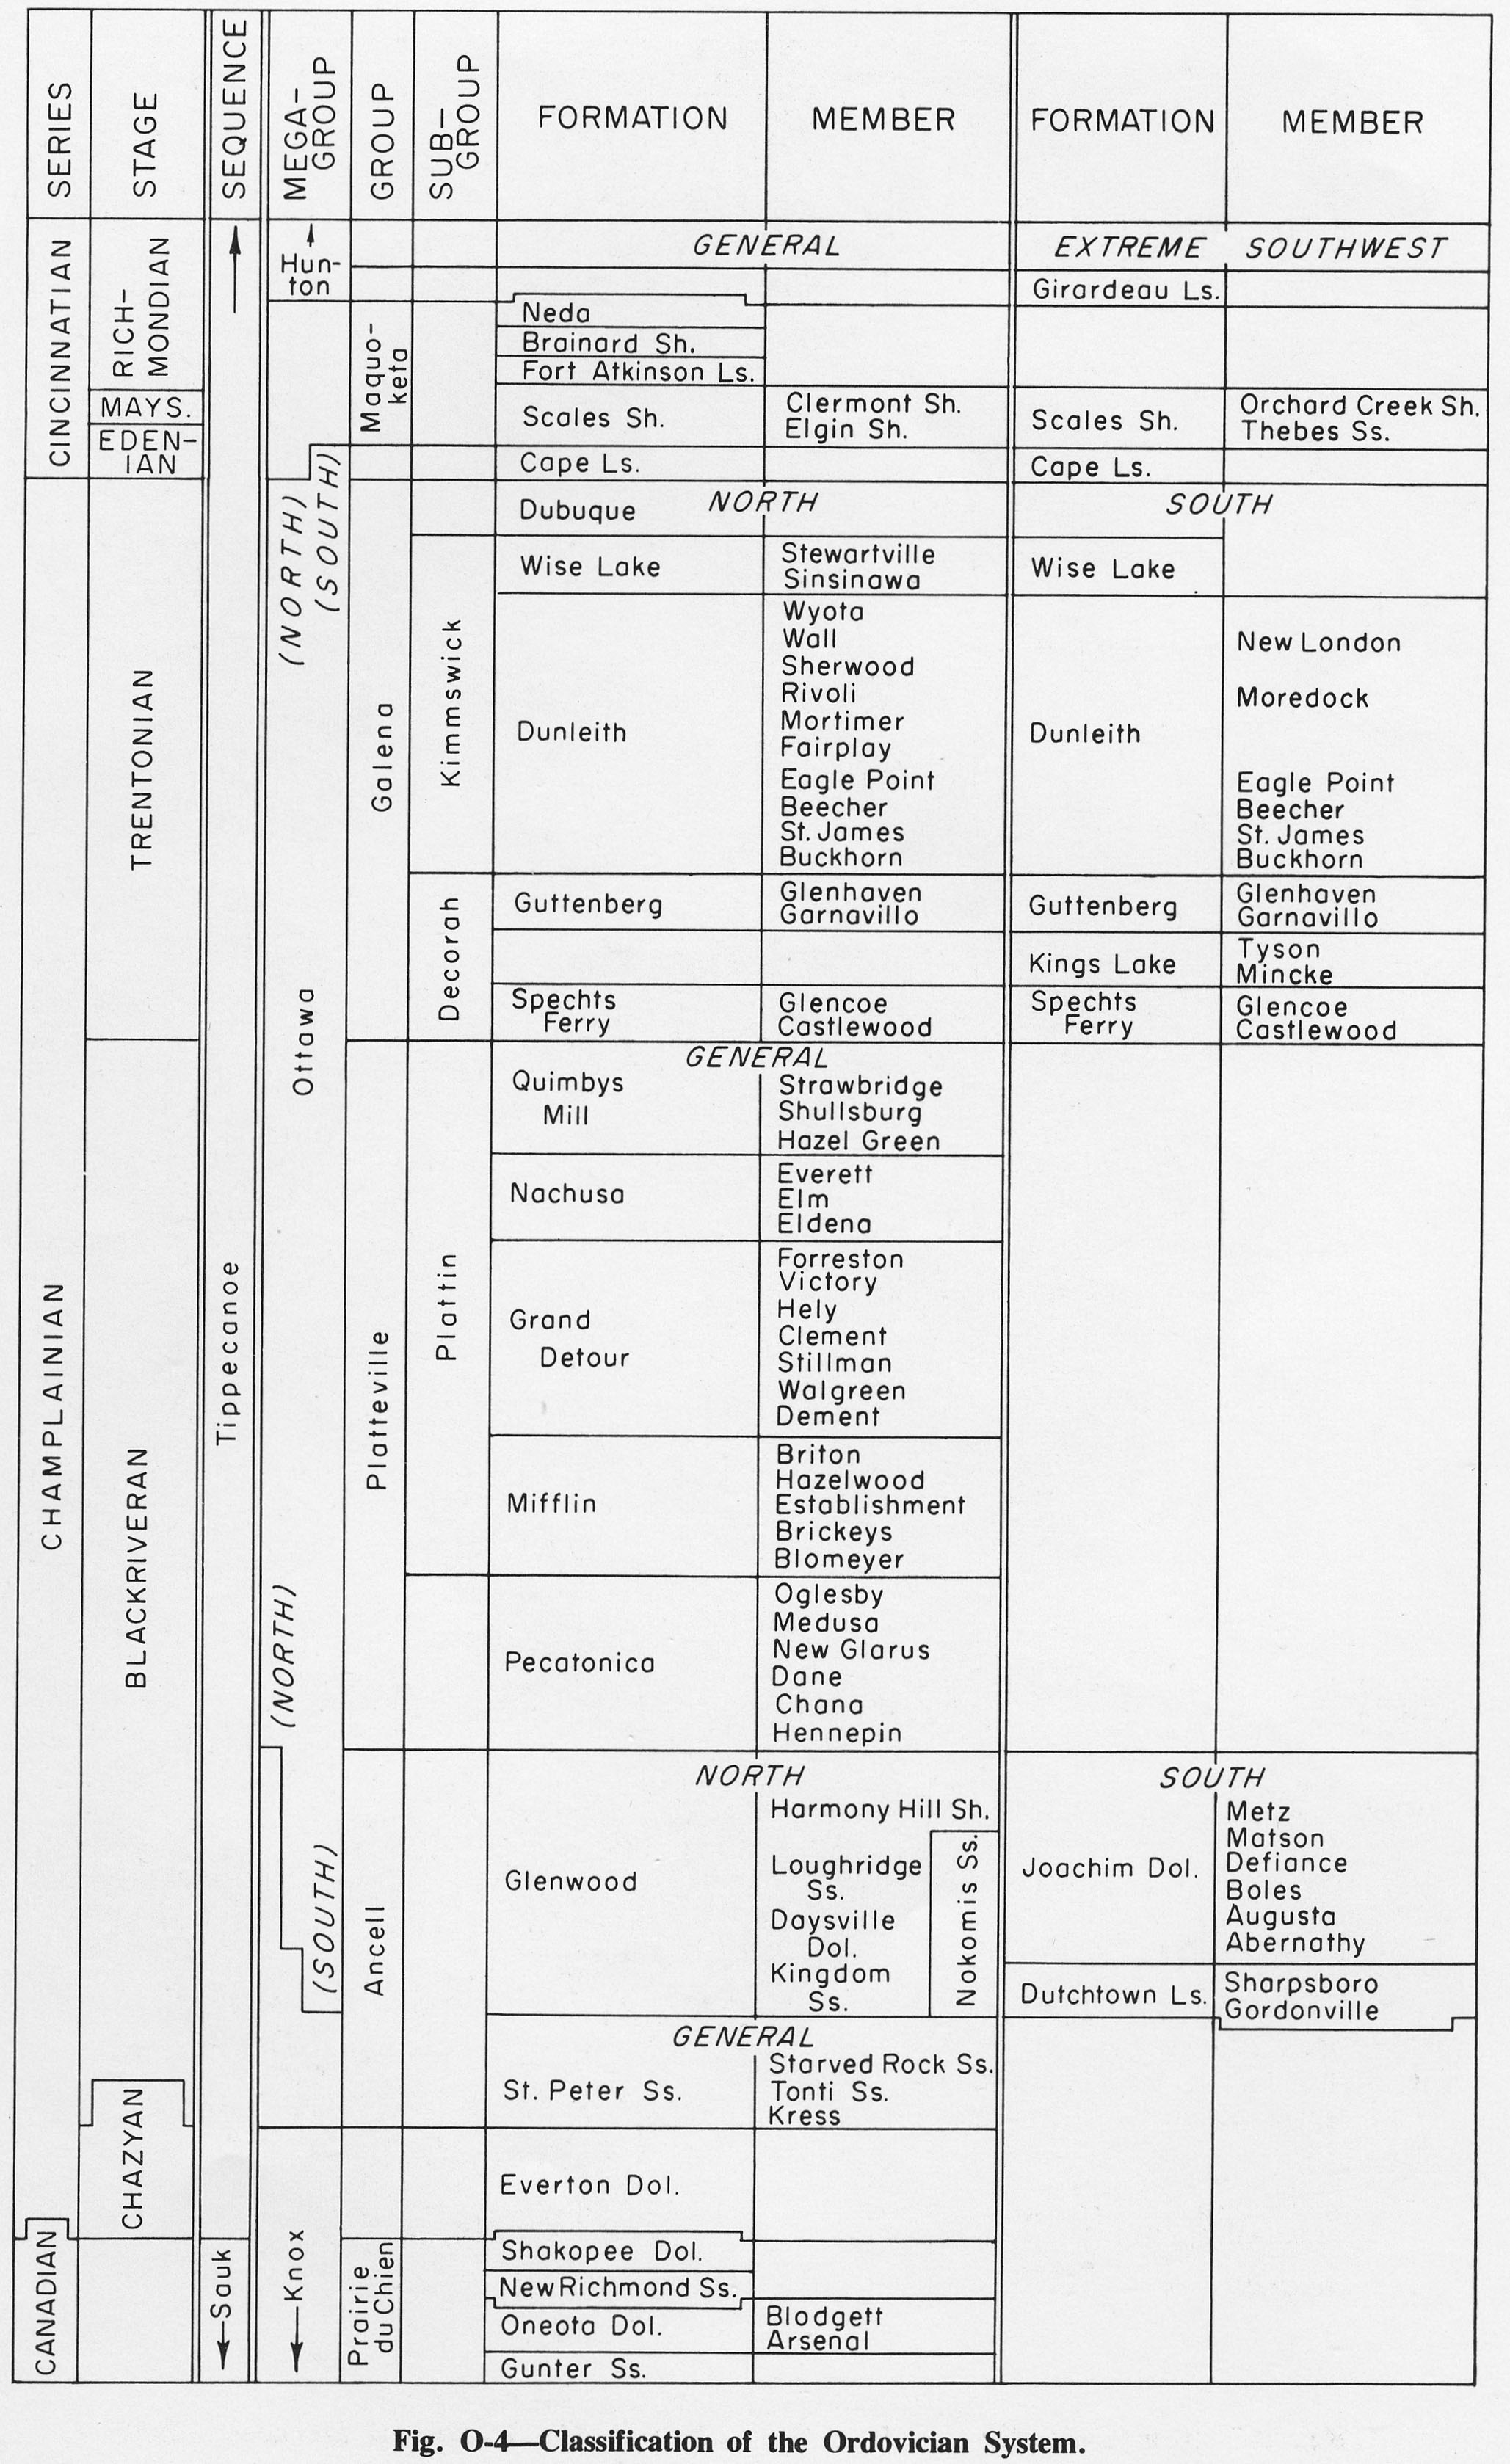
| 14:45, 4 April 2016 | Figure O-4.jpg (file) |  |
799 KB | Fig. O-4 -- Classification of the Ordovician System. | 1 |
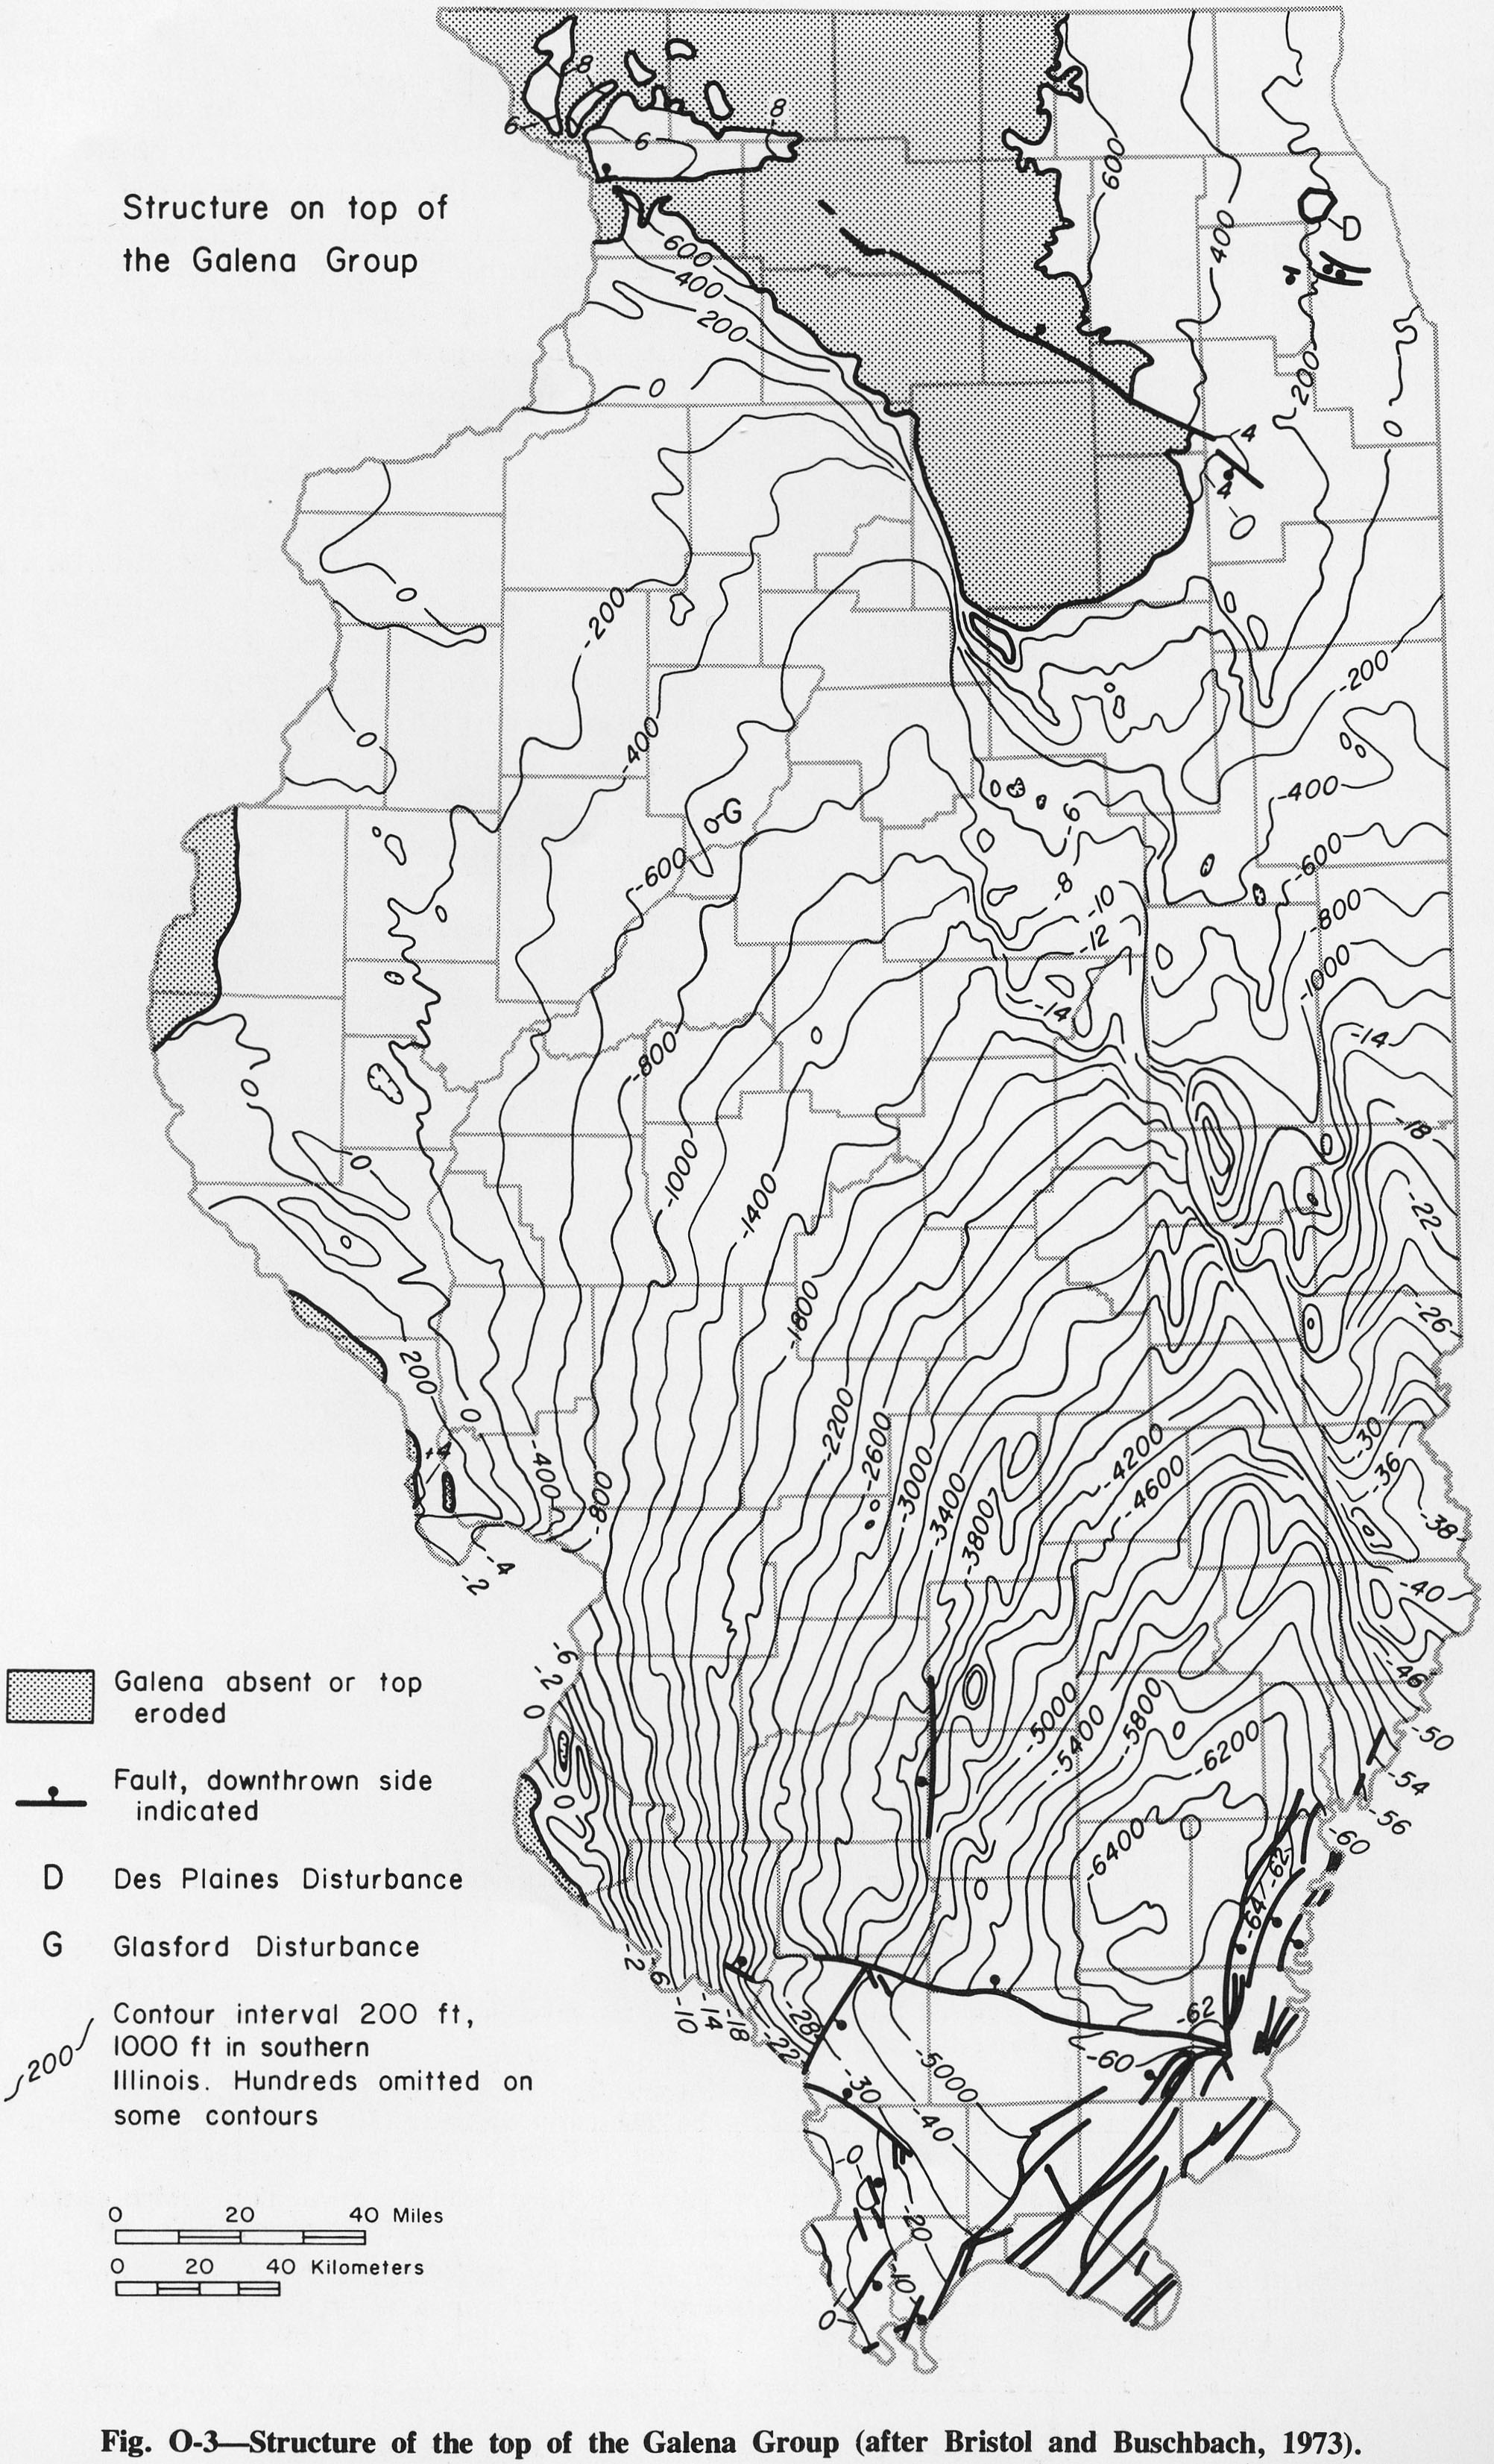
| 14:45, 4 April 2016 | Figure O-3.jpg (file) |  |
1.04 MB | Fig O-3 -- Structure of the top of the Galena Group (after Bristol and Buschbach, 1973). | 1 |
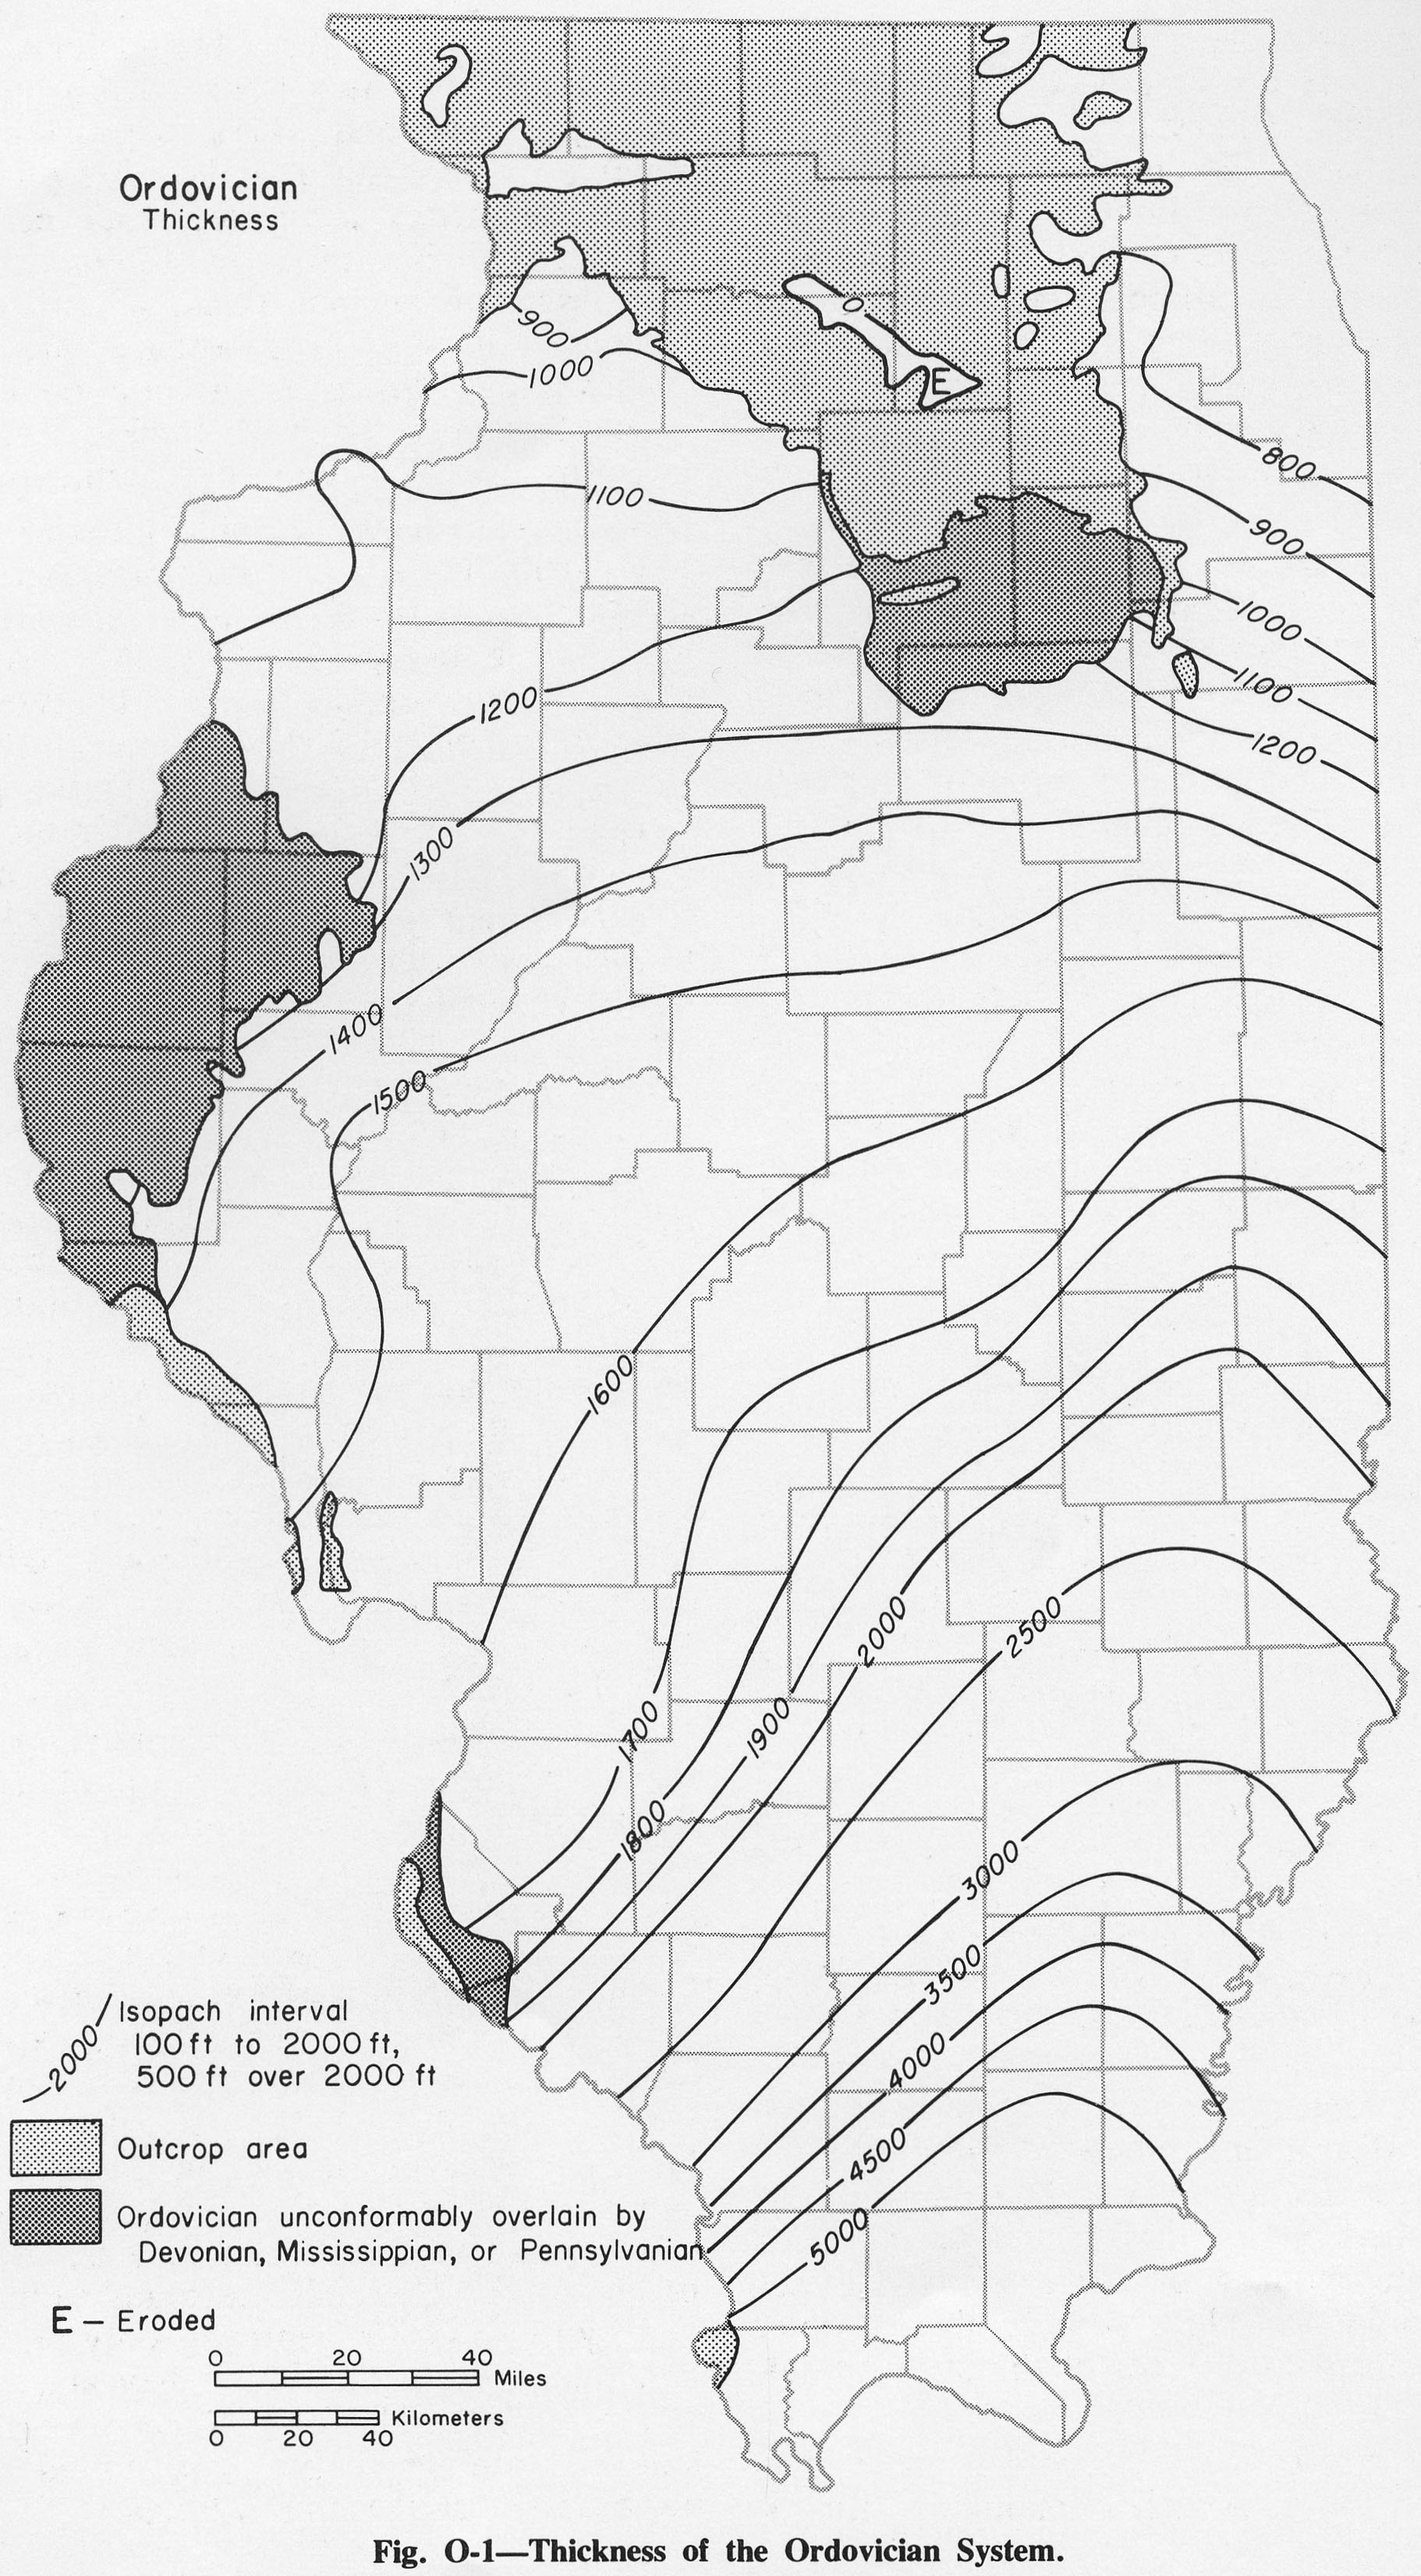
| 14:43, 4 April 2016 | Figure O-1.jpg (file) |  |
929 KB | Fig O-1 -- Thickness of Ordovician System. | 1 |
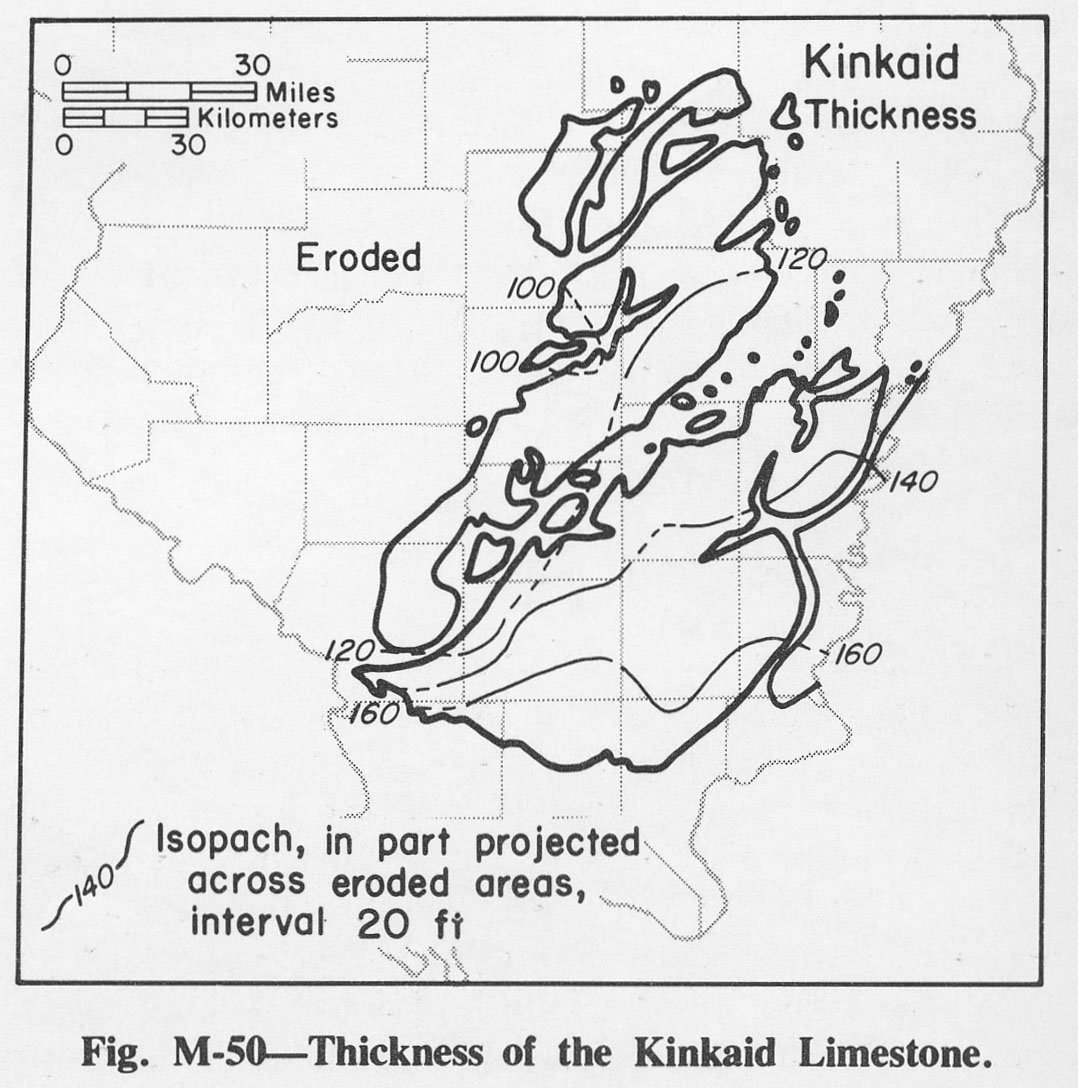
| 14:29, 4 April 2016 | Figure M-50.jpg (file) |  |
223 KB | Fig. M-50 -- Thickness of the Kinkaid Limestone. | 1 |
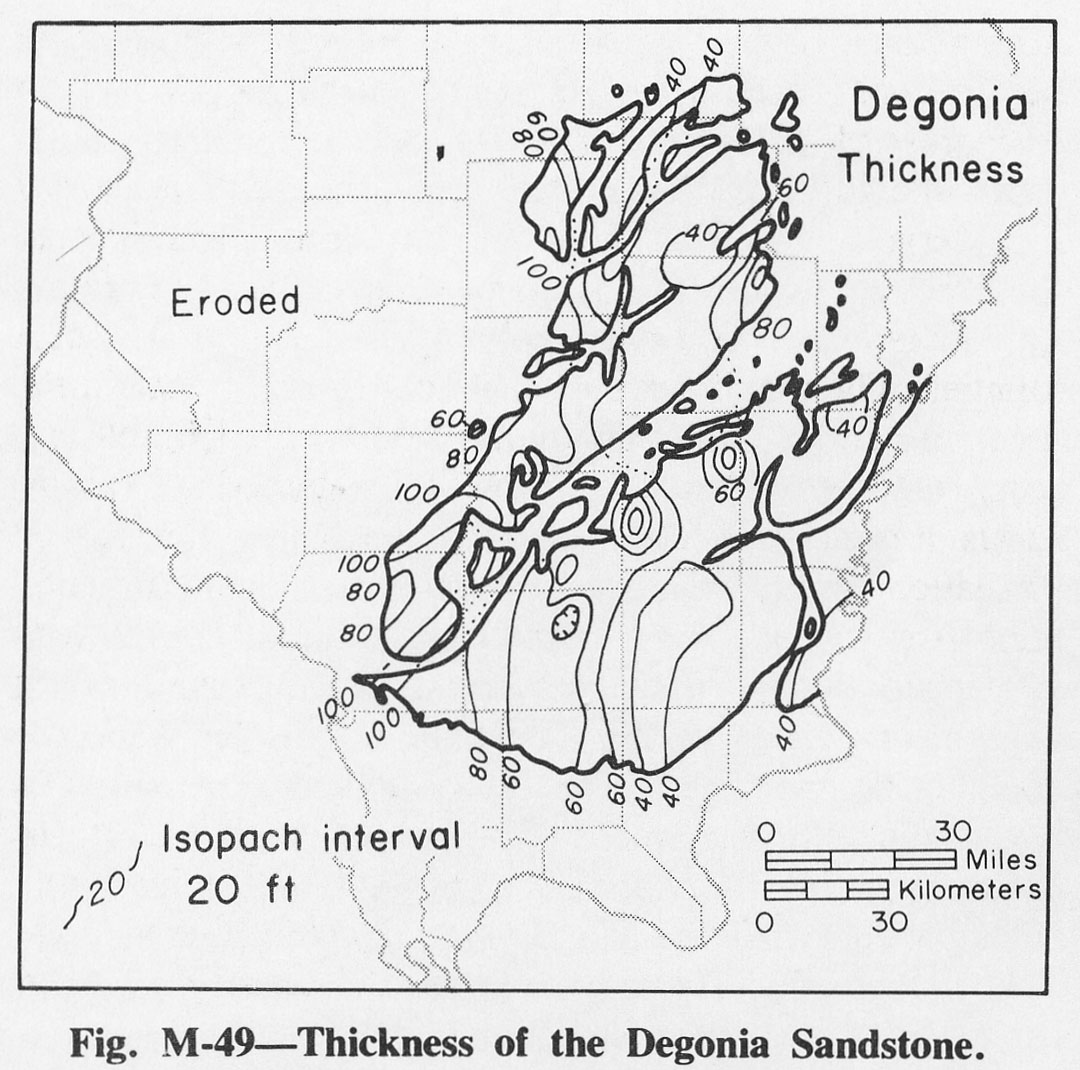
| 14:29, 4 April 2016 | Figure M-49.jpg (file) |  |
228 KB | Fig. M-49 -- Thickness of the Degonia Sandstone. | 1 |
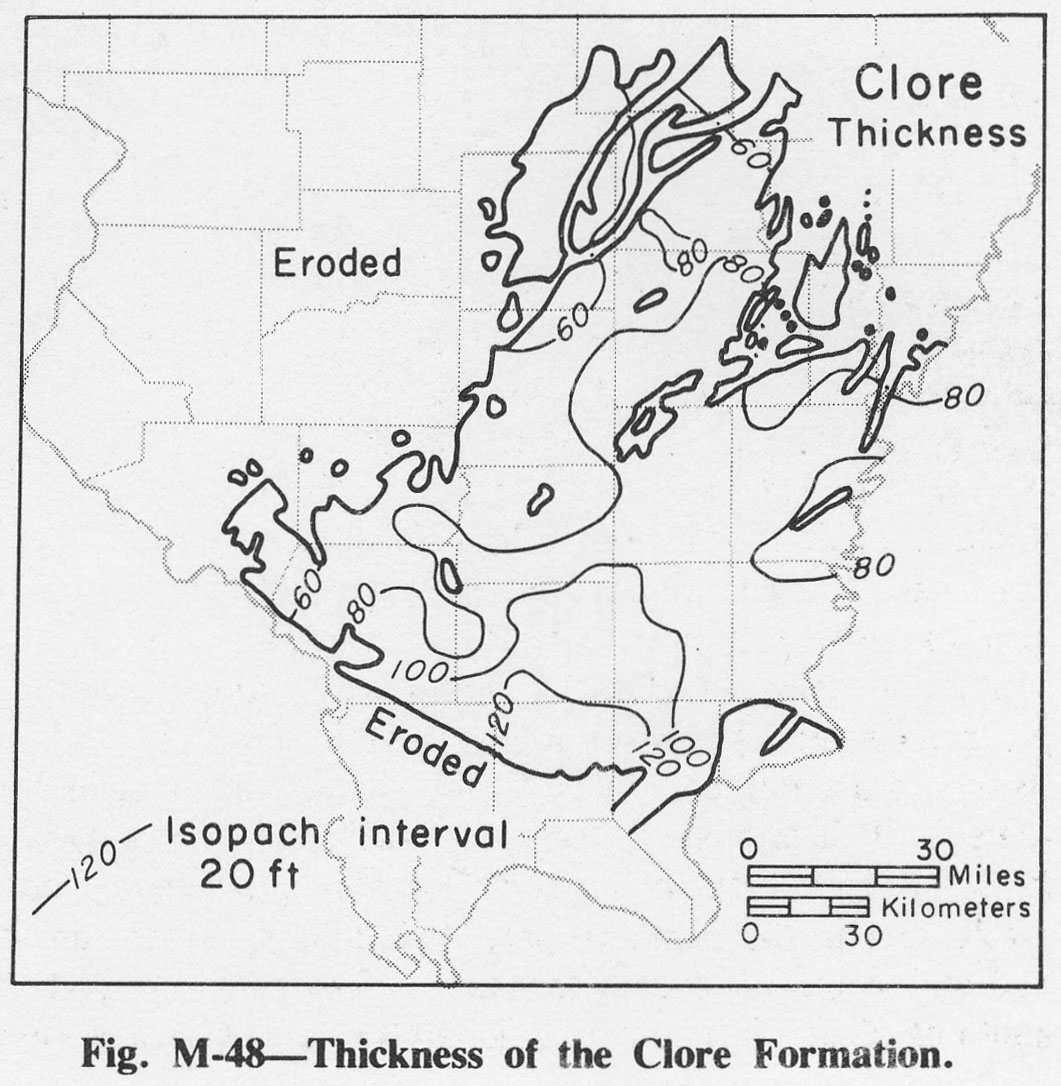
| 14:28, 4 April 2016 | Figure M-48.jpg (file) |  |
233 KB | Fig. M-48 -- Thickness of the Clore Formation. | 1 |
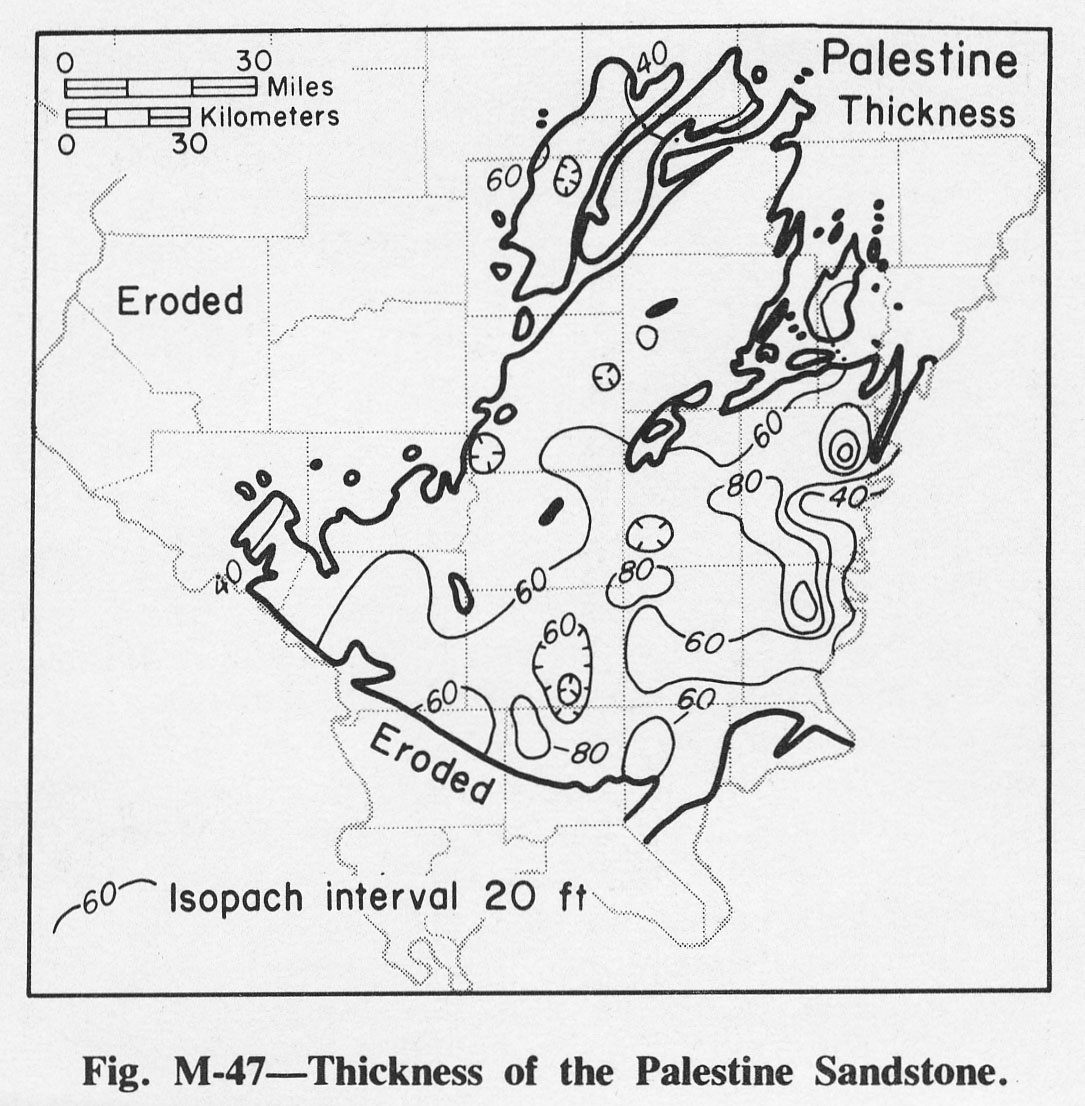
| 14:27, 4 April 2016 | Figure M-47.jpg (file) |  |
249 KB | Fig. M-47 -- Thickness of the Palestine Sandstone. | 1 |
| 14:26, 4 April 2016 | Figure M-46.jpg (file) |  |
239 KB | Fig. M-46 -- Thickness of the Menard Limestone. | 1 |
| 14:26, 4 April 2016 | Figure M-45.jpg (file) |  |
234 KB | Fig. M-45 -- Thickness of the Waltersburg Sandstone. | 1 |
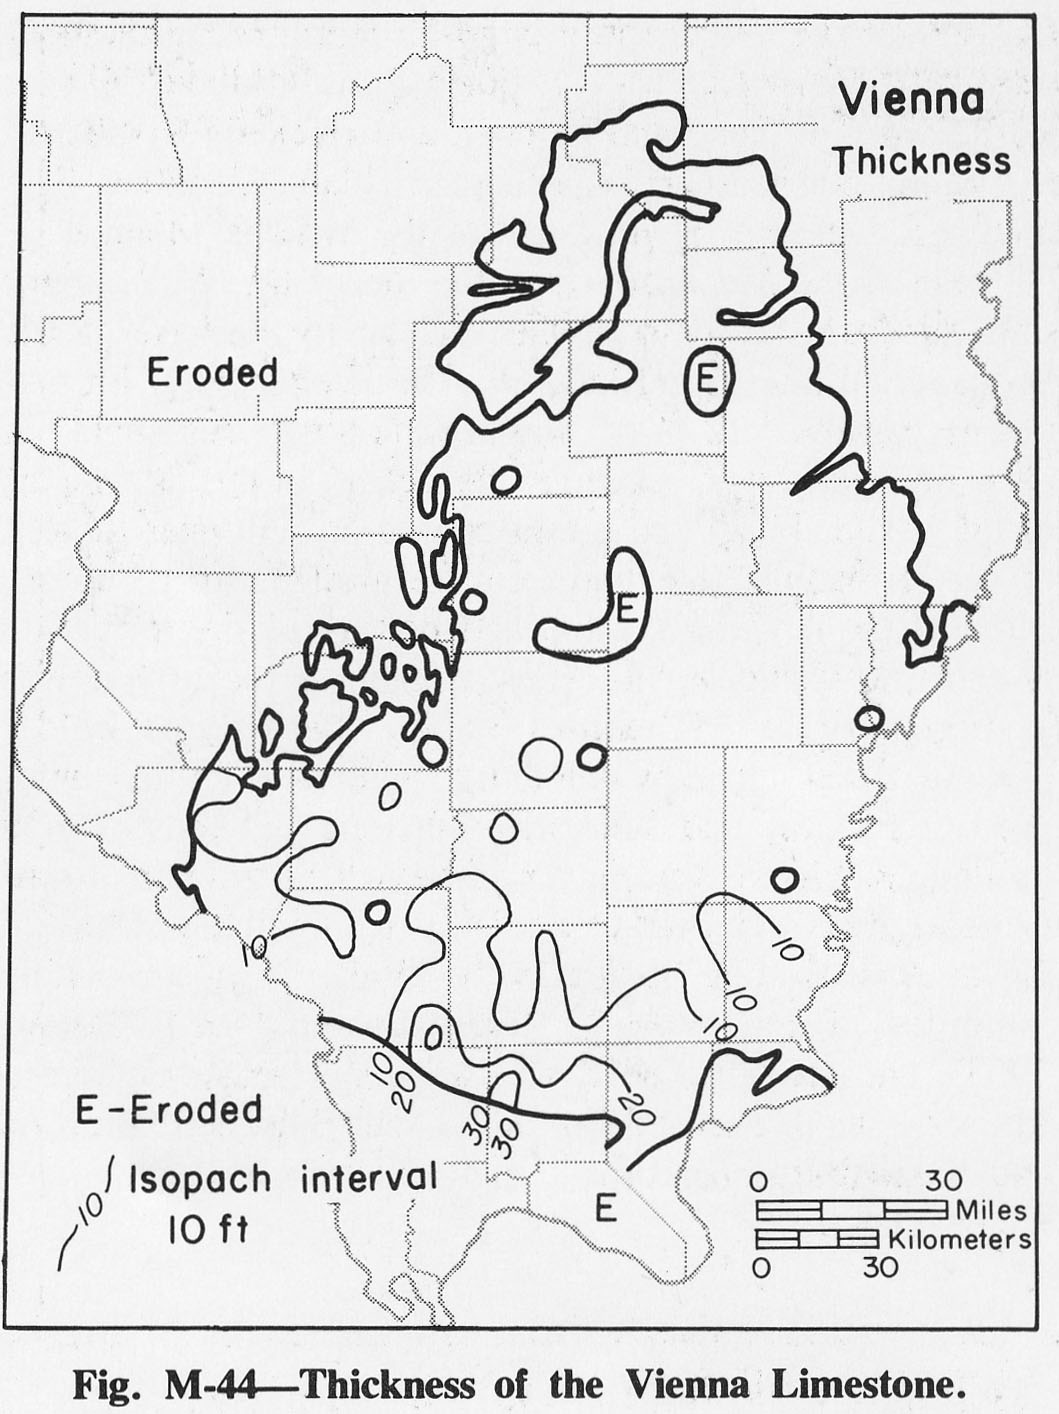
| 14:25, 4 April 2016 | Figure M-44.jpg (file) |  |
220 KB | Fig. M-44 -- Thickness of the Vienna Limestone. | 1 |
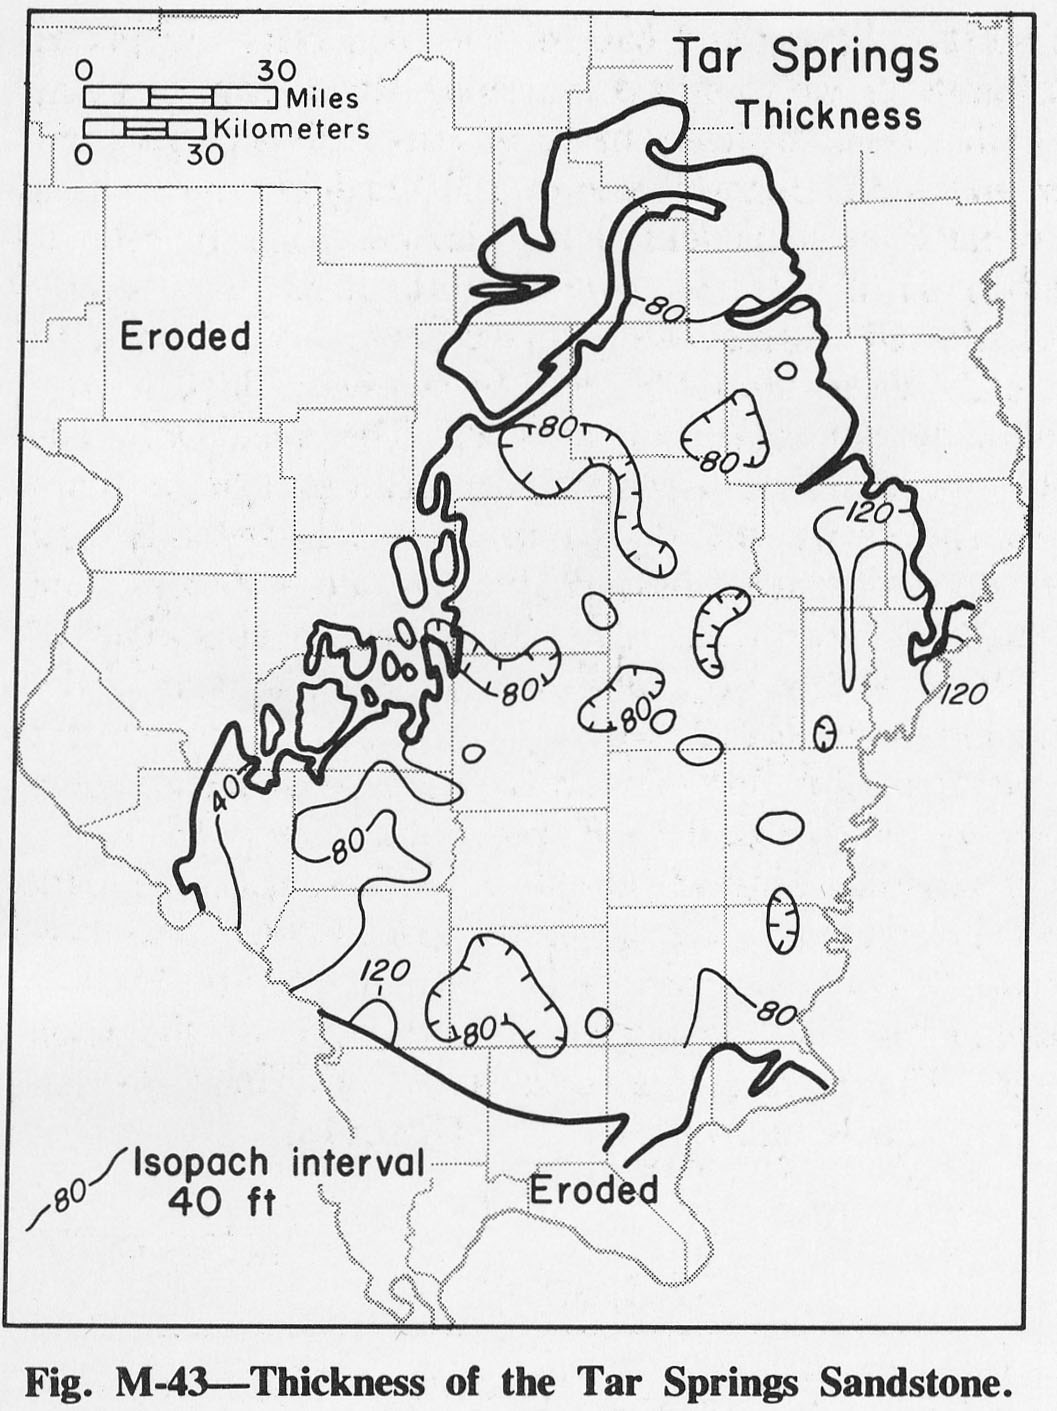
| 14:24, 4 April 2016 | Figure M-43.jpg (file) |  |
228 KB | Fig. M-43 -- Thickness of the Tar Springs Sandstone. | 1 |